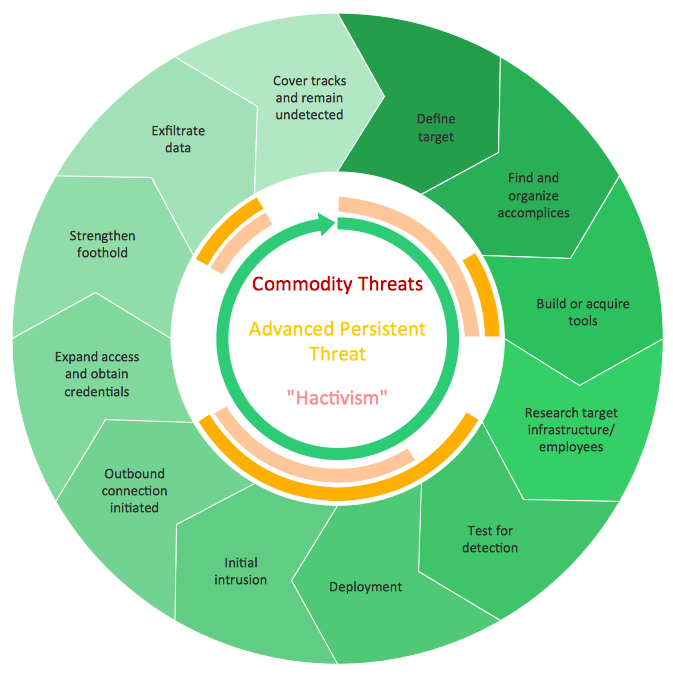
Example 1. Circular Arrows Diagram - Advanced Persistent Threat Lifecycle
Business Diagrams Solution offers the extensive drawing tools, variety of predesigned templates and samples, and Circular Arrows Diagrams library with collection of circular arrow shapes for drawing professional looking Circular Arrows Diagrams in minutes.

Example 2. Circular Arrows Diagrams Library Design Elements
The predesigned shapes are realized in various color gamuts and with different quantity of segments. You will easy find the desired for you taste.

Example 3. Circular Arrows Diagram - CMP Cycle
The Circular Arrows Diagrams you see on this page were created in ConceptDraw DIAGRAM using the tools of Business Diagrams Solution. An experienced user spent 10-15 minutes creating each of these samples.
Use the Business Diagrams Solution for ConceptDraw DIAGRAM software to create your own professional-looking Circular Arrows Diagrams fast and easy, and then successfully use them in your work or education activity.
All source documents are vector graphic documents. They are available for reviewing, modifying, or converting to a variety of formats (PDF file, MS PowerPoint, MS Visio, and many other graphic formats) from the ConceptDraw STORE. The Business Diagrams Solution is available for all ConceptDraw DIAGRAM or later users.
TEN RELATED HOW TO's:
Create flowcharts, org charts, shipping flowcharts, floor plans, business diagrams and more with ConceptDraw. Includes 1000s of professional-looking business templates that you can modify and make your own.
Picture: Basic Diagramming
Related Solution:
You need to draw a Functional Flow Block Diagram? You are an artist? Now it doesn't matter. With Block Diagrams solution from the Diagrams area for ConceptDraw Solution Park you don't need more to be an artist to design the Functional Flow Block Diagram of any complexity.
Picture: Functional Flow Block Diagram
Related Solution:
As restaurant industry is growing rapidly nowadays, researches show that almost half of the adults have worked in a restaurant or a cafe. Moreover, many of them dream to start their own someday. Unfortunately, it takes a lot of time to write a business plan and to find a great location, although some know how to create a restaurant floor plan in minutes or how to plan budget effortlessly. Hiring employees can also cause a lot of headache, but this is crucial for further success, because every guest comes to restaurant for a good service and delicious food. It is also worth noting that restaurant concept is also important, because it defines target audience and influences the menu.
This diagram represents the floor plan of an ongoing sports-theme establishment - restaurant, cafe, or other food service. A number of widescreen monitors installed along the perimeter provide visitors the opportunity to follow the course of a match from anywhere in the dining room of restaurant or cafe. The most of sports fans believe that food and alcohol is a big part of any sports show. That is why the dining room takes the most space - almost 60% of the total establishment space. Nearly all sports fans consume beverages while watching sports - beer, soda or water at least. Thus, the restaurant floor plan designers added a large lavatory there. Moreover, project developers considered unnecessary the gender division of such delicate place - perhaps they guess that only men are watching football, or believe that alcohol will eliminate the most of gender differences.
Picture: How To Create Restaurant Floor Plan in Minutes
Related Solution:
Do you like the professional schemes that you can find on the Internet? Take into account that the most part of them is made using the Best Flowchart Software and Flowchart Symbols. Try you own powers in creating such diagrams!
Flowcharts are the most business diagramming tool. If you are a business manager, you can use flow chart to depict work flow in your organization, develop the effective organizational structure and present the information to investors or other stakeholders. Combining the smart management solutions with ConceptDraw DIAGRAM diagramming engine delivers the set of comprehensive flowchart tools necessary to support professionals in their creativeness and business activity.
Picture: Best Flowchart Software and Flowchart Symbols
Related Solution:
Use ConceptDraw DIAGRAM diagramming and business graphics software for drawing your own PM life cycle flow charts.
Picture: Program to Make Flow Chart
Related Solution:
A more detailed mind map of a business plan for a computer hardware reseller.
Picture: Computer Hardware - Reseller Business Plan
Related Solution:
Louisiana is a state located in the southern region of the United States.
The vector stencils library Louisiana contains contours for ConceptDraw DIAGRAM diagramming and vector drawing software. This library is contained in the Continent Maps solution from Maps area of ConceptDraw Solution Park.
Picture: Geo Map — USA — Louisiana
Related Solution:
Describing a workflow or approval process can take hours and be too complicated, especially since there are options to do it quickly and vividly. Diagrams called flowcharts replace long paragraphs of boring text and represent information in a graphic way. You can draw one on paper or you can use flowchart software to do it quickly and scalable. This kind of software is easy to use and you don’t need any special skills to start using it. In addition, there are a lot examples and predesigned templates on the Internet.
Flowcharts are a best tool for staking out a huge and complex process into some small readable parts. Surely, flowcharts can be drawn manually but the use of standard symbols that make it clear for a wide audience makes a software tool preferred for this task. The core for a successful flowchart is its simplicity. That is why often before beginning making flowchart through software, people draw the sketch on a piece of paper. Designing an effective flowchart means the combination of the data needed to be shown and the simplicity with which you depict it.
Picture: Flowchart Software: A Comprehensive Guide
Related Solution:
How to represent the Interactive Voice Response System? The commonly used way is to draw the IVR diagram. You can draw it manually in a graphic editor, but ConceptDraw DIAGRAM diagramming and vector drawing software offers you the more effective way - to use the powerful tools of the Interactive Voice Response Diagrams Solution for ConceptDraw Solution Park.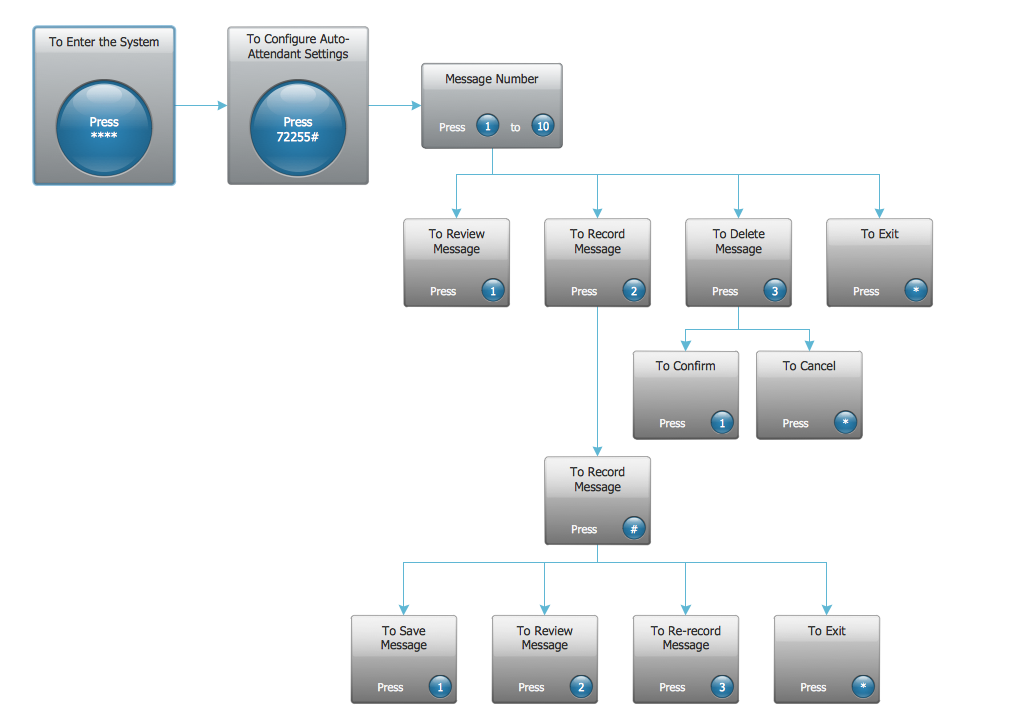
Picture: Interactive Voice Response System
Related Solution:
This sample was created in ConceptDraw DIAGRAM software using the Flowcharts solution.
Picture:
Copying Service Process Flowchart.
Flowchart Examples
Related Solution:

