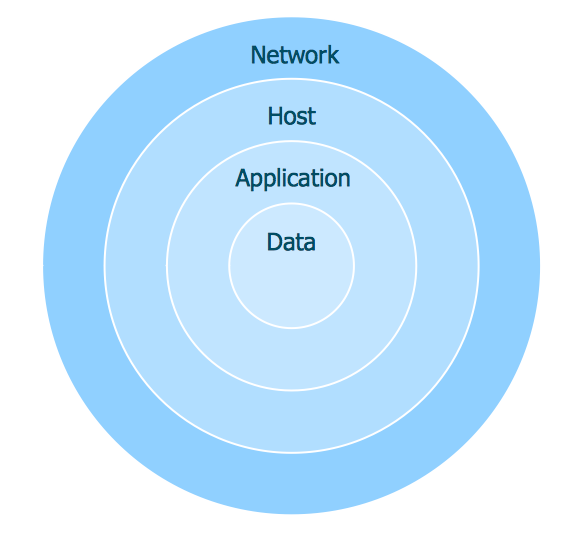
Sample 2. Relative Circular Diagram
This sample was created in ConceptDraw DIAGRAM using the Target and Circular Diagrams Solution from the Marketing Area and shows the Relative Circular Diagram. An experienced user spent 5 minutes creating this sample.
Use the Target and Circular Diagrams Solution for ConceptDraw DIAGRAM to create your own Relative Circular Diagrams of any complexity quick, easy and effective.
The Relative Circular Diagrams designed with ConceptDraw DIAGRAM are vector graphic documents and are available for reviewing, modifying, converting to a variety of formats (image, HTML, PDF file, MS PowerPoint Presentation, Adobe Flash or MS Visio), printing and send via e-mail in one moment.
TEN RELATED HOW TO's:
Effective spatial infographics design, easy geospatial data presenting, now it is reality thanks to the extensive drawing tools of the Spatial Infographics Solution included in “Infographics” Area of ConceptDraw Solution Park.
Picture: Geospatial Data
Related Solution:
ConceptDraw DIAGRAM is a flowchart creating software. This software includes over 20 vector stencils in libraries. These objects allow you to create well-designed flowcharts.
Put an initial object from library to a page and use RapidDraw technology clicking on direction arrows to add new objects to the flowchart. This way you can make flowchart quickly.
Picture: How To Create a Flow Chart in ConceptDraw
Related Solution:
This sample shows the Six Markets Model Chart. It was created in ConceptDraw DIAGRAM diagramming and vector drawing software using the Marketing Diagrams Solution from the Marketing area of ConceptDraw Solution Park.
The six markets model defines six markets that take the central place in the relationship marketing: internal markets, supplier markets, recruitment markets, referral markets, influence markets and customer markets. The six markets model allows the organization to analyze the stakeholders and key market domains that can be important to it.
Picture: Six Markets Model Chart
Related Solution:
Target Diagram is a convenient and visual way of presentation information which is popular and widely used in marketing, business and economics. ConceptDraw DIAGRAM diagramming and vector drawing software extended with Target and Circular Diagrams solution from the Marketing area of ConceptDraw Solution Park is ideal for fast and easy drawing a Target Diagram.
Picture: Target Diagram
Related Solution:
Create your own flow charts of settlement processes using the ConceptDraw DIAGRAM diagramming and vector drawing software extended with the Cross-Functional Flowcharts solution from the Business Processes area of ConceptDraw Solution Park.
Download easy flowchart software to create settlement process flowcharts show steps of monthly settlement with your business quickly and easily.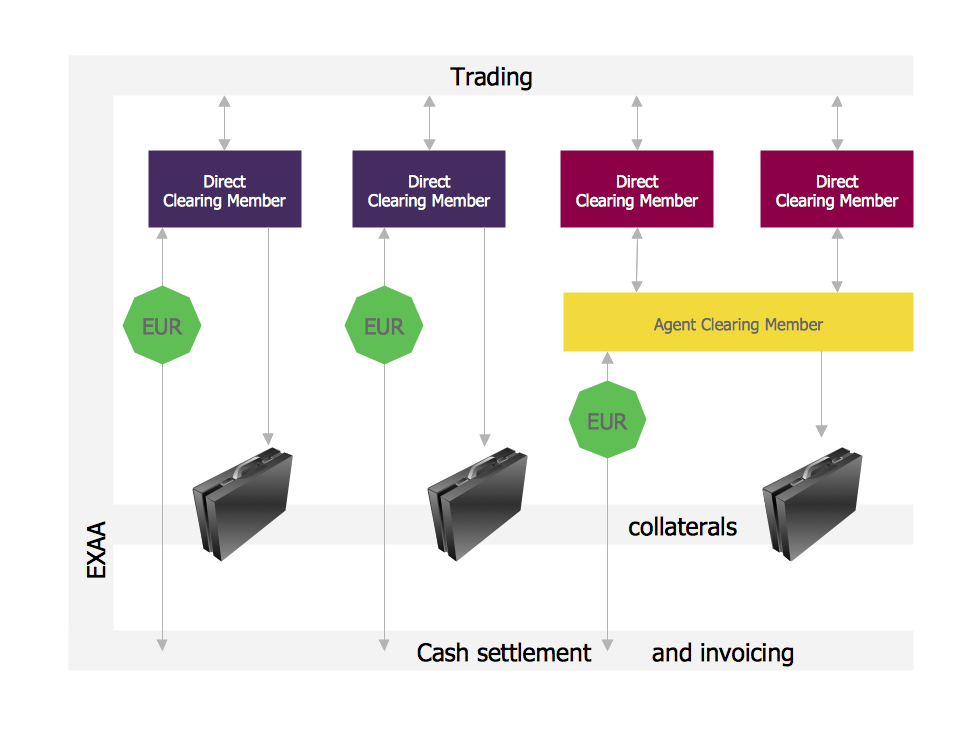
Picture: Settlement Process Flowchart. Flowchart Examples
Related Solution:
Different organizations have different organizational structures. Matrix organization is one of the most popular and widely used type of organizational structure. Use ConceptDraw DIAGRAM diagramming and vector drawing software extended with 25 Typical Orgcharts solution from the Management area of ConceptDraw Solution Park for fast and easy designing matrix organizational chart for your company.
Picture: Matrix Organization
Related Solution:
Compare flowchart software by type, features, and workflow fit. Learn the difference between desktop and online tools and choose the right solution for documentation or collaboration.
Picture: Flowchart Software: Tools for Process and Workflow Diagramming
Related Solution:
The activity of any organization is more or less branchy network of processes. The description of these processes is a hard technical task which requires definite methodology and standards.
According to the IDEF0 standard any process can be described in the form of a block (Activity Box) which has inputs and outputs. The process consists in transformation of inputs into outputs under the influence of the management and in the presence of necessary resources. Outputs of the given process later on can be either inputs for the next process or resources, or management means.
Picture: IDEF0 standard with ConceptDraw DIAGRAM
Related Solution:
This sample was created in ConceptDraw DIAGRAM diagramming and vector drawing software using the Organizational Charts Solution from the Management area of ConceptDraw Solution Park.
The Organizational Chart is a diagram that shows the structure of the organization, different levels of management, hierarchy and the relationships of the organization parts.
Picture: Horizontal Org Flow Chart
Related Solutions:
Organization Chart Templates - Organizational Charts Solution from the Management Area of ConceptDraw Solution Park provides a wide collection of predesigned templates and samples that will help you create the Organizational Charts of any complexity in one moment.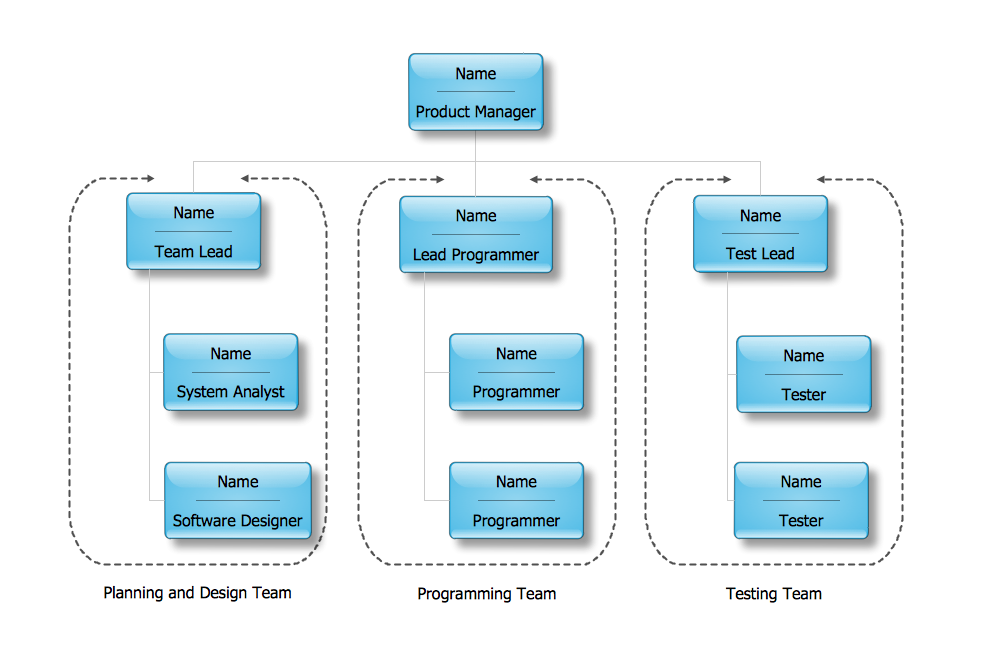
Picture: Organization Chart Templates
Related Solution:
