Block Diagram
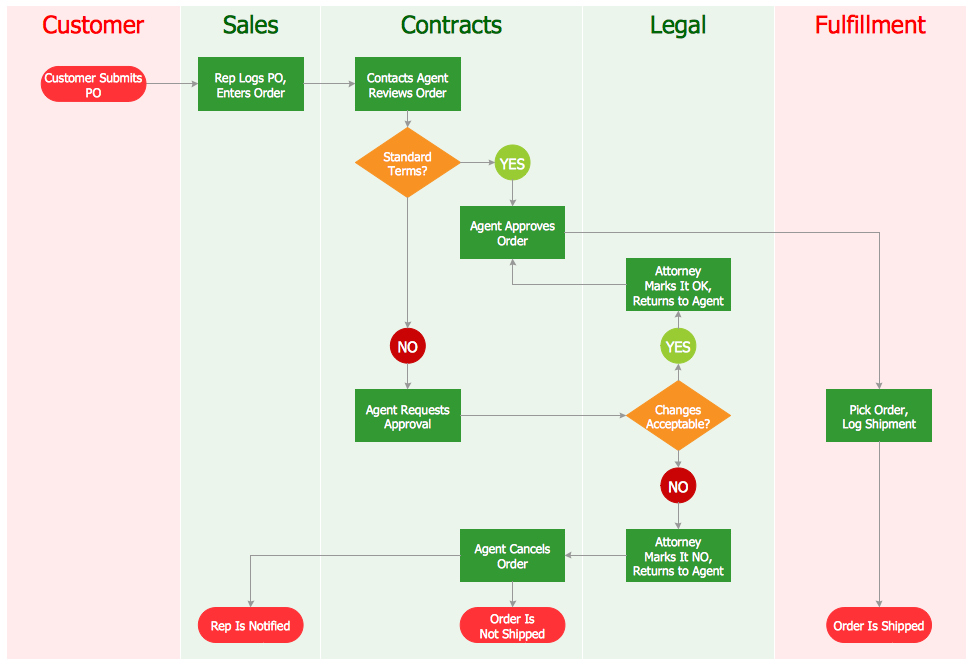
A block diagram is well known to be the one, with help of which it is convenient to illustrate a system as it is, mentioning its principal functions or parts in a way of the blocks connected with help of lines and so showing the relationships of these blocks. Widely used in hardware design, engineering, electronic design as well as software design, the block diagrams are used for higher level, as well as less detailed descriptions, intended to clarify the concepts of the system with no mentioning the details of the implementation itself. There are a few types of the block diagrams exist, one of which is so called “functional block diagram”, commonly used in the systems engineering field of business activity. You can apply such diagrams working for software engineering company as it is very useful tool for the IT specialist to represent the system.
Used for describing the functions as well as relationships between different elements within one system, functional block diagrams are popular nowadays and they can always be created, same as other block diagrams and many more other drawings, with help of ConceptDraw DIAGRAM diagramming and drawing software. Once it’s ready, you can always use already created diagram for illustrating the functions of the system you try to describe with help of “blocks”, which represent the elements of this mentioned system. You can also show the output as well as the input elements of any block using the lines and so to show the relationships between completely different functions and functional sequences as well as paths for signals any time you need.
The functional block diagrams are often necessary for being used in many different complex systems for making it simpler to understand the way these systems work. With help of such diagrams it is always simpler to illustrate the relationships within any system, which has to be described as having a smart and professionally created in ConceptDraw DIAGRAM diagram, it is obvious to see each of the existing elements of a system as well as the way it functions as a whole.
Representing the data as a combination of ordinary functional blocks within one diagram means simplifying its understanding for those who are known to be the “target auditory”, such as the clients of the company, for example, and so such blocks in a way of a diagram can be used in the presentations or simply for the site of the company itself. There are many different specific functional block diagrams technics can be used for building the different software development methodologies.
Thus, any functional block diagram can be an example for the graphical language, which is typically used in the programmable controllers’ design in the industrial computing science, being one of the languages for control or logic configuration, such as a “Distributed Control System (DCS)” or “Programmable Logic Controller (PLC)”.
To succeed in creating a block diagram or any type of it, such as a function one, you can always make your own design symbols if you know how to do it and so to make the diagram using them in ConceptDraw DIAGRAM Although, there’s no need to do it anymore as the new product of CS Odessa, which is ConceptDraw STORE, can be downloaded right now from this site with the solutions available through it and so the stencil libraries with already pre-designed graphic objects.

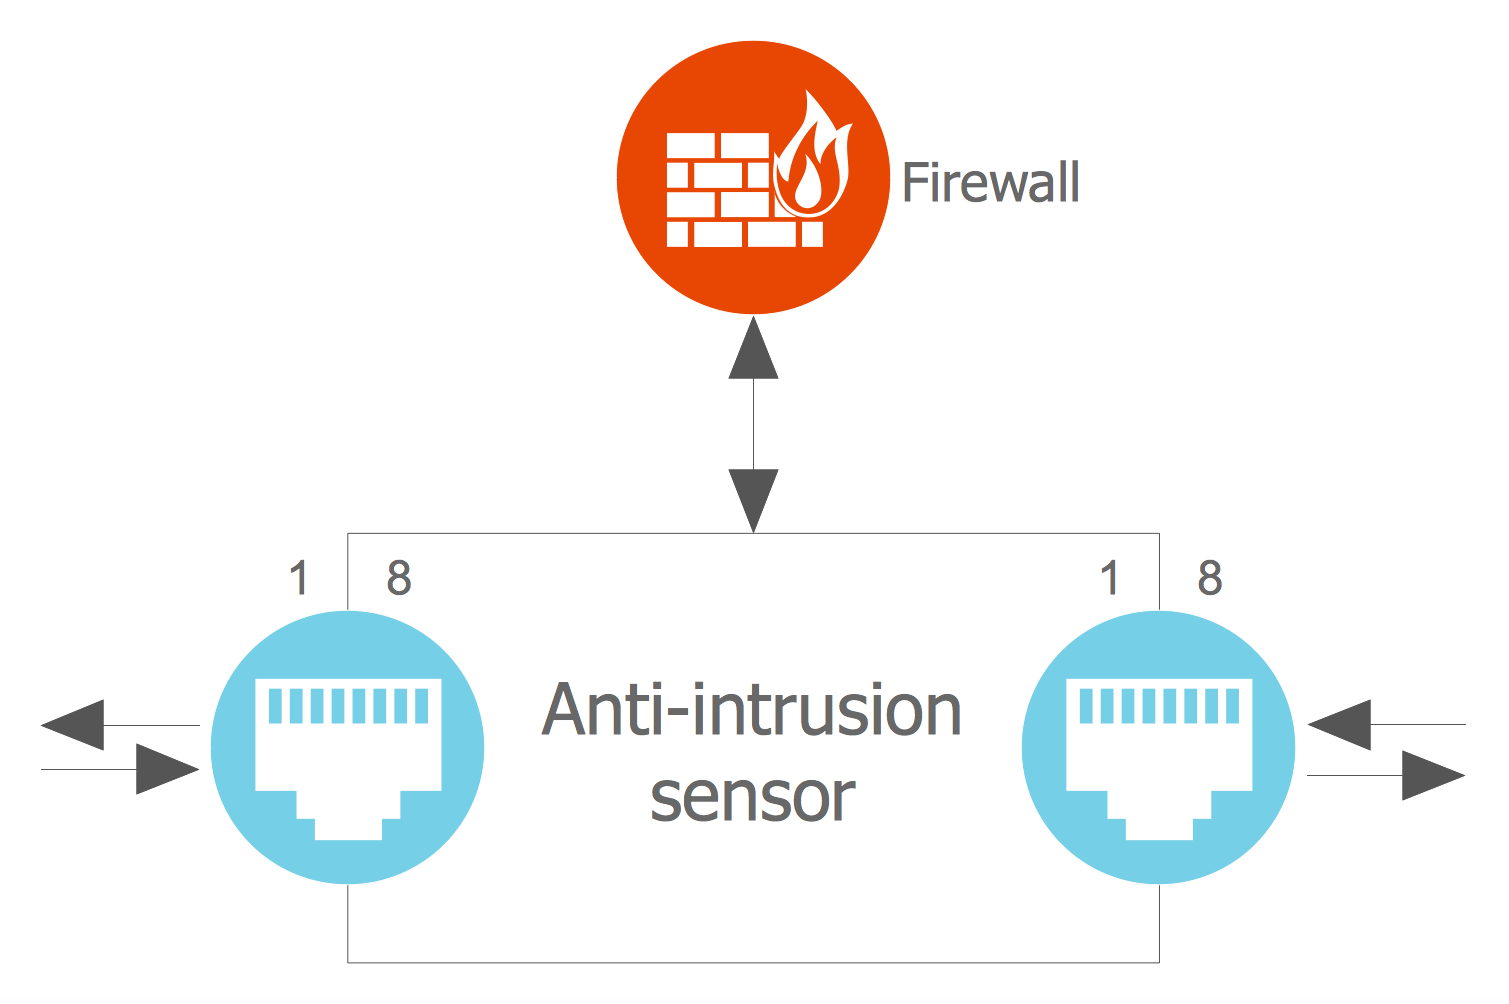
Example 1. Block Diagrams Library Design Elements
Thus, the so called Block Diagrams Solution contains 5 stencil libraries offering a variety of pre-designed stencils and so enabling all ConceptDraw DIAGRAM users to make their own smart looking as well as professionally looking block diagrams. Having this solution, you can simply create any block diagram, including any Functional Block Diagram of any complexity within only a few hours, sometimes even minutes, depending on how familiar you are with the mentioned software and so the application.
The mentioned libraries are Block Diagrams Library, Raised Blocks Library, Blocks with Perspective Library, Connectors Library and Callouts Library. All together the mentioned 5 libraries contain 190 vector stencils and to get them you have to simply download the “Block Diagrams solution” both from the ConceptDraw STORE application after downloading ConceptDraw DIAGRAM unless you have this great and very useful software already.
The “Block diagrams library” includes such stencil elements, as Square, Rectangle, Rounded rectangle, Circle, Ellipse, Filleted rectangle, Curved Rectangle, Diamond, Hexagon, Octagon, Round Starburst, Sharp starburst, Starburst, Blunt starburst, File, Tag, Table, Cloud, Document, Brackets and parentheses, Partial layers, Add-on step block, Concentric layers, Auto-height textboxes, bars, etc.
The “Blocks with Perspective” stencil library includes the following design symbols: Down arrow, Up arrow, Right arrow, Left arrow, Left/Right arrow, Horizontal bar, open left end, Horizontal bar, closed both ends, Horizontal bar, open both ends, Horizontal bar, open right end, Vertical bar, close both ends, Vertical bar, open top end, Vertical bar, open both ends, Vertical bar, open bottom end, Up arrow, open, Down arrow, open, Right arrow, open, Left arrow, open, Up/Down arrow, Elbow block, Square block, Circle block, Frame block and other.
The “Callouts” one can be useful for representing what exactly some people think (or talk) about, as well as for some other purposes. There’re the objects, such as “Side line callout”, “Centre text callout”, “Side line elbow”, “Annotation”, “Bend callout”, “Braces with text”, “Callout”, “Balloon (Rounded rectangle)”, “Balloon (Ellipse callout)”, “Balloon (Cloud)”, “Balloon (Ellipse)”, “2-D word balloon”, “Balloon horizontal”, “Yellow note”, “Balloon vertical”, “Rounded stamp”, “Angled stamp”, etc.

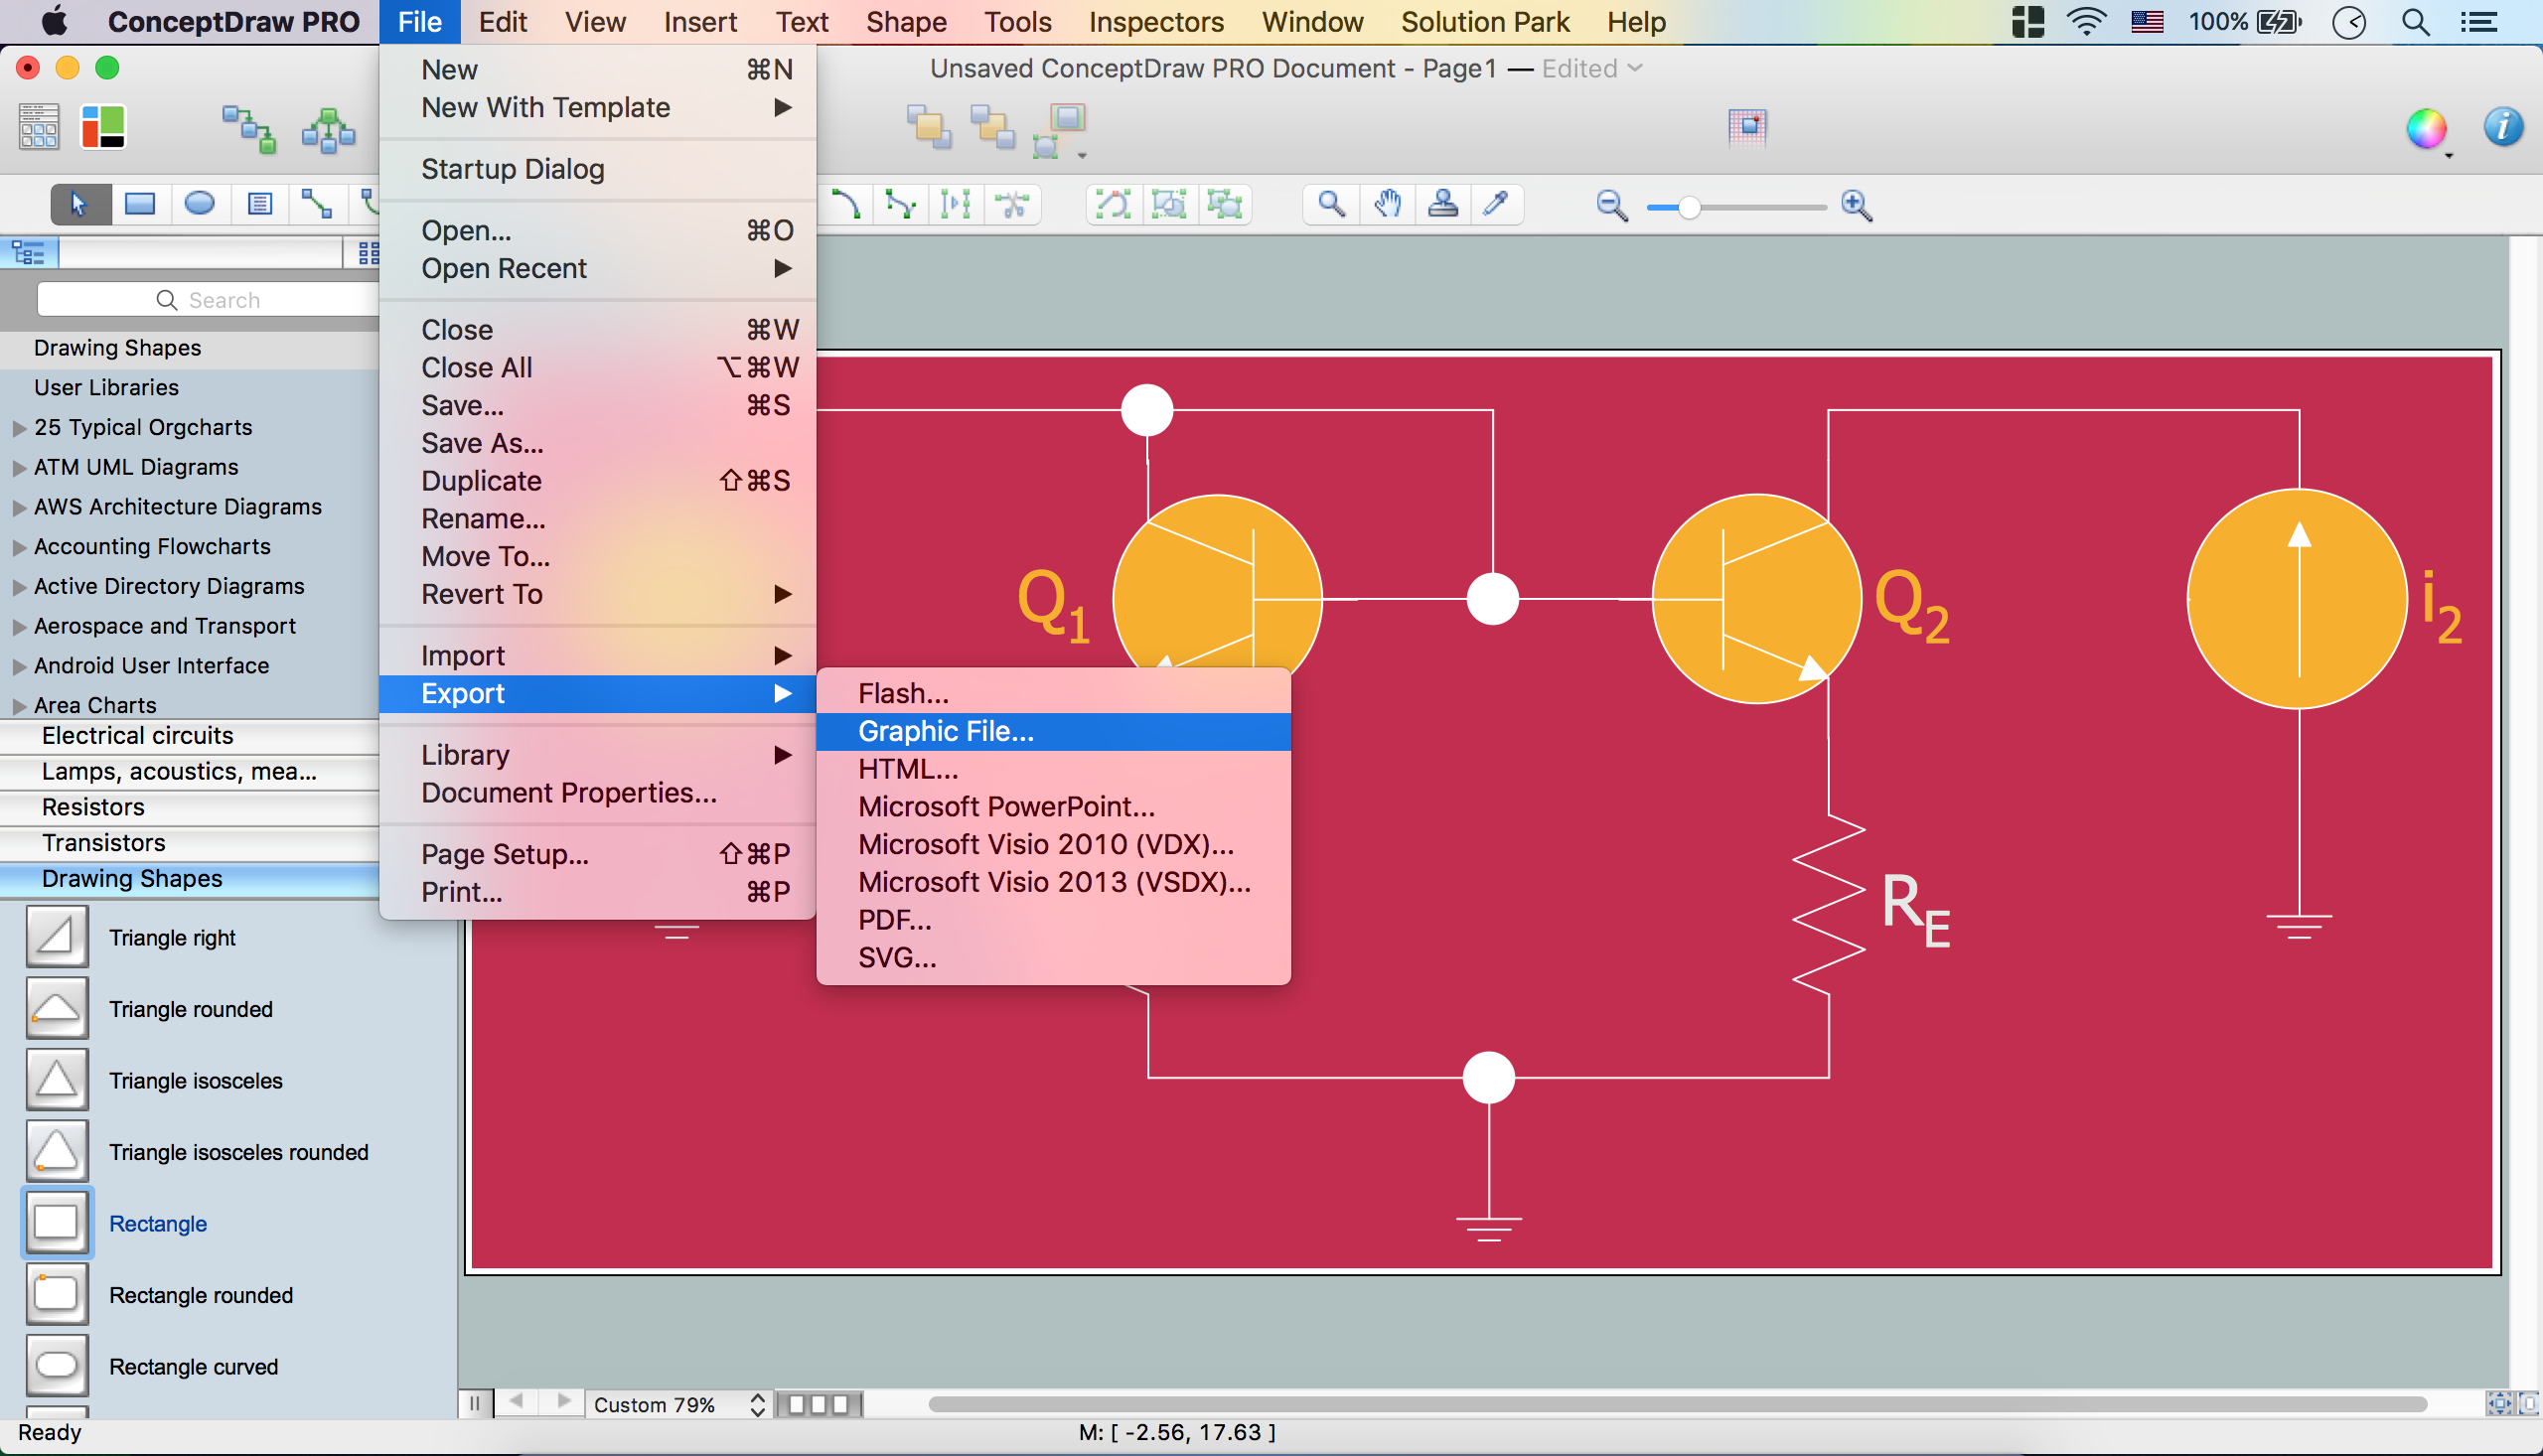
Example 2. Block Diagrams Software
Having ConceptDraw DIAGRAM as well as ConceptDraw STORE means ensuring yourself in becoming capable to create any needed drawing, such as diagram, including any type of block ones, within a very short period of time by using the solutions, especially the “Block Diagrams” one.

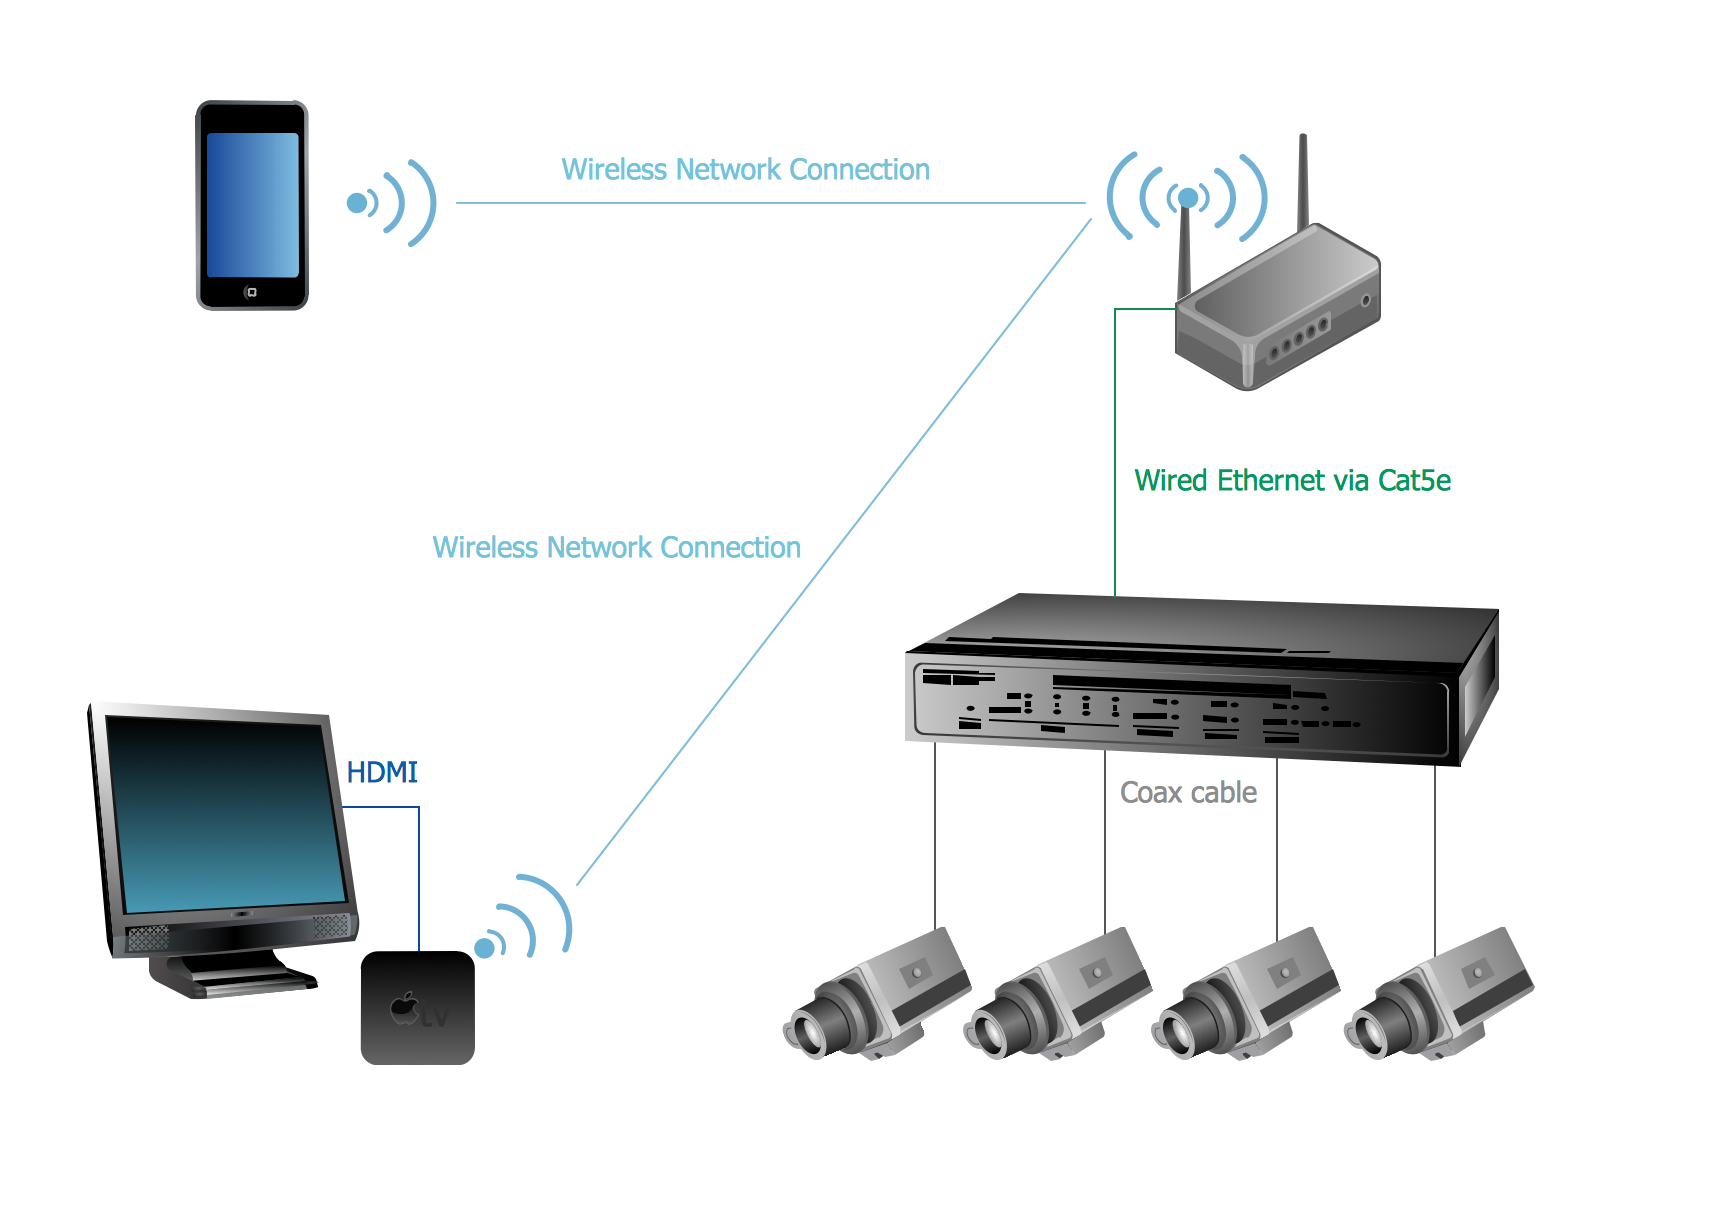
Example 3. Document Management System Architecture
This sample was created in ConceptDraw DIAGRAM using the Block Diagrams Solution. It is a 3D block diagram which visually illustrates the parts of a Document Management System. An experienced user spent 5 minutes creating this sample.
Use the Block Diagrams Solution for ConceptDraw DIAGRAM software to create your own professional looking Block diagrams and schemes of any complexity quick, easy and effective.
The Block Diagrams designed with ConceptDraw DIAGRAM are vector graphic documents and are available for reviewing, modifying, converting to a variety of formats (image, HTML, PDF file, MS PowerPoint Presentation, Adobe Flash or MS Visio), printing and send via e-mail in one moment.
ConceptDraw DIAGRAM is a perfect tool for:
- Designing and planning tasks such as:
- Jacobson Use Cases Diagram
- SSADMN Diagram
- Yourdon and Coad Diagram
- Command OLE Diagram
- Data Modeling Diagram
- SysML Diagram
- Chen RED Diagram
- Martin RED Diagram
- IDEF0 Diagram
- Booch OOD Diagram
- Gane Sarson Diagram
- Memory Object Diagram
- Data Flow Diagram
- FlowCharts
- Graphic User Interface (GUI)
- UML Diagram
- Program Structure Diagrams
- ORM Diagram
- Developing Visualization Solutions
- Project Planning (Gantt Charts, Timelines, Project Schedules)