
Example 1. Flowchart uploaden
This example was redesigned from the file [en.wikimedia.org]
Use the predesigned objects, samples and templates from the Flowcharts Solution for ConceptDraw DIAGRAM to create your own professional looking Flowchart Diagrams quick and easy.
The Flowcharts produced with ConceptDraw DIAGRAM are vector graphic documents and are available for reviewing, modifying, and converting to a variety of formats (image, HTML, PDF file, MS PowerPoint Presentation, Adobe Flash or MS Visio).
TEN RELATED HOW TO's:
These employment forms will help you in the process of management, recruiting and hiring the employees.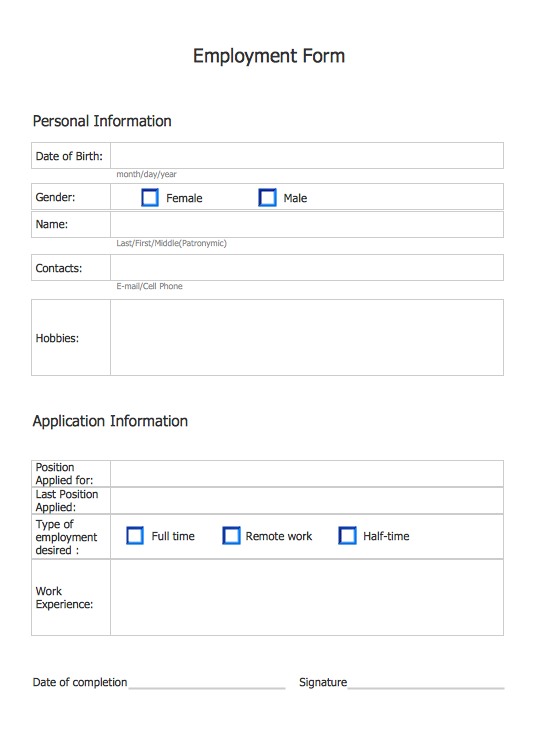
Picture: Employment Form Software
Related Solution:
Accounts Payable Process Flow Chart - ConceptDraw DIAGRAM diagramming and vector drawing software extended with Accounting Flowcharts Solution provides the useful tools that will help you create easily and quickly.
The Accounts Payable Process Flow Chart is very popular and widely used type of accounting flowcharts. Now their designing is simple thanks to the Accounting Flowcharts Solution that provides the Accounting Flowcharts library of predesigned commonly-used shapes and a set of templates and samples.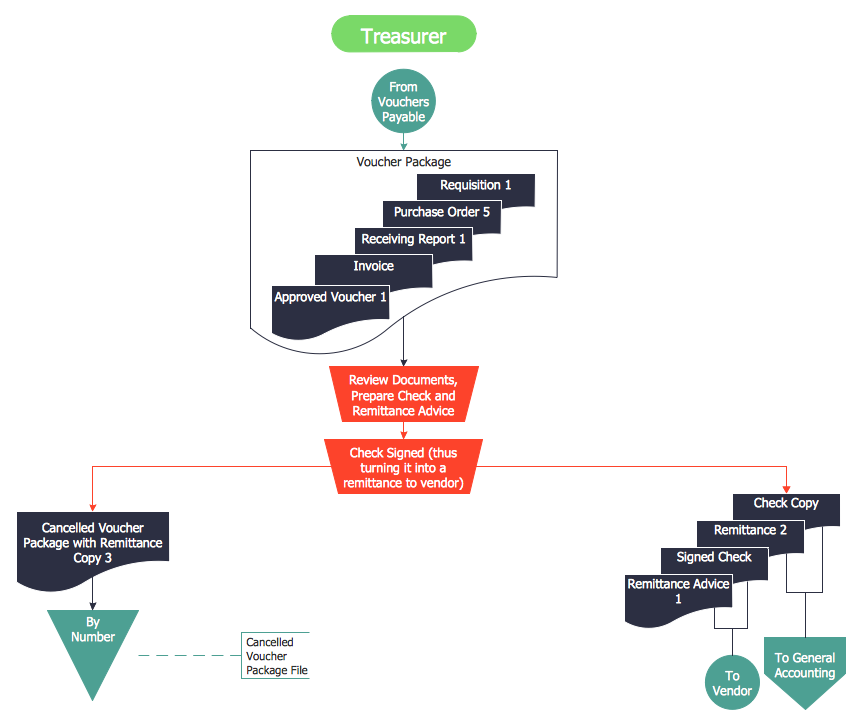
Picture: Accounts Payable Process Flow Chart
Related Solution:
If you ever tried programming, you could face a lot of problems as a beginner. To help yourself, create a flowchart to follow an algorithm logic. Flowchart represents a program as a sequence of steps depicted in special symbols for each type of action.
This image of the interactive diagram made in ConceptDraw DIAGRAM applying the Live Objects technology. The diagram shows the effect of Selection Sort algorithm. The left part of the chart is the input area. The diagram in the central part of the drawing is a flow chart showing of the selection sort algorithm. The flowchart includes basic flowchart symbols, that represent various stages of algorithm. The flowchart symbols are connected with arrows ended lines, that depict the direction of the process flow. On the right side — the result is displayed.
Picture: What Is a Flowchart? Definition, Symbols, Examples and How to Create One
Related Solution:
Any business process consists from a number of tasks carrying out the certain business goal. It is useful to diagram business processes to ensure that they are as foolproof, logical and sequential as possible. This business process diagram describes a typical booking process flow by the example of a cab booking process. It can be used as a roadmap for any booking system implementation. Diagramming a business process allows you to look at the entire project and take into account all types of possible scenarios. Business process diagram helps you investigate and clarify the process thoroughly so that you can find out how it can be improved. Business process diagram supports team communications by ensuring that each process element is clear and everyone in the team is on the same page.
Sometimes your company brings you less profit than you expect it to be, and it’s difficult to reveal the causes. Maybe it’s time to learn new technologies, because business diagram are easily developed by means of special software, so you won’t make any extra effort. In return, you will increase your productivity and get more done in a less time.
Picture: Business Diagram Software
Related Solutions:
UML Diagrams Social Networking Sites Project. This sample was created in ConceptDraw DIAGRAM diagramming and vector drawing software using the UML Use Case Diagram library of the Rapid UML Solution from the Software Development area of ConceptDraw Solution Park.
This sample shows the Facebook Socio-health system and is used at the projection and creating of the social networking sites.
Picture: UML Use Case Diagram Example. Social Networking Sites Project
Related Solution:
When deciding to start your own business, you have to take into account a bunch of different aspects. One of the ways to get inspired is to look through various restaurant floor plans samples or interior photos of already known establishments. This will help you, but keep in mind that a really unforgettable establishment must be unique.
This restaurant floor plan diagram was designed using ConceptDraw Cafe and Restaurant Floor Plan solution. It can be used as a sample while considering a custom restaurant design. With the help of this example you can estimate the amount of furniture best for a dining room or kitchen of the restaurant. In addition, this plan would be useful as a check list when you will consider a list of the furniture and equipment needed for all areas of the future restaurant.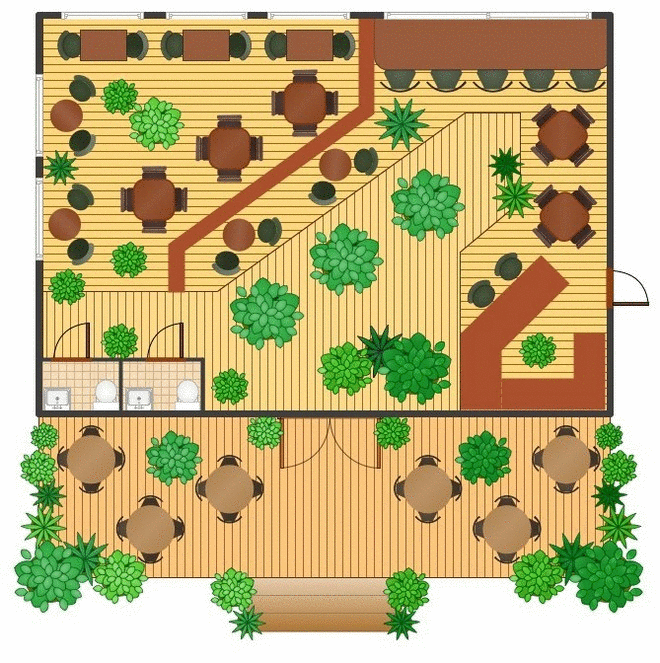
Picture: Restaurant Floor Plans Samples
Related Solution:
ConceptDraw DIAGRAM is a flowchart creating software. This software includes over 20 vector stencils in libraries. These objects allow you to create well-designed flowcharts.
Put an initial object from library to a page and use RapidDraw technology clicking on direction arrows to add new objects to the flowchart. This way you can make flowchart quickly.
Picture: How To Create a Flow Chart in ConceptDraw
Related Solution:
UML Timing Diagram as special form of a sequence diagram are used to explore the behaviors of objects throughout a given period of time.
Picture: Diagramming Software for Design UML Timing Diagrams
You need to draw professional looking BPMN diagrams quick and easy? Pay please your attention on ConceptDraw DIAGRAM diagramming and vector drawing software. Extended with Business Process Diagram Solution from the Business Processes Area it will be ideal for your.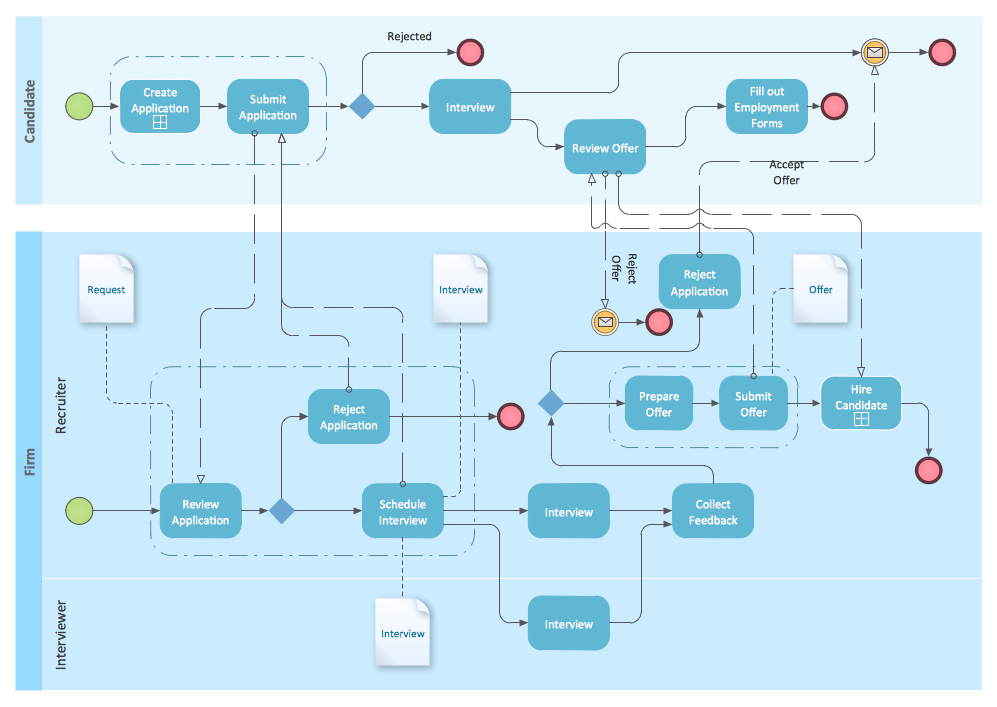
Picture: BPMN
Related Solution:
Flowcharts visualize a process or algorithm of program as step/operation blocks of various shapes connected with arrowed lines showed the process flow direction. They are used to visualize business or technical processes and software algorithms.
Conceptdraw DIAGRAM - feature-rich flowchart software. It will allow you to create professional looking flowcharts.
Picture: Best Flowcharts
Related Solution: