Made with
ConceptDraw
MINDMAP 16

Exam Preparation Mind Map

Universal Diagramming

Here lots tools for situational use for basic drawings, charts, geo-maps, building plans, wiring and computer network communications education, engineering and software diagramming graphics.

Education

Objective

Visualize the complex knowledge to simplify and accelerate the learning and teaching.

Solution Purpose

Illustrate lectures, textbooks, student reports and presentations, educational websites with impressive scalable color pictures and clip art.

Intended For

Intended for educators and students.

Benefits

The Education Solution helps to illustrate the educational documents, presentations and websites quickly and easy with the astronomy, chemistry, math and physics vector pictures and clip art.

Products and Methods

In the background of this solution you use the advantage of ConceptDraw DIAGRAM intelligent vector graphics for educational illustrating and diagramming.

Exam Preparation Mind Map *

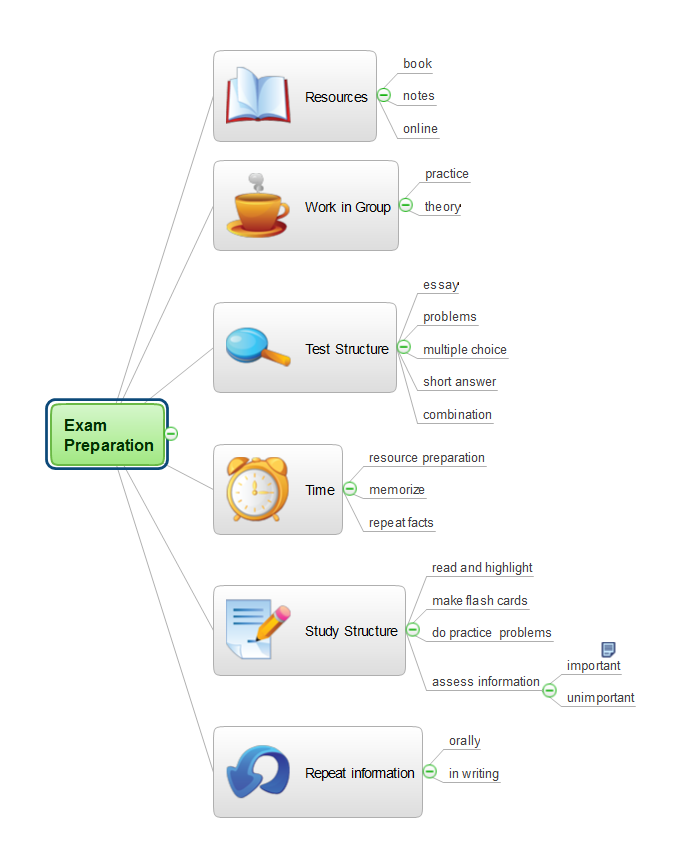
Example 1. Exam Preparation Mind Map


Export to Outline


Exam Preparation
    • Resources
      • book
      • notes
      • online
    • Work in Group
      • practice
      • theory
    • Test Structure
      • essay
      • problems
      • multiple choice
      • short answer
      • combination
    • Time
      • resource preparation
      • memorize
      • repeat facts
    • Study Structure
      • read and highlight
      • make flash cards
      • do practice problems
      • assess information
        • important
        • unimportant
    • Repeat information
      • orally
      • in writing

The Benefits for ConceptDraw MINDMAP Brainstorming Software

  • ConceptDraw MINDMAP is effective for brainstorming, designing mind maps, idea generating, creative and lateral thinking, creativity and problem solving.
  • ConceptDraw MINDMAP is ideal for team and personal work in Business, Marketing and Project Management.
  • The libraries with large quantity of vector objects help to illustrate your mind maps and to make them bright, visual and comprehensible.
  • Use of View Navigator tool lets create presentations from a mind map: you can simply select the map parts you want to present, sequence your slides, and preview the presentation.
  • ConceptDraw MINDMAP provides wide capabilities of importing and exporting in various formats: Microsoft PowerPoint, Microsoft Word, MS Excel, Mindjet MindManager, image, HTML, PDF file.


TEN RELATED HOW TO's:
WLAN →
ConceptDraw DIAGRAM diagramming and vector drawing software extended with Wireless Networks Solution gives the ability to its users to create professional looking WLAN schemes and diagrams quick and easy.WLAN *
Picture: WLAN
Related Solution:
In ConceptDraw DIAGRAM it really is sp simple to draw even the most complex cross-functional flowcharts. Use the RapidDraw technology and Cross-Functional libraries in ConceptDraw DIAGRAM for the best results.How to Simplify Flow Charting — Cross-functional Flowchart
Picture: How to Simplify Flow Charting — Cross-functional Flowchart
Related Solution:
When strategy manager deals with planning a strategy statements for the some upcoming period commonly he use a SWOT matrix to analyse. Filling the four sectioned matrix, helps manager to determine what external and internal factors are influenced on the company's position at the market. And where hidden potential opportunities and threats. Using mind map, made in ConceptDraw MINDMAP it is easy to capture all factors of influence. The next stage is turn a mind map into SWOT matrix with just one click by using the ConceptDraw solution for SWOT and TOWS diagrams.SWOT analysis Software & <br>Template for Macintosh and Windows *
Picture: SWOT analysis Software & Template for Macintosh and Windows
Using the ready-to-use predesigned objects, samples and templates from the Business Diagrams Solution you can create your own professional-looking Venn Diagrams quick and easy.3 Circle Venn. Venn Diagram Example
Picture: 3 Circle Venn. Venn Diagram Example
Related Solution:
ConceptDraw DIAGRAM is a business flowchart software includes the wide flowchart examples package.Basic Flowchart Examples *
Picture: Basic Flowchart Examples
Related Solution:
There are many tools to manage a process or to illustrate an algorithm or a workflow. Flowcharting is one of those tools. However, it may be difficult to show complex processes that require multiple attributes or several people in a simple flowchart, so a cross-functional flowchart would be a solution for that situation. To create such flowchart, group processes and steps to labeled rows or columns, and divide those groups with horizontal or vertical parallel lines. It is worth mentioning that there are different types of cross-functional flowcharts, like opportunity or deployment flowchart. This diagram shows a cross-functional flowchart that was made for a trading process. It contains 14 processes, distributed through 5 lines depicting the participants who interact with the process. Also there are connectors that show the data flow of information between processes. The cross-functional flowchart displays a detailed model of the trading process, as well as all participants in the process and how they interact with each other. The lines in the flowchart indicates the position, department and role of the trading process participants.Cross-Functional Flowchart
Picture: Cross-Functional Flowchart
Related Solution:
ConceptDraw DIAGRAM diagramming and vector drawing software extended with Physics solution from the Science and Education area is a powerful software for creating various physics diagrams. Physics solution provides all tools that you can need for physics diagrams designing. It includes 3 libraries with predesigned vector physics symbols: Optics Library, Mechanics Library and Nuclear Physics Library.Physics Symbols
Picture: Physics Symbols
Related Solution:
ConceptDraw DIAGRAM extended with Divided Bar Diagrams solution from Graphs and Charts area of ConceptDraw Solution Park is the best software for quick and simple drawing the Divided Bar Diagrams and Bar Diagram Math.Bar Diagram Math *
Picture: Bar Diagram Math
Related Solution:
The Value Stream Map is one of the key tools of lean practitioners. It helps aptly describe the manufacturing processes both complex and simple. It supports process improvement, allows identifying waste, and reducing process cycle times. Use ConceptDraw DIAGRAM extended with Value Stream Mapping solution to document processes starting with a professionally designed Value Stream Mapping template.Value Stream Mapping Template *
Picture: Value Stream Mapping Template
Related Solution:
ConceptDraw MINDMAP has a addition to the ConceptDraw Solution Park that provides a creative approach to visualizing quality processes, Quality Mind Map Solution.Mind Mapping in the Quality Management *
Picture: Mind Mapping in the Quality Management
Related Solution:
ConceptDraw
MINDMAP 16