Process Flowchart Symbols
The Process Flowchart or Process Flowchart Diagram (PFD) is a visual representation relations between major parts of the system, the steps in a process, and even connections between various systems. For drawing Process Flowcharts are used a lot of generally excepted process flowchart symbols - these are special objects used to depict the actions and process steps, and also lines and arrows to connect the objects to display the sequence of these steps and relationships between them.
Creation of Process Flowcharts is an important tool for documenting processes on the stages of planning and also implementation a project, they effectively display how the process functions now or must to function. Thanks to this type of diagrams you have excellent possibility to represent in details the complex processes using the commonly used process flowchart symbols. The Process Flowcharts let to make the processes clearly understandable for all with a goal of processes improvement, uncovering and elimination problems, reduction costs and increasing productivity, to facilitate the communication, lighten and improve the teamwork.
The possibility to easy create professional-looking and attractive Process Flowcharts, Business Process Diagrams and Maps which visualize the steps of complex processes is provided by Business Process Diagram Solution from the Business Processes Area of ConceptDraw Solution Park. This solution includes 16 libraries with 230 process flowchart symbols from BPMN 1.2 and BPMN 2.0.

Example 1. Process Flowchart Symbols
All these process flowchart objects are vector and ready-to-use at your flowcharts and diagrams. You can easy drag them to your document, combine, group, resize and recolor without lost of quality.
 Activities symbols library
 Activities BPMN 1.2 symbols library
 Business Process - Rapid Draw symbols library
 Choreographies symbols library
 Connections BPMN 1.2 symbols library
 Conversations symbols library
 Data symbols library
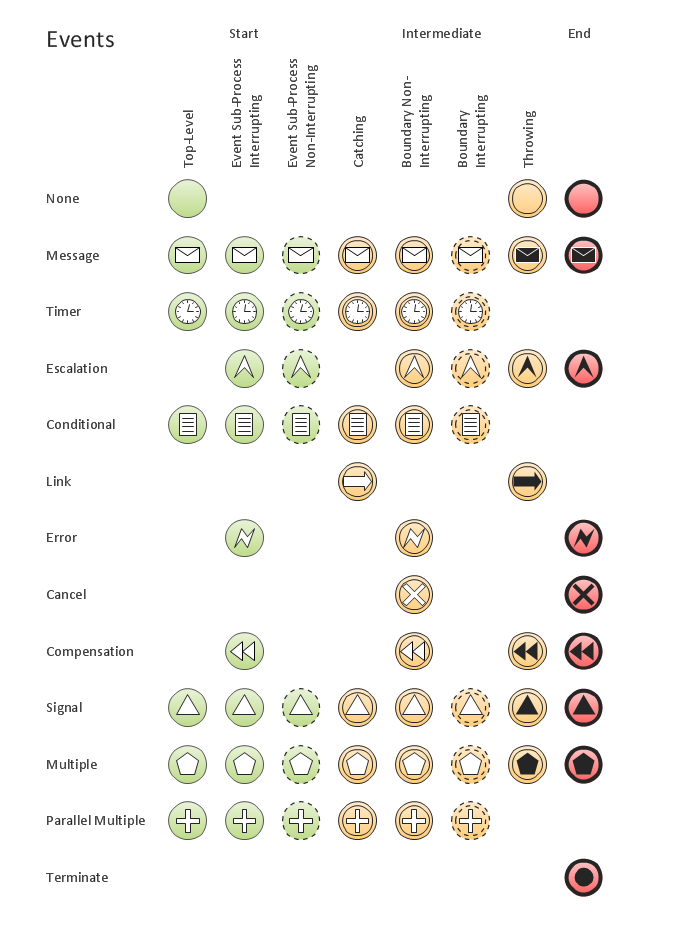
 Events symbols library
 Events BPMN 1.2 symbols library
 Expanded Objects symbols library
 Expanded Objects BPMN 1.2 symbols library
 Gateways symbols library
 Gateways BPMN 1.2 and Artifacts symbols library
 Swimlanes symbols library
Swimlanes BPMN 1.2 symbols library
Swimlanes symbols library
Swimlanes BPMN 1.2 symbols library
For drawing any Process Flowchart follow the next simple steps:
- Add the process flowchart symbols to the diagram by dragging them from the suitable libraries to the document page, begin with adding the Start object. Arrange the diagram objects, add the text and use Line, Fill, Shadow and Text tools to format the objects to make your diagram pictorial and attractive.

Example 2. Adding the Objects
- You can add the next objects choosing them from the offered set when clicking the RapidDraw arrows of already added objects.

Example 3. RapidDraw Feature
- Use the commands from the object's Action menu to set specific parameters (select the object and the Action icon will appear, click on the icon to open the Action menu).

Example 4. Action Feature
- Connect the objects with Smart Connector tool from the Home toolbar.

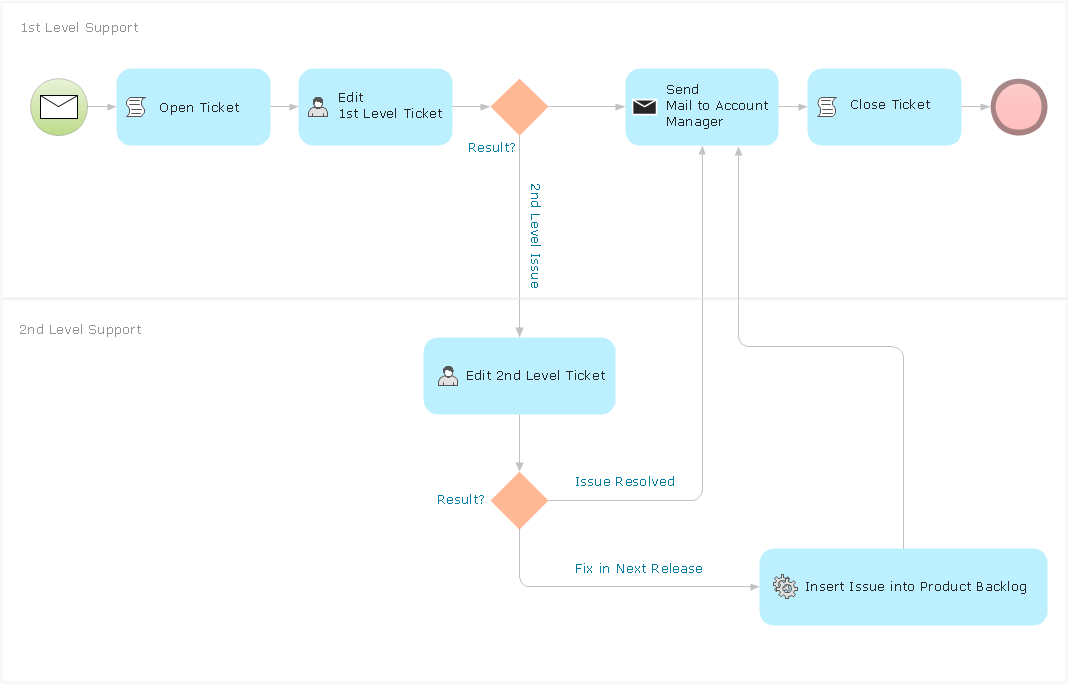
Example 5. Business Process Diagram - BPMN 2.0 Booking


ConceptDraw DIAGRAM is the best process flowchart software rich for the process flowchart symbols for professional and effective drawing, and also for the collection of ready templates and samples which are represented at ConceptDraw STORE.

Example 6. Business Process Diagram Solution
Use a variety of process flowchart symbols from the libraries of Business Process Diagram Solution for ConceptDraw DIAGRAM diagramming and vector drawing software and also collection of samples and templates to create your own professional looking Process Flowcharts, Process Flow Maps, Process Diagrams, Process Flow Documents, Process Flow Models, Process Flow Analysis Charts fast, easy and effective.