How to draw Metro Map style infographics? (New York)
The New York City Subway is the best rapid transit system in New York, America. It is owned by the City itself, being leased to the so called local “Transit Authority”. The mentioned Authority is basically a subsidiary agency taking care of the stations and the trains of the Subway since it was opened in 1904. The New York City Subway is among the oldest public transit systems in the world. It is also one of the most used metro systems in the world. There’s a metro system with the most quantity of stations, 472 of which are nowadays in operation located throughout the boroughs of Brooklyn, Manhattan, the Bronx and Queens, offering service 24 hours per day every single day, no matter if it’s a holiday or not.
The system in the mentioned subway is also one of the longest in the world, containing 380 kilometres of routes. Comparing to the others, the New York City Subway is the busiest rapid transit rail system in the world. It is also well-known that it is on the seventh place among the busiest rapid transit rail systems in the whole world. As statistics shows, in 2015, the subway delivered over 1,76 billion rides, which is about 5,7 million rides a day on weekdays and a combined 5,9 million rides every single weekend. The mentioned ridership continues to increase, thus, already in 2014 there were over 6,1 million people riding the subway system. There are 25 services of the system, 22 of which pass through Manhattan. Many of the existing stations and lines have both local and express services, having from three to four tracks.
Nowadays, the official transit maps of the “New York City Subway” are based on the design, developed in 1979 by “Michael Hertz Associates”. The maps are known to be not as well geographically accurate because of the complexity of the system. Nevertheless, they still show the major city streets. Earlier diagrams of the subway had the perception of being not as geographically accurate than the diagrams nowadays. In 2011, the “MTA” offered to use a so called “Vignelli-style interactive subway map”. The name for the online map was chosen to be "The Weekender", providing information about any of the planned works from Friday night to early Monday morning.
470 out of 472 stations are served 24 hours a day, being accessed by staircases going down straight from the street level. Many of the mentioned staircases are painted in a green, some of them have unique entrances reflective of their location or date of construction. A few station entrance stairs are built into the adjacent buildings themselves. And almost all station entrances feature colour-coded square or globe lamps.
275 of all the stations on the New York City Subway are fully underground, 153 of them are elevated ones, 29 out of 472 are on an embankment and 15 are simply the open cut stations. Thus, 61% of all the stations are below the surface: about 2% of them are mostly below the surface and 59% of them are fully underground. At the same time 39% of all stations are “overground” or above the surface.
Typically, each of the subway stations has waiting platforms from 150 to 180 metres long. Some IND platforms may be from 201 to 227 metres long and the platforms of the former commuter rail stations (for example, the IND Rockaway Line) are even longer than the previously mentioned ones. Because there are so many transit lines, one platform or a set of platforms can often serve over one service. Passengers must look at the signs at the platform entrance steps as well as over each track in order to see which of the trains stop there.
The common platform configurations are the following: for lines with either three or four tracks with express service, all local stops will have only the side platforms. At the same time the middle one (or two tracks) cannot be expected to be stopping at the station. In this case, the express stations usually have two island platforms. One of the mentioned “island platforms” is known to be used for the local as well as express in one direction, when another for both express and local in the other direction. Each of the island platforms provides a cross-platform interchange between express and local services. Also, on a double track line, a station may have one so called “centre island platform”, which is used for trains in both directions. There also may be 2 side platforms: one for a train in each of the directions.
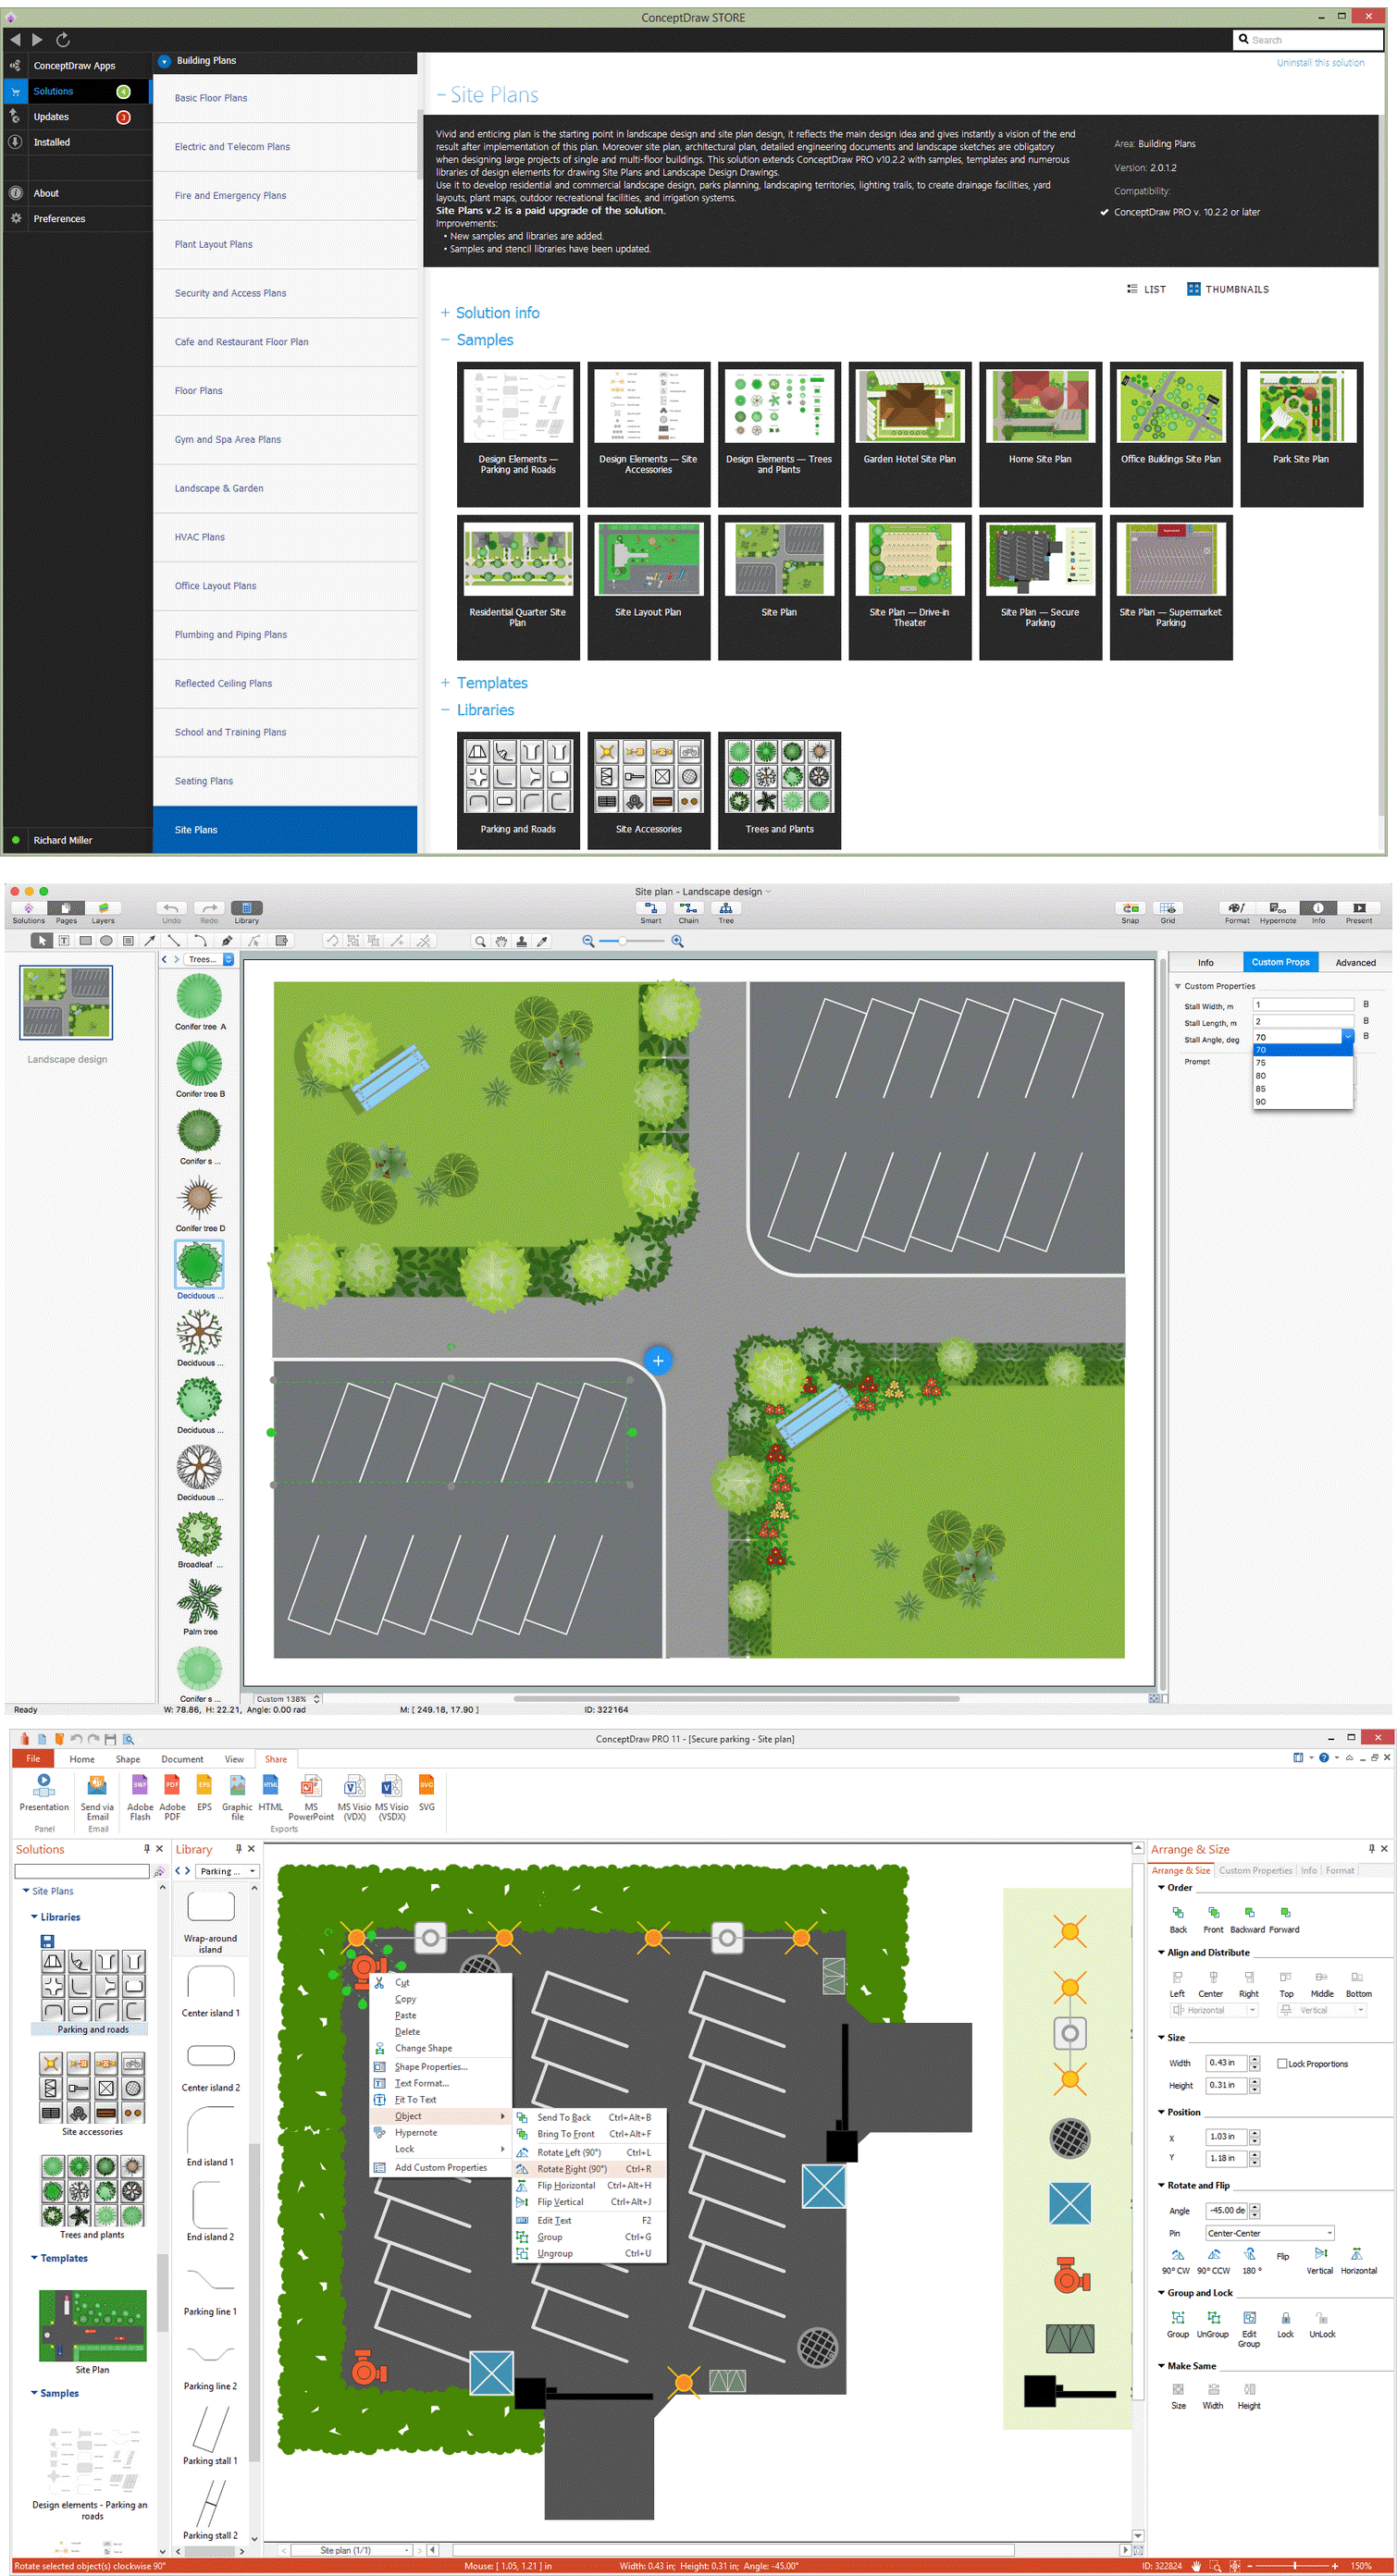
In case, it’s needed to create a map of the subway, mentioned in this article, the New York City one, then you can feel free to use ConceptDraw DIAGRAM to make the amazing drawings of all the stations from a scratch. In case you prefer to use the pre-made templates and examples of such maps, then you can always download the needed solution from ConceptDraw STORE, which is a unique application, developed by CS Odessa for the purpose of using the needed tools for each of the drawings by the ConceptDraw DIAGRAM users in order to simplify their work and so to get the final result much sooner.
Thus, having ConceptDraw DIAGRAM mapping and drawing software extended with “Metro Map solution” from the ConceptDraw STORE application, which (application) can be downloaded from this site, you’ll ensure yourself in creating an amazingly looking metro map of the New York tube, as well as any associated infographics mentioning the Lines, the Stations as well as the Landmarks using the needed design objects from the stencil libraries of the solution, mentioned above.

Pic. 1. Metro Map Solution in ConceptDRaw STORE
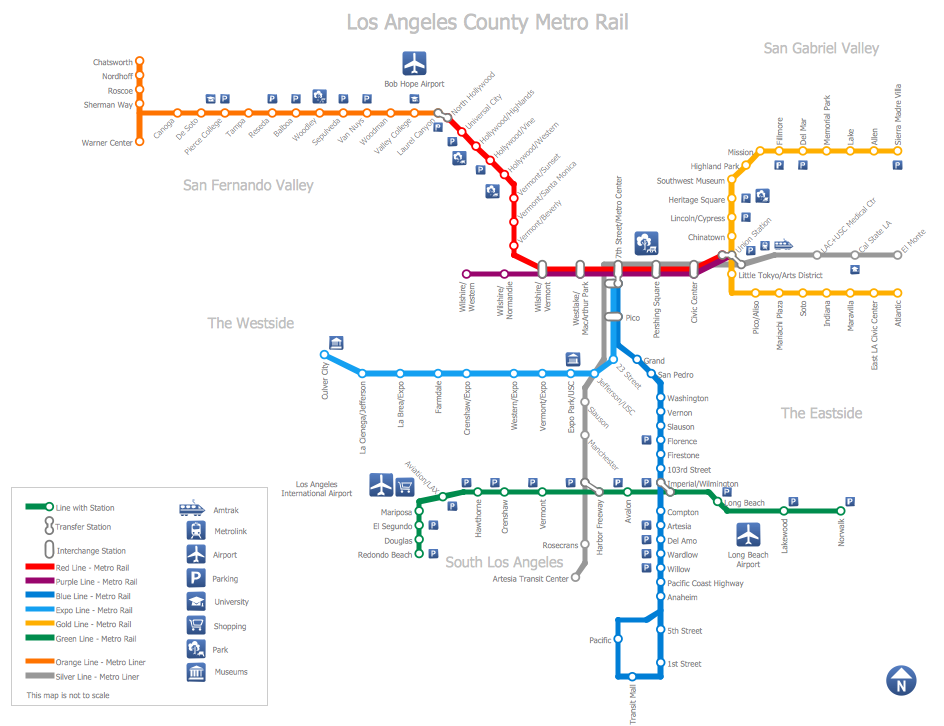
Apart from creating a map of the metro in New York, you can always also make metro maps of other cities, such as London, Los Angeles, Tokyo, Moscow, etc., using the pre-made samples of such stations from the solution. Also, you can make many different route maps, bus as well as other transport schemes and tube-style infographics from a scratch using the available for all ConceptDraw DIAGRAM users stencil library with 38 vector shapes related to the metro map drawings from, again, the same solution — Metro Map one.
New York City Subway
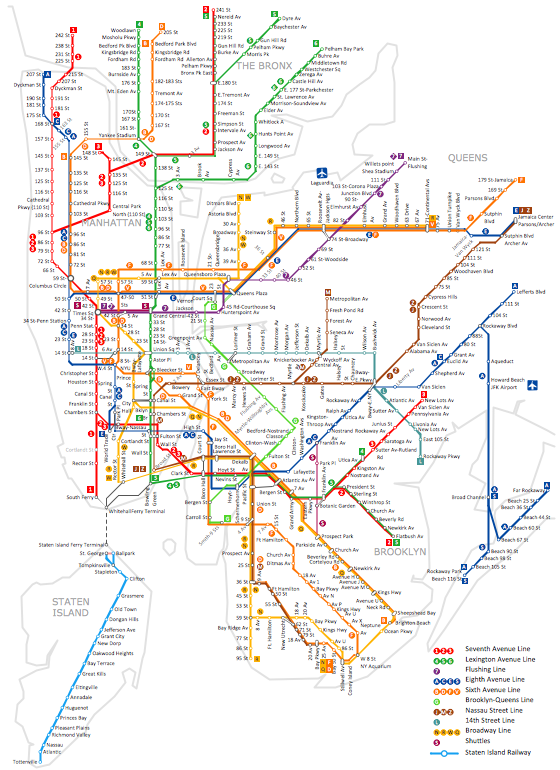 The first underground line of the subway opened on October 27, 1904, almost 35 years after the opening of the first elevated line in New York City.
About this sample
- The sample you see on this page was created in ConceptDraw DIAGRAM using the Metro Map solution, and demonstrate the solutions capabilities and the results you can achieve using this solution.
- This map was created in ConceptDraw DIAGRAM using the Transport Map library from the Metro Map solution. An experienced user spent almost 8 hours creating such complex chart.
- All source documents are vector graphic documents. They are available for reviewing, modifying or converting to a variety of formats (PDF file, Power point Presentation, image or MS Visio VSDX) from the Template Gallery of ConceptDraw DIAGRAM for all users who have installed Metro Map solutions.
See also:
Video Tutorial "How to draw Metro Map style infographics?"
Tutorial explains Metro Map tools, demonstrate how to add stations to the map, control the direction in which you create new stations, change lengths, add text, Lines and Landmarks objects. This video demonstrate ConceptDraw Metro Map Solution.