Mac Compatible Remote Presentation
Mac Compatible Remote Presentation
If you need to present business ideas use ConceptDraw Remote Presentation for Skype solution.
Make Mac Compatible Remote Presentation in four steps :
- Download and install ConceptDraw MINDMAP
- Use the brain storm mode to generate ideas
- Format mindmap, add relations, notes, clipart
- Create automatic presentation

Sample 1. ConceptDraw MINDMAP is ideal for
"ConceptDraw MINDMAP is ideal for" sample is created using ConceptDraw MINDMAP mind mapping software. This mind map example helps to learn how to show remote mind map presentation via Skype on Mac and PC.
Use this mindmap example for implementation of solution Remote Presentation for Skype from ConceptDraw Solution Park.
See also Samples:
-
Mind Maps
-
Mind Map Exchange
-
Marketing — Mind Maps
- Mind Maps — Idea Communication
- Mind Maps — Presentation Exchange
TEN RELATED HOW TO's:
ConceptDraw Wireless network diagram helps network engineer to design, mount and support WLAN or WWAN.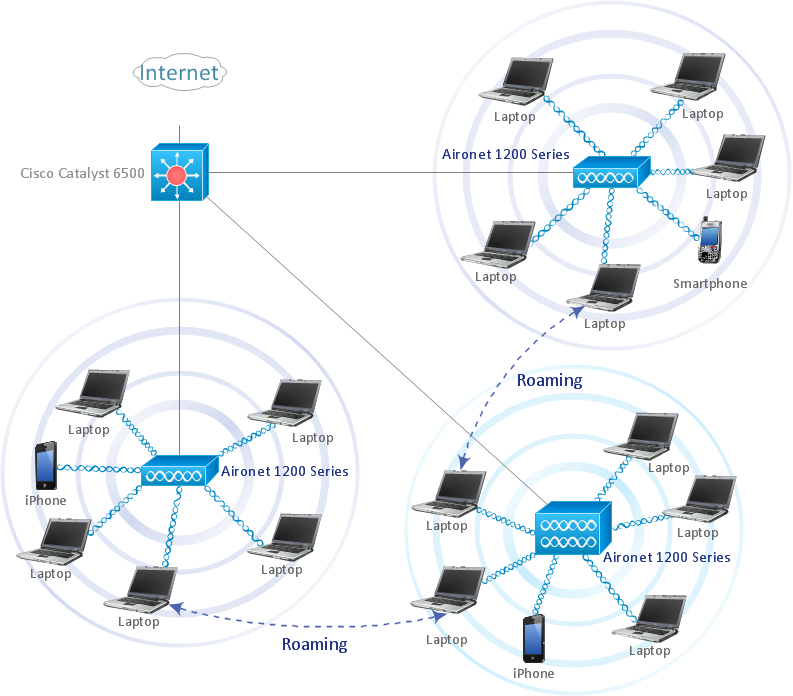
Picture: Wireless Network WLAN
Related Solution:
This sample was created in ConceptDraw DIAGRAM diagramming and vector drawing software using the Seven Management and Planning Tools Solution from the Business Productivity area of ConceptDraw Solution Park.
This sample shows the Property Management matrix, the ideas are ordered in regards to importance and frequency. This matrix gives the ability to turn the theory into quantifiable data.
Picture: Property Management Examples
Related Solution:
ConceptDraw PROJECT delivers a rich set of built-in functionalities and optional product extensions that support your daily workflow in time-saving and creative ways. This video lesson will teach you how to work with costs in your project document.
Picture: Project — Working With Costs
If you want to find a way to understand complex things in minutes, you should try to visualize data. One of the most useful tool for this is creating a flowchart, which is a diagram representing stages of some process in sequential order. There are so many possible uses of flowcharts and you can find tons of flow charts examples and predesigned templates on the Internet. Warehouse flowchart is often used for describing workflow and business process mapping. Using your imagination, you can simplify your job or daily routine with flowcharts.
Warehouse flowcharts are used to document product and information flow between sources of supply and consumers. The flowchart provides the staged guidance on how to manage each aspect of warehousing and describes such aspects as receiving of supplies; control of quality; shipment and storage and corresponding document flow. Warehouse flowchart, being actual is a good source of information. It indicates the stepwise way to complete the warehouse and inventory management process flow. Also it can be very useful for an inventory and audit procedures.
Picture: Flow Chart Example: Warehouse Flowchart
Related Solution:
Fast creating visualization for structured data is the main capability of ConceptDraw DIAGRAM software. With numerous vector stencils from object libraries and the RapidDraw technology this software becomes the best cross-functional flowchart software.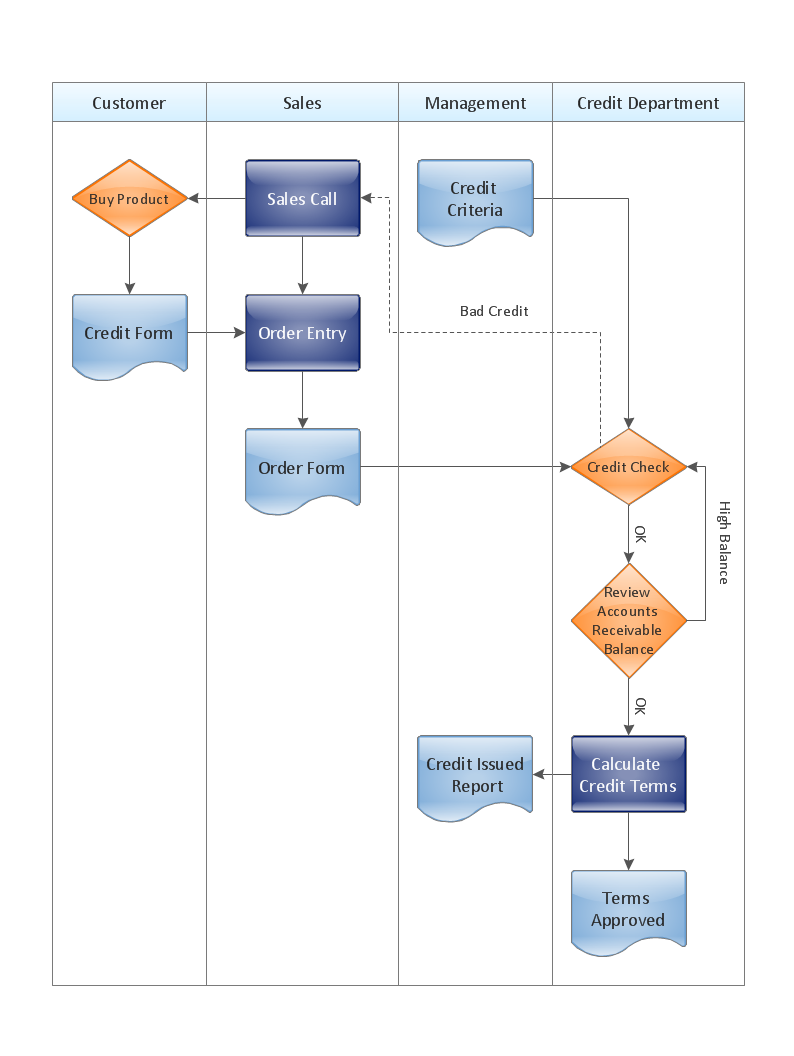
Picture: Create a Cross-Functional Flowchart
Related Solution:
Event-Driven Process Chain Diagrams is using for improvement throughout an organisation.
ConceptDraw DIAGRAM - software that reduces the time needed to create a EPC diagrams.
Picture: The Building Blocks Used in EPC Diagrams
Related Solution:
Samples, templates and libraries contain vector clip art for drawing the Aerospace Illustrations.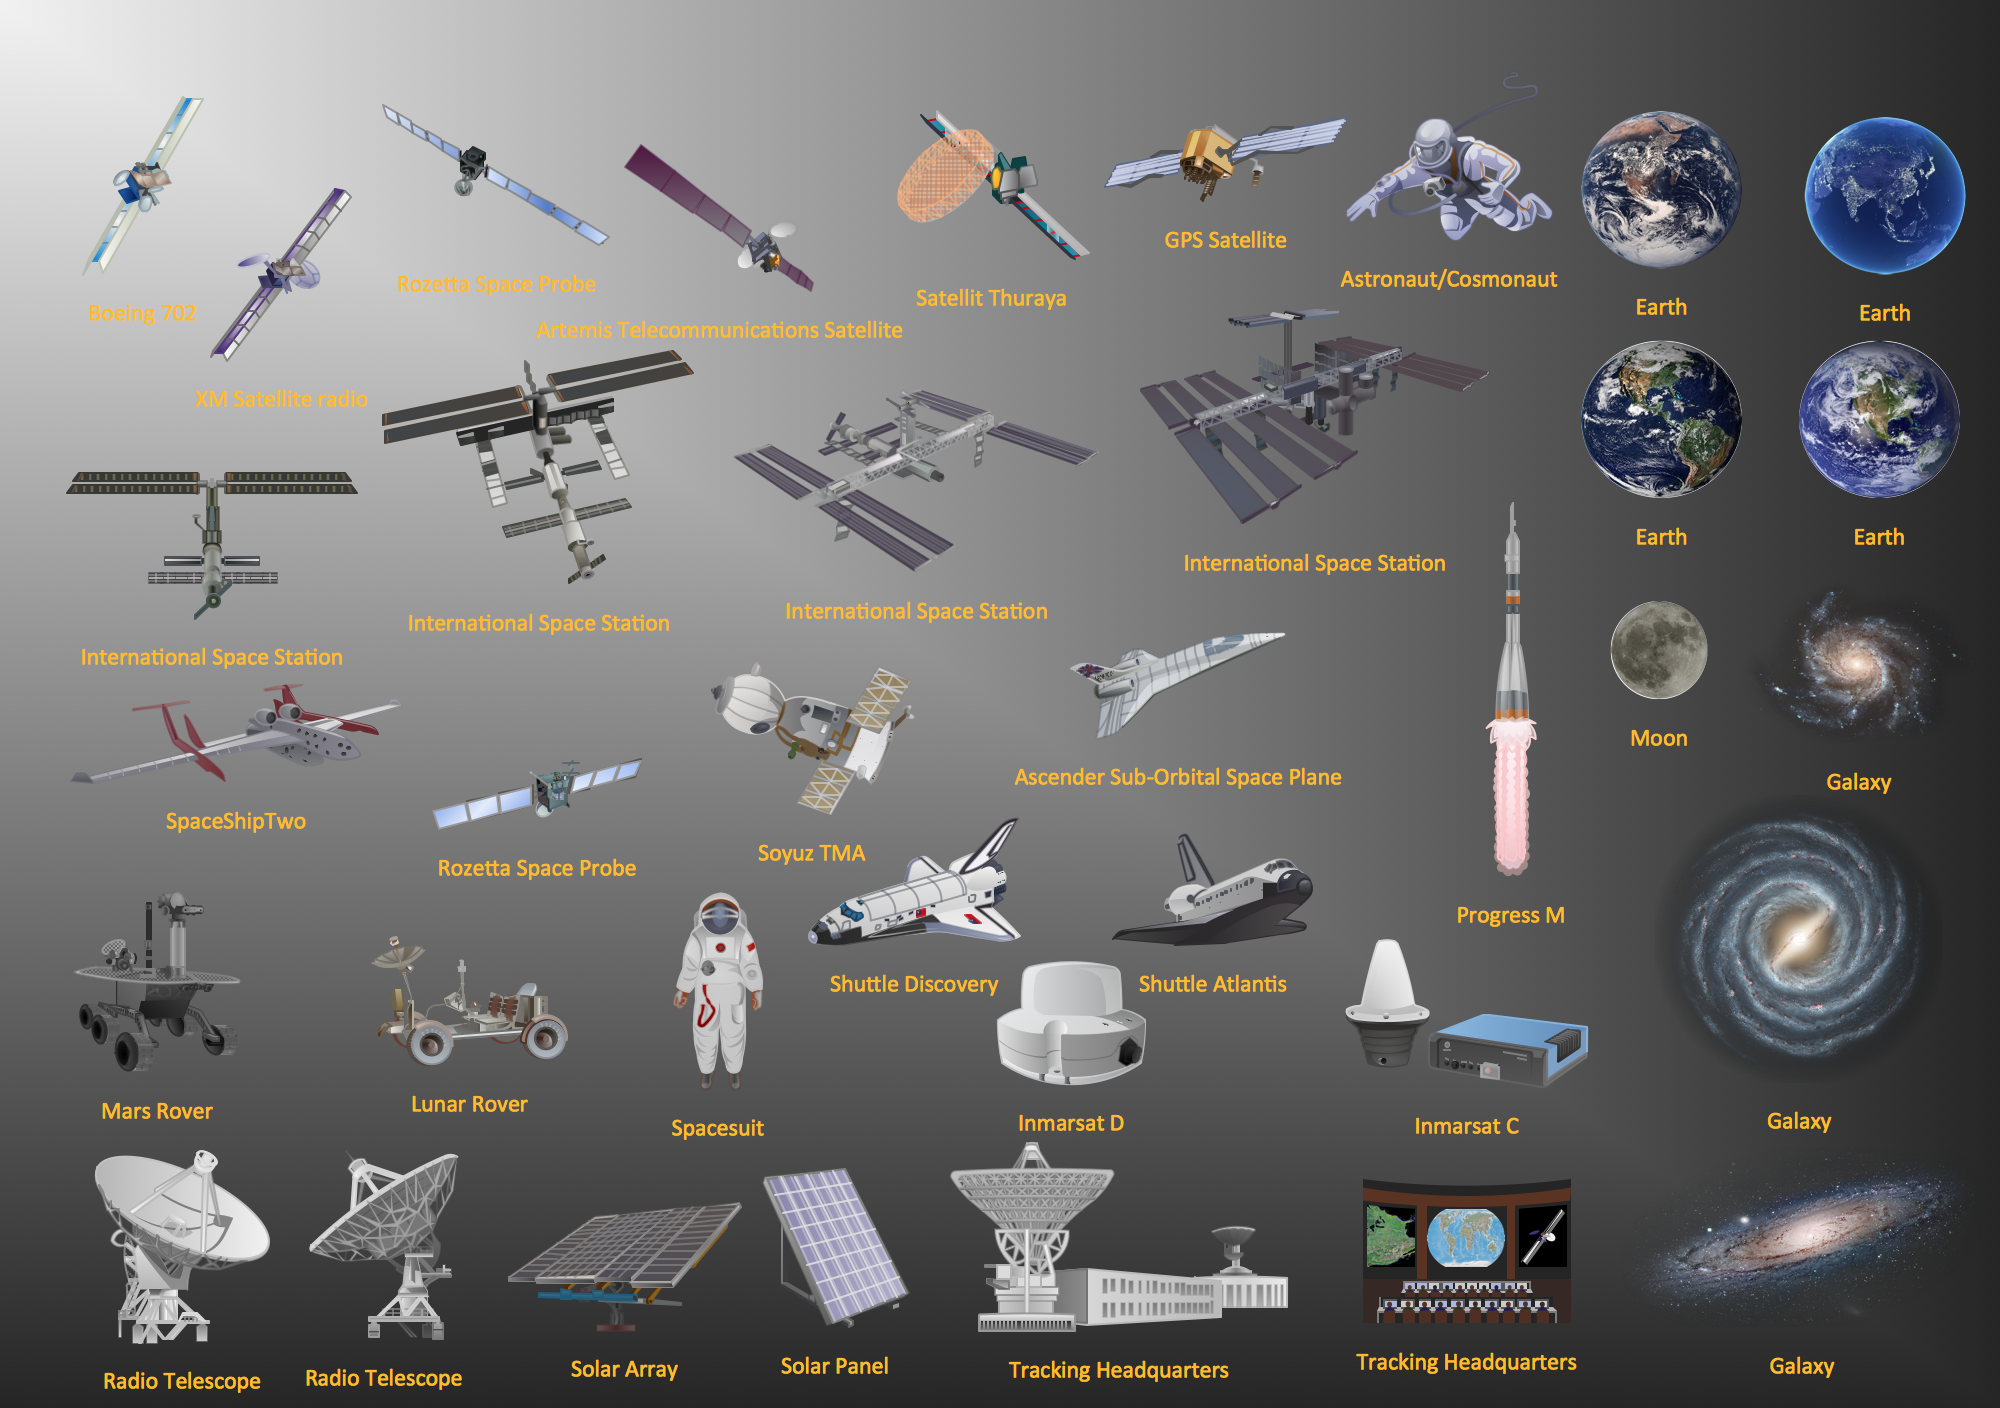
Picture: Aerospace - Design Elements
Related Solution:
A Data Flow Diagram (DFD) is a graphical technique which allows effectively model and analyze the information processes and systems. The ability to fast and easy create the DFDs is made possible with Data Flow Diagrams solution from the Software Development area of ConceptDraw Solution Park. For designing the Data Flow Diagrams are used simple DFD flowchart symbols which are connected each other by arrows depicting the data flow from one step to another.
Picture: DFD Flowchart Symbols
Related Solution:
The Total Quality Management Diagram solution helps you and your organization visualize business and industrial processes. Create Total Quality Management diagrams for business process with ConceptDraw software.
Picture: Total Quality Management Business Diagram
Related Solution:
A flowchart is a powerful tool for examining processes. It helps improving processes a lot, as it becomes much easier to communicate between involved people, to identify potential problems and to optimize workflow. There are flowcharts of different shapes, sizes and types of flowchart vary from quite basic process flowcharts to complex program flowcharts. Nevertheless, all these diagrams use the same set of special symbols like arrows to connect blocks, parallelogram to show data receiving or rectangles for showing process steps.
Basic flowcharts are used to represent a simple process algorithm. A basic flowchart notation consists of rectangles (business processes), arrows (the flow of information, documents, etc.). The same notation is used in items such as the "decision", which allow you to do the branching. To indicate the start of the entire business process and its termination can be used the "Terminator" element. The advantages of Basic Flowchart are simplicity and clarity. With it you can quickly describe the business process steps. Creating of Basic Flowchart does not require any special knowledge, as easily understand by employees with different levels of education and IQ.
Picture: Types of Flowchart: Comprehensive Overview
Related Solution:
ConceptDraw
MINDMAP 16