How to Connect Social Media DFD Flowchart with Action Maps
Using the ConceptDraw Social Media Response solution improves quality of content in social media and helps build an active customer community. It allows companies to be more effective in timely messaging thanks to the ability for rapid response to a customer′s post in social media. This saves budget for companies who use social media for promoting and as a lead generation tool.
The Social Media Response solution creates interactive social media flow charts and action mind maps. The solution includes a video tutorial and a number of samples helping social media teams refine and organize their response process. There are materials to help trainers and consultants develop a social media strategy and provide training for social media groups on how to effectively accomplish their daily work.
Steps to take in order to connect Action Mind Maps with a Social Media Flowchart.

Sample 1. Bank Social Media Response Flowchart
See also Samples:
-
Mind Maps
-
Idea Communication
-
Marketing — Social Media
TEN RELATED HOW TO's:ConceptDraw DIAGRAM diagramming and vector drawing software extended with Seven Basic Tools of Quality solution from the Quality area of ConceptDraw Solution Park provides effective tools for quality control and helps design any types of quality-related diagrams. Picture: Seven Basic Tools of Quality — Quality ControlRelated Solution:In ConceptDraw DIAGRAM it really is sp simple to draw even the most complex cross-functional flowcharts. Use the RapidDraw technology and Cross-Functional libraries in ConceptDraw DIAGRAM for the best results.
 Picture: How to Simplify Flow Charting — Cross-functional FlowchartRelated Solution:Example of Organizational Chart - Lots of organization chart examples created by ConceptDraw Organizational Chart Software. Include company organizational chart, hospital organizational chart, hotel Organizational chart, corporate organizational chart samples etc
 Picture: Example of Organizational ChartRelated Solution:The use case diagram (behavior scenarios, precedents) is the initial conceptual representation of the system during its design and development. This diagram consists of actors, use cases and relationships between them. When constructing a diagram, common notation elements can also be used: notes and extension mechanisms. This sample was created in ConceptDraw DIAGRAM diagramming and vector drawing software using the UML Use Case Diagram library of the Rapid UML Solution from the Software Development area of ConceptDraw Solution Park. This sample shows the types of user’s interactions with the system and is used at the registration and working with the database system.
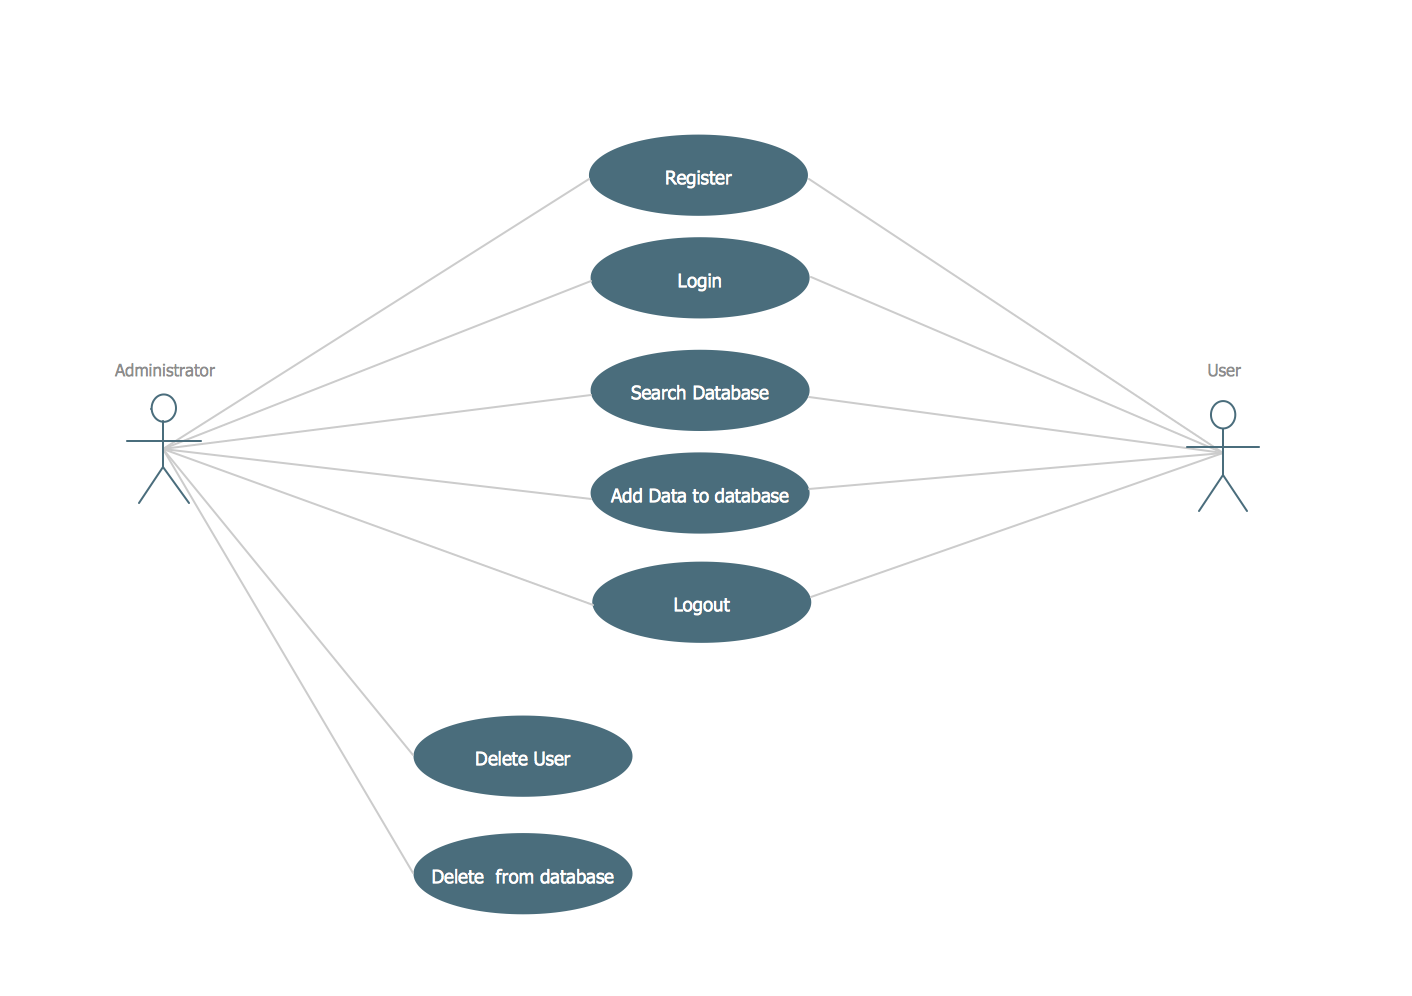 Picture: UML Use Case Diagram Example. Registration SystemRelated Solution:ConceptDraw has 142 vector stencils in the 8 libraries that helps you to start using software for designing own Business Process Diagrams. Use Swimlanes library with 20 objects from BPMN.
 Picture: Business Process Elements: SwimlanesRelated Solution:UML for Bank - This sample was created in ConceptDraw DIAGRAM diagramming and vector drawing software using the UML Class Diagram library of the Rapid UML Solution from the Software Development area of ConceptDraw Solution Park.
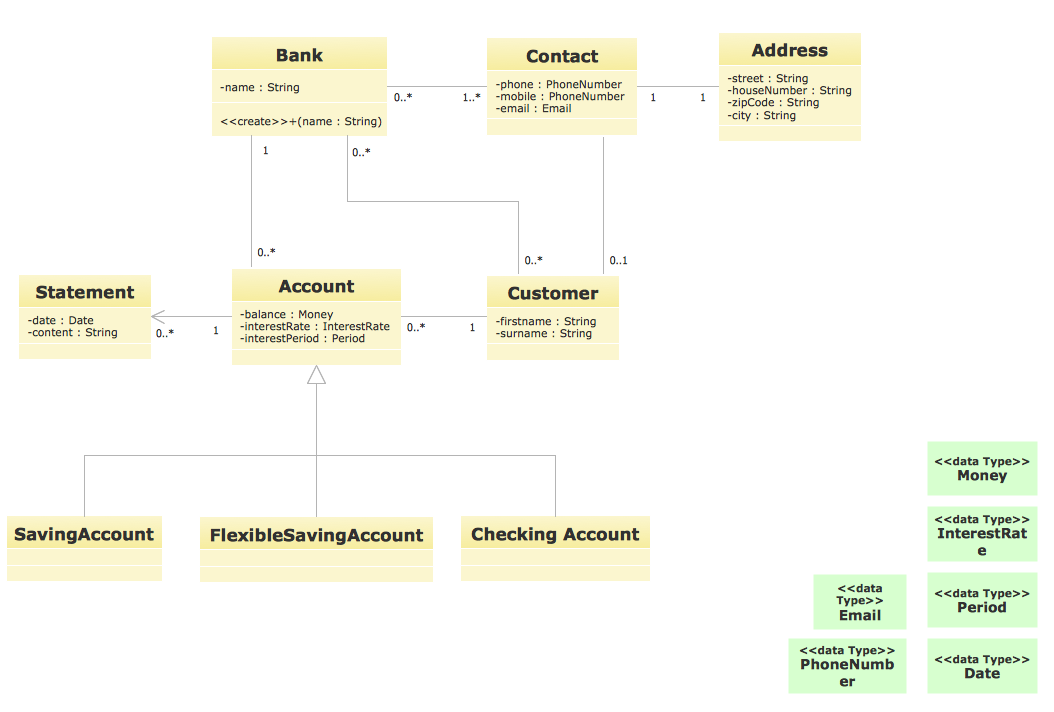 Picture: UML for BankRelated Solution:The ConceptDraw Flowchart component includes a set of samples and templates. This geathered as flowchart maker toolbox which focused on drawing flowcharts of any industry standards.
 Picture: Flowchart ComponentsRelated Solution:What is organizational charts and why your business need them? How to use business process diagram software? Explore how advanced organization chart software transforms the way companies ✔️ visualize, ✔️ communicate, and ✔️ streamline their organizational hierarchies
 Picture:What is an Organizational Chart and how it works?Organization Chart SoftwareRelated Solution:On this diagram are used the flowchart symbols that represents the processes and documents.
 Picture:Credit Card Order Process Flowchart.Flowchart ExamplesRelated Solution:Mind map specifying various online marketing objectives for a company with specific targets outlined for each objective.
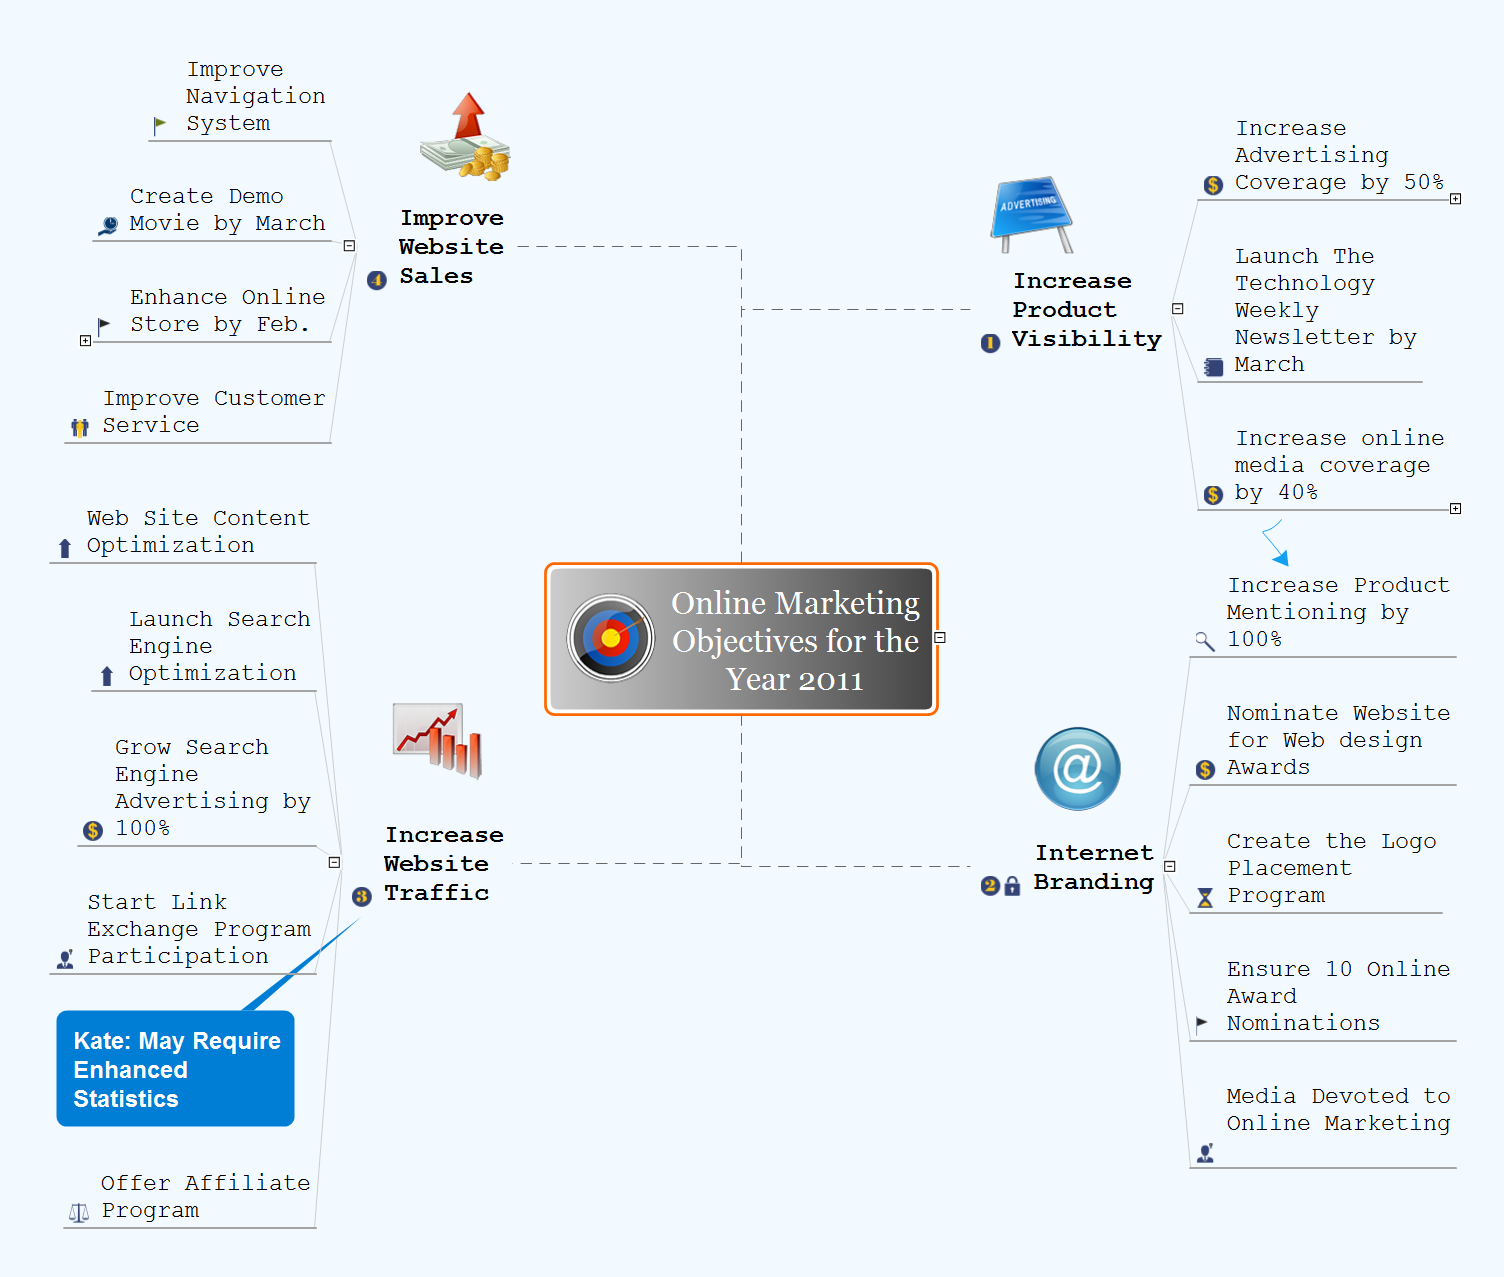 Picture: Online Marketing ObjectivesRelated Solution:ConceptDrawDIAGRAM 18