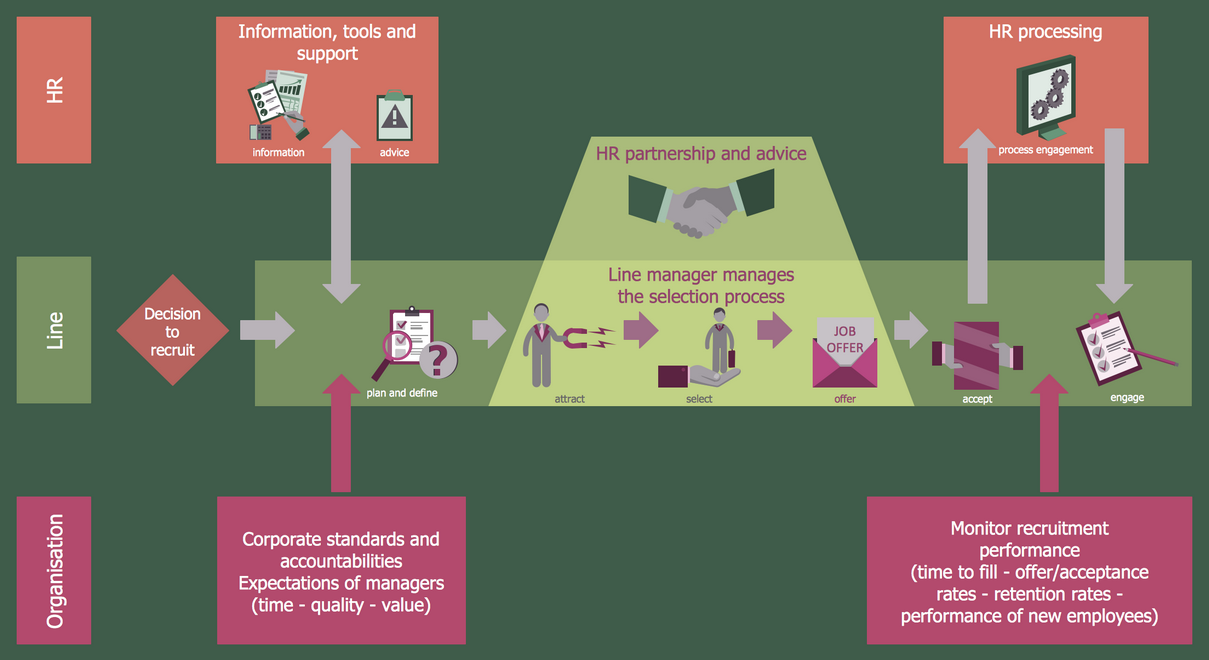
Example 1. HR Department Flow Chart — Recruitment Model
A flowchart uses boxes to represent different steps in a process and connects them with lines or arrows to show the sequence of steps. Flowcharts simplify working processes and are ideal for use in business reports, presentations, project plans, and other documents.
The specialists can draw the flowcharts by hand. However, it is recommended to use special diagramming software. ConceptDraw DIAGRAM software with HR Flowcharts solution is the best choice and offers drawing advantages for both beginners and high-qualified HR professionals. The built-in templates and samples, and predesigned vector objects are useful to create effective flow charts in minutes. The design elements — HR flowchart are gathered in a separate library. In total, HR Flowcharts solution provides 7 libraries with 387 vector objects.

Example 2. HR Flowchart Library Design Elements
Accurately visualize your processes and clearly organize your company's work in advance with the powerful and easy-to-use HR department flow chart design tool - HR Flowcharts solution. A good flow chart will help you to plan marketing campaigns and onboarding plans efficiently, easily implement them and increase your business success.
The chart can have a horizontal or vertical layout. Different shapes like rectangles, ovals, and diamonds are used to illustrate the steps of the process flow. The direction of the flow is shown by connecting arrows. The colors help to differentiate objects and highlight the most important steps and actions.

Example 3. HR Flowchart — UK Labour Market Categories
The HR Charts you see on this page were created in ConceptDraw DIAGRAM software using the extensive drawing tools of the HR Flowcharts Solution and visually show hiring process on the HR Flowchart. They successfully demonstrate the solution's capabilities and professional results you can achieve. An experienced user spent 10-15 minutes creating each of these samples.
Use the powerful tools of the HR Flowcharts Solution for ConceptDraw DIAGRAM software for effective hiring process and for quick and easy creating professional-looking HR Flowcharts. Use successfully the created diagrams in your work and personal activity.
All source documents are vector graphic documents. They are available for reviewing, modifying, or converting to a variety of formats (PDF file, MS PowerPoint, MS Visio, and many other graphic formats) from the ConceptDraw STORE. The HR Flowcharts Solution is available for all ConceptDraw DIAGRAM users.
TEN RELATED HOW TO's:
These employment forms will help you in the process of management, recruiting and hiring the employees.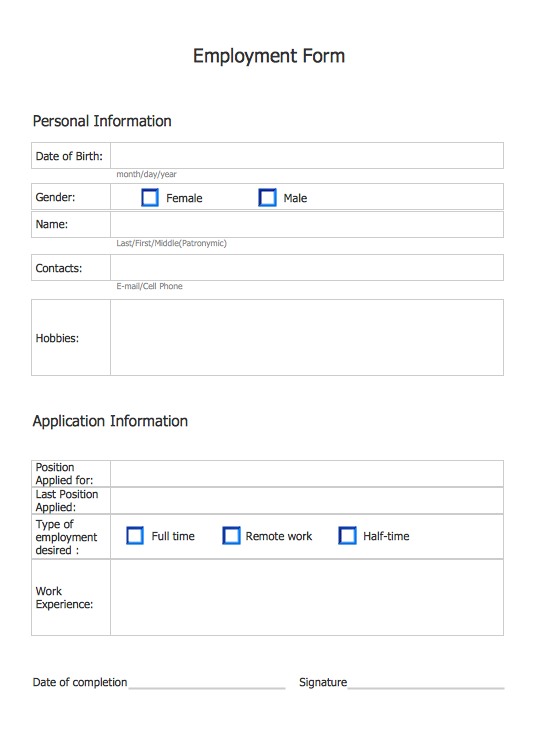
Picture: Employment Form Software
Related Solution:
Use the set of special professionally developed swim lane flowchart symbols - single, multiple, vertical and horizontal lanes from the Swimlanes and Swimlanes BPMN 1.2 libraries from the Business Process Diagram solution, the Swim Lanes library from the Business Process Mapping solution as the perfect basis for your Swim Lane Flowcharts of processes, algorithms and procedures.
Picture: Swim Lane Flowchart Symbols
Related Solution:
ConceptDraw DIAGRAM is a flowchart design software. There are large collections of professional flowchart symbols for process flow diagrams, standard flowchart symbols and colored basic flowchart symbols. Built-in examples and video lessons allow users to get started immediately and do drawing of virtually any type of flowchart or process flow diagrams
Picture: Flow Chart Creator
Related Solution:
Working with personnel might be difficult if you are not prepared enough. To explain your workers all the details of communication with customers, you can draw an order process flowchart which will describe every step of the process and answer all the questions that might appear. You can view a lot of business process mapping diagram examples here, in ConceptDraw Solution Park.
This business process flow chart is created to illustrate the sample work order process. Before an organization can make some work for a person, the customer work order request must be completed. It is needed for tracking and accountability objectives. We used this business process flowchart to show a certain tasks and actions assumed by an organization. This flowchart depicts the outside inputs that are needed to launch a process, and ways the organization delivers its outputs. This business process flowchart was created with a help of ConceptDraw Business Process Mapping solution.
Picture: Work Order Process Flowchart. Business Process Mapping Examples
Related Solution:
HR Flowcharts solution extends the drawing capabilities of ConceptDraw DIAGRAM's users and assists in designing professional-looking and informative HR department charts in minutes.
Picture: HR Department Chart
Related Solution:
Also included are standardized hr flowchart symbols, meaning your diagrams will be relevant and understood by all business associates.
Picture: HR Flowchart Symbols
Related Solution:
When trying to figure out the nature of the problems occurring within a project, there are many ways to develop such understanding. One of the most common ways to document processes for further improvement is to draw a process flowchart, which depicts the activities of the process arranged in sequential order — this is business process management. ConceptDraw DIAGRAM is business process mapping software with impressive range of productivity features for business process management and classic project management. This business process management software is helpful for many purposes from different payment processes, or manufacturing processes to chemical processes. Business process mapping flowcharts helps clarify the actual workflow of different people engaged in the same process. This samples were made with ConceptDraw DIAGRAM — business process mapping software for flowcharting and used as classic visio alternative because its briefly named "visio for mac" and for windows, this sort of software named the business process management tools.
This flowchart diagram shows a process flow of project management. The diagram that is presented here depicts the project life cycle that is basic for the most of project management methods. Breaking a project into phases allows to track it in the proper manner. Through separation on phases, the total workflow of a project is divided into some foreseeable components, thus making it easier to follow the project status. A project life cycle commonly includes: initiation, definition, design, development and implementation phases. Distinguished method to show parallel and interdependent processes, as well as project life cycle relationships. A flowchart diagram is often used as visual guide to project. For instance, it used by marketing project management software for visualizing stages of marketing activities or as project management workflow tools. Created with ConceptDraw DIAGRAM — business process mapping software which is flowcharting visio alternative or shortly its visio for mac, this sort of software platform often named the business process management tools.
Picture: Process Flowchart: A Step-by-Step Comprehensive Guide
Related Solution:
Use tools of ConceptDraw DIAGRAM software to create the Organigram HR, show how the entire company, introduce the competency-based management, and analyze whether new staff positions are necessary to be created or there are some gaps to be filled.
Picture: Organigram HR
Related Solution:
While creating flowcharts and process flow diagrams, you should use special objects to define different statements, so anyone aware of flowcharts can get your scheme right. There is a short and an extended list of basic flowchart symbols and their meaning. Basic flowchart symbols include terminator objects, rectangles for describing steps of a process, diamonds representing appearing conditions and questions and parallelograms to show incoming data.
This diagram gives a general review of the standard symbols that are used when creating flowcharts and process flow diagrams. The practice of using a set of standard flowchart symbols was admitted in order to make flowcharts and other process flow diagrams created by any person properly understandable by other people. The flowchart symbols depict different kinds of actions and phases in a process. The sequence of the actions, and the relationships between them are shown by special lines and arrows. There are a large number of flowchart symbols. Which of them can be used in the particular diagram depends on its type. For instance, some symbols used in data flow diagrams usually are not used in the process flowcharts. Business process system use exactly these flowchart symbols.
Picture: Flowchart Symbols: Meaning and Examples
Related Solution:
Use ConceptDraw DIAGRAM charting and vector drawing software with a powerful HR Flowcharts solution to document the structure of your company and HR department in a visual form fast and easily.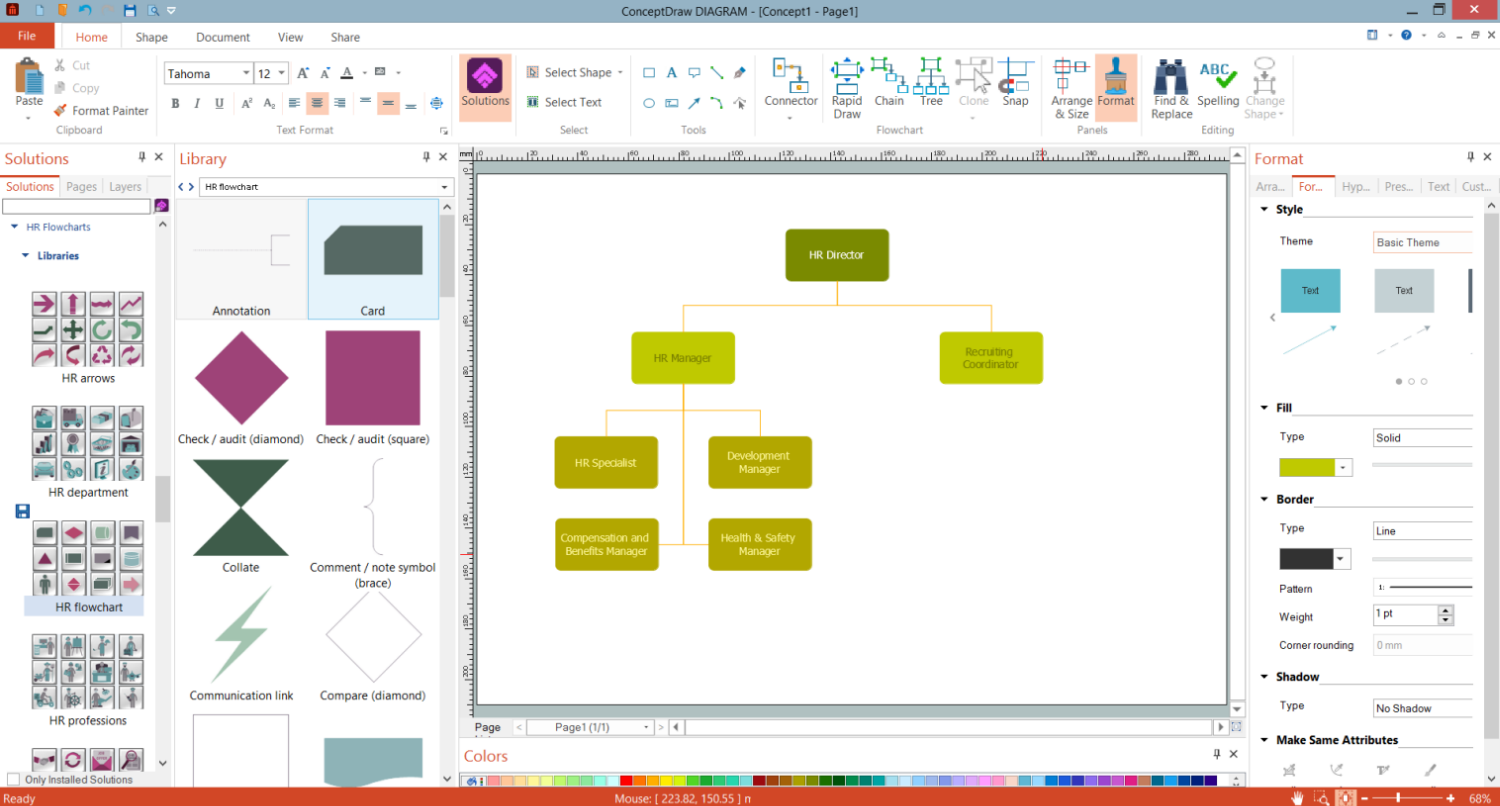
Picture: HR Structure Chart
Related Solution:

