UML Component for Bank
This sample was created in ConceptDraw DIAGRAM diagramming and vector drawing software using the UML Component Diagram library of the Rapid UML Solution from the Software Development area of ConceptDraw Solution Park.

UML Component Diagram Library

This sample represents UML Component Diagram of the ATM banking system and shows the fragmentation of the system on the structural components and dependencies between these components. This diagram can be used by the banks, clearing and financial companies.
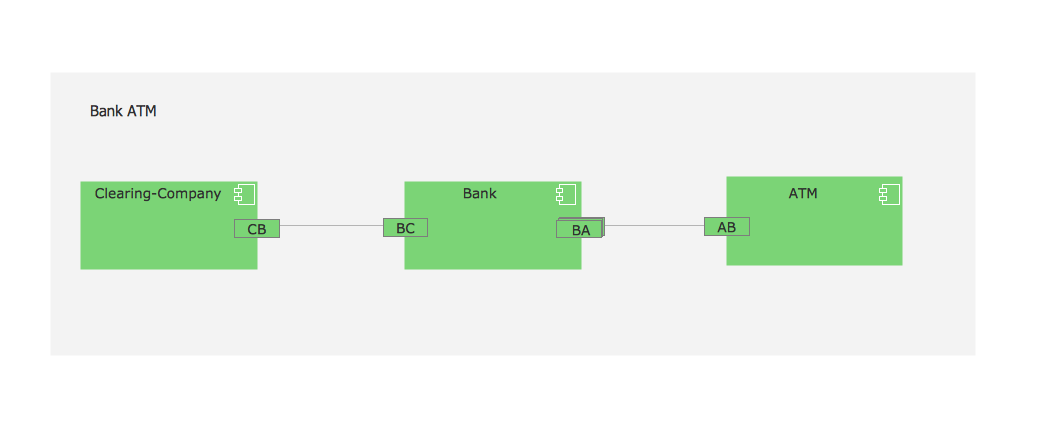
Example 1. UML Component for Bank
Using the libraries of the Rapid UML Solution for ConceptDraw DIAGRAM you can create your own visual vector UML diagrams quick and easy.


UML Resource:
- UML Software
- How to create a UML Diagram
- UML Diagram Examples
- Class Diagram
- Use Case Diagram
- Timing Diagram
- Interaction Overview Diagram
- Communication Diagram
- State Machine Diagram
- Activity Diagram
- Deployment Diagram
- Package Diagram
- Collaboration Diagram
- Object Diagram
- Sequence Diagram
- Composite Structure
- Component Diagram
TEN RELATED HOW TO's:
UML Component Diagram Online Shopping. This sample was created in ConceptDraw DIAGRAM diagramming and vector drawing software using the UML Component Diagram library of the Rapid UML Solution from the Software Development area of ConceptDraw Solution Park.
This sample shows the concept of the online shopping and is used for the understanding of the online shopping processes, of the online shops working processes, for projection and creating of the online stores.
Picture: UML Component Diagram Example - Online Shopping
Related Solution:
The UML Diagrams are widely used by developers and software engineers for professionally design and development any bank system or Automated Teller Machine (ATM) system. You need a powerful software for their design? ConceptDraw DIAGRAM extended with ATM UML Diagrams Solution from the Software Development Area of ConceptDraw Solution Park suits the best for this goal.
Picture: Bank System
Related Solution:
This sample was created in ConceptDraw DIAGRAM diagramming and vector drawing software using the UML Deployment Diagram library of the Rapid UML Solution from the Software Development area of ConceptDraw Solution Park.
This sample shows the work of the ATM (Automated Teller Machine) banking system that is used for service and performing of the banking transactions using ATMs. System engineers can use comprehensive UML diagrams solution.
Picture: UML Deployment Diagram Example - ATM SystemUML diagrams
Related Solution:
You can use many tools to create a representation of a system behavior or a scheme of objects relationships. Some of them are quite abstract and useless, and some, like UML tools help clarifying both the structure and the behavior of a system. There are various types of uml diagrams and tons of examples explaining the difference between them.
UML 2.2 specification has many kinds of diagrams. They are divided into two groups( structure and behavior diagrams). This class diagram shows the hierarchical structure of UML 2.2 specification. Class diagram - the most suitable tool for this task because it is designed to describe basic structure of a system. This diagram can be use as a visual aid for learning UML.
Picture: UML Tool & UML Diagram Examples
Related Solution:
This sample represents the actors, use cases and dependencies between them, and also the relationships between use cases. There are used dependency and use case generalization associations on this UML diagram. Use case generalization is used when you have two similar use cases, but one of them does more than another.
This sample shows the work of the Financial Trade sphere and can be used by trading companies, commercial organizations, traders, different exchanges.
Picture: Financial Trade UML Use Case Diagram Example
While designing a conceptual data model, you should use appropriate software. For instance, ConceptDraw DIAGRAM is a user-friendly ER diagram tool that has a lot of samples and templates to facilitate your work. A clear entity-relationship diagram helps to define the relations between system’s components.
Software engineering is the section of a computer science engaged to design, realization, and support of complex software products. An ERD is a data modeling method that is widely applied in the software engineering practice. Commonly it is used for developing a structure of a a relational database. An entity relationship diagram is helpful for structuring and organizing databases that can be modeled using a relational structure. An entity relationship diagram is designed to depicts the interrelationships within the sets of entities which are accumulated in the database. Each entity represents a particular component of a data. Thus, ER diagrams depicts the logical structure of databases. ConceptDraw ER Diagrams solution provides software engineers with the professional tool for making entity-relationship diagrams.
Picture: Entity Relationship Diagram Software Engineering
Related Solution:
It is easy to recreate any informational system structure using diagrams. There are three main components of any ER diagram: entity, attribute and relationship. Basing on these three components, one can define other, less used elements, such as weak entity or relationship, derived attribute, recursive relationship etc.
This is the set of graphic elements of ERD Chen's notation. This ERD notation is used to represent an entity–relationship models. It involves the set of geometric forms: rectangles - depicting entities, ovals - representing attributes and diamonds depicting relationships assigned for first-class objects, that can have relationships and attributes of their own. Connections are displayed with arrowed lines. It is known that the Chen's ERD notation is used to show a detailed view of entities and relationships. ConceptDraw Entity-Relationship Diagram solution from the Software Development section of Solution Park provides the ability to create ERD of database structure for software development purposes using the Chen’s notation elements.
Picture: Components of ER Diagram
Related Solution:
Database design is an important part of any project, as databases become more and more complex nowadays. To make the model more representative, entity relationship diagrams are widely used in software engineering area. These diagrams show sets of entities as rectangles connected via lines labeled with their cardinalities.
This an example of the ER-diagram developed to store information regarding some online role-playing game. It includes three main elements of ER diagram: entities, relationships and attributes. The entities, attributes and relationships on this ER-diagram is depicted according to the Chen's notation. Chen's notation for Entity Relationship diagrams admits using of rectangles to depict entities, ovals for attributes and ,at least, diamonds to show relationships. ConceptDraw Entity-Relationship Diagrams solution was applied as ERD software to create this diagram.
Picture: ConceptDraw DIAGRAM ER Diagram Tool
Related Solution:
Use ConceptDraw DIAGRAM software as a powerful audit application. 🔸 Create professional Audit Workflow Diagrams and Audit Process Flowcharts to ✔️ plan and implement audit process, ✔️ enhance financial transparency, ✔️ improve financial reporting, ✔️ streamline operations, ✔️ improve business efficiency, ✔️ identify risks and issues, ✔️ prevent financial fraud, ✔️ track progress, ✔️ enhance trust
Picture: Understanding the Audit Process: A Comprehensive Guide. Audit Process Flowchart
Related Solution:
When trying to figure out the nature of the problems occurring within a project, there are many ways to develop such understanding. One of the most common ways to document processes for further improvement is to draw a process flowchart, which depicts the activities of the process arranged in sequential order — this is business process management. ConceptDraw DIAGRAM is business process mapping software with impressive range of productivity features for business process management and classic project management. This business process management software is helpful for many purposes from different payment processes, or manufacturing processes to chemical processes. Business process mapping flowcharts helps clarify the actual workflow of different people engaged in the same process. This samples were made with ConceptDraw DIAGRAM — business process mapping software for flowcharting and used as classic visio alternative because its briefly named "visio for mac" and for windows, this sort of software named the business process management tools.
This flowchart diagram shows a process flow of project management. The diagram that is presented here depicts the project life cycle that is basic for the most of project management methods. Breaking a project into phases allows to track it in the proper manner. Through separation on phases, the total workflow of a project is divided into some foreseeable components, thus making it easier to follow the project status. A project life cycle commonly includes: initiation, definition, design, development and implementation phases. Distinguished method to show parallel and interdependent processes, as well as project life cycle relationships. A flowchart diagram is often used as visual guide to project. For instance, it used by marketing project management software for visualizing stages of marketing activities or as project management workflow tools. Created with ConceptDraw DIAGRAM — business process mapping software which is flowcharting visio alternative or shortly its visio for mac, this sort of software platform often named the business process management tools.
Picture: Process Flowchart: A Step-by-Step Comprehensive Guide
Related Solution:
ConceptDraw
DIAGRAM 18