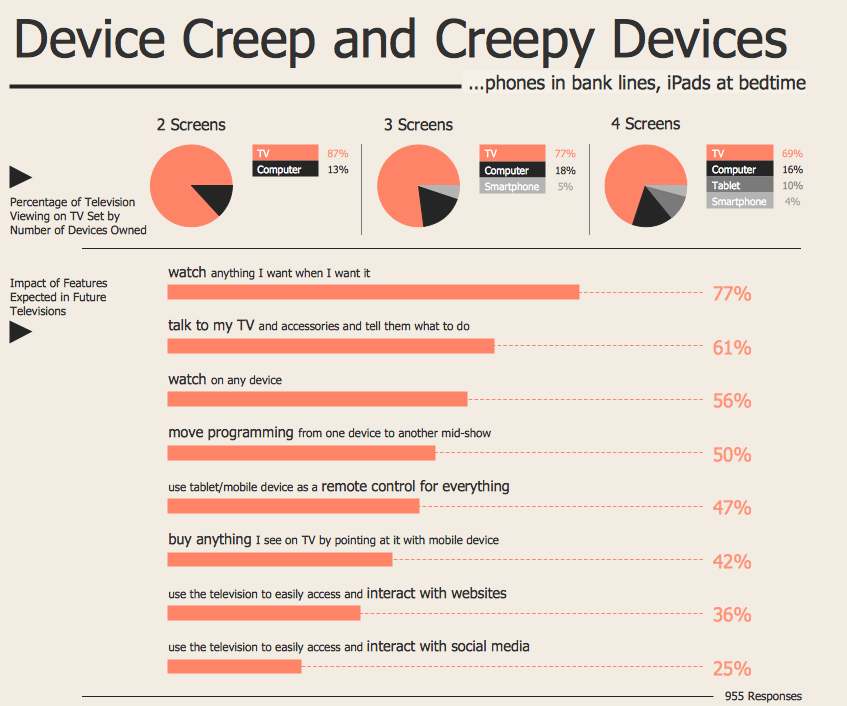
Example 1. Internet Marketing Infographic
Marketing Infographics Solution offers you the best numerous collection of predesigned templates and samples. You can choose the desired of them from ConceptDraw STORE and it will be automatically opened in ConceptDraw DIAGRAM
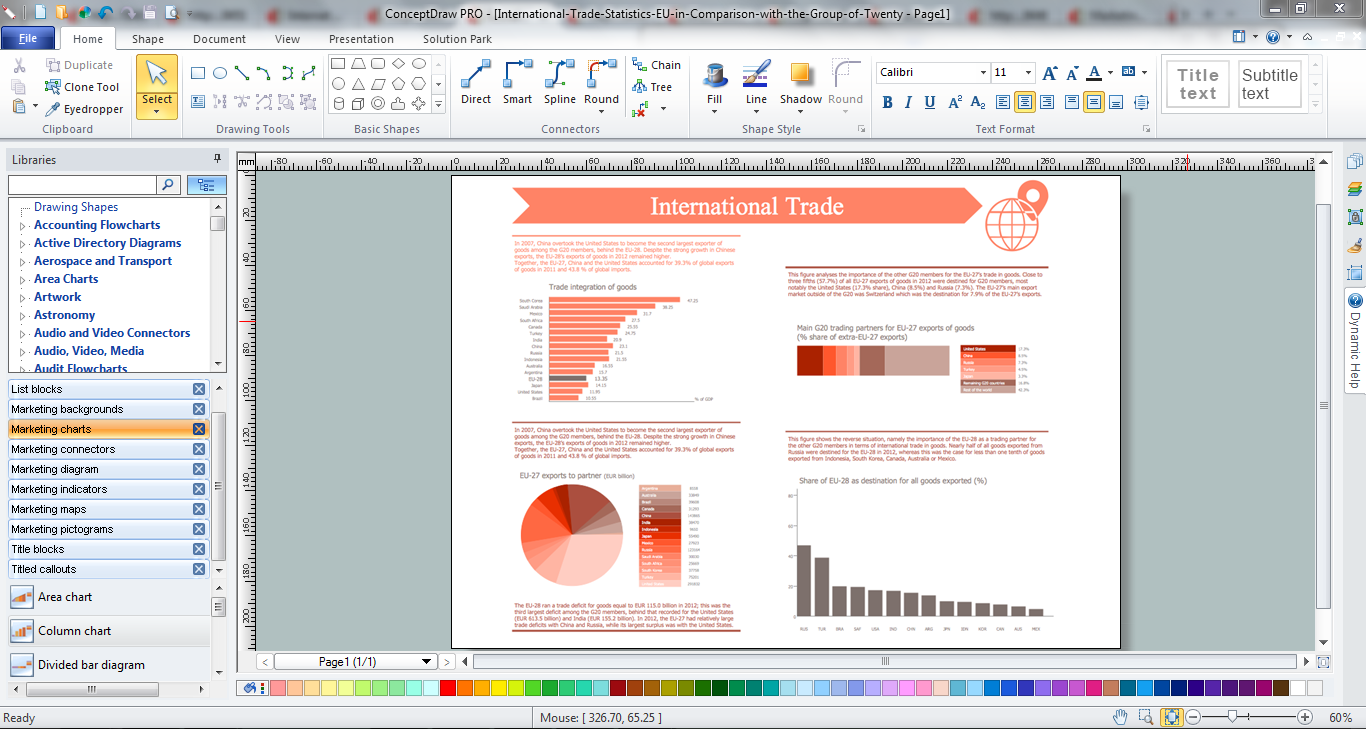
Example 2. Marketing Infographics in ConceptDraw DIAGRAM /p>
Any predesigned Internet Marketing Infographic sample can be not only viewed in ConceptDraw DIAGRAM but also edited. It's convenient to use for this the predesigned pictograms, indicators, charts, and other marketing vector objects from 11 libraries of Marketing Infographics Solution for ConceptDraw Solution Park. These objects can also help you design your own new Internet Marketing Infographic.

Example 3. Marketing Pictograms Library Design Elements
Use Marketing Infographics Solution for ConceptDraw DIAGRAM diagramming and vector drawing software to create your own professional looking Internet Marketing Infographic of any complexity quick, easy and effective, and then successfully use it in various marketing campaignes, presentations, websites publications, blog posts, etc.
All source documents are vector graphic documents. They are available for reviewing, modifying, or converting to a variety of formats (PDF file, MS PowerPoint, MS Visio, and many other graphic formats) from the ConceptDraw STORE. The Marketing Infographics Solution is available for ConceptDraw DIAGRAM users.
THREE RELATED HOW TO's:
Of course it is possible to keep network records in text documents, but it is very difficult to use them later. A more sound way to keep such documentation is to create a network diagram that might represent either logical network structure or physical. These diagrams are easy to understand and you will thank yourself later.
There is a physical network diagram. It is a tool to represent, maintain and analysis of network equipment and interconnections. Network diagram depicts the actual network information in the attractive clear graphic form. One can learn here the LAN cable length, telecommunication type and carrying capacity. The diagram depicts servers, IP address and domain name as well. Also it shows location of hubs, switches, modems, routers, and other network equipment. The sets of special symbols and images delivered with ConceptDraw Network Diagrams solution are used to show network components. Symbols have a standard view. Therefore, various specialists can read the network diagram without any discrepancies.
Picture: Network diagrams with ConceptDraw DIAGRAM
Related Solution:
The Workflow diagrams are the specialized type of flowcharts which allow to visualize any sorts of step-by-step processes. They are usually created as flowcharts, with objects that represent in a simple visual manner the steps in the process connected by arrows that indicate the next step. The ability easily create Workflow diagrams visually describing the tasks, documents associated with the tasks, people which are responsible for execution at each stage of workflow is made possible with Workflow Diagrams solution. This solution extends ConceptDraw DIAGRAM with a Workflow Diagram library that contains large collection of predesigned workflow flowchart symbols.
Picture: Workflow Flowchart Symbols
Related Solution:
Use ConceptDraw DIAGRAM diagramming and vector drawing software enhanced with Computer and networks solution to draw different types of network diagrams: physical layout and topology, LAN and WAN, Cisco, Apple, Wi-Fi wireless and Ethernet wired networks, etc.
Special libraries of highly detailed, accurate shapes and computer graphics, servers, hubs, switches, printers, mainframes, face plates, routers etc.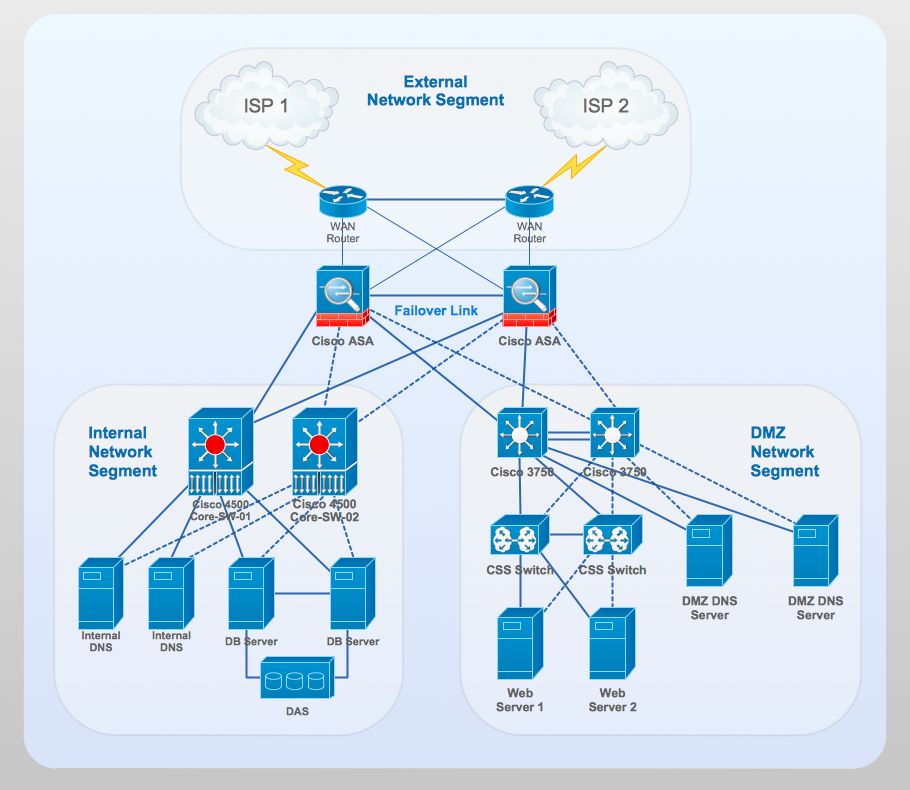
Picture: Network Gateway Router
Related Solution:

