Made with
ConceptDraw
DIAGRAM 18

Network diagrams with ConceptDraw DIAGRAM

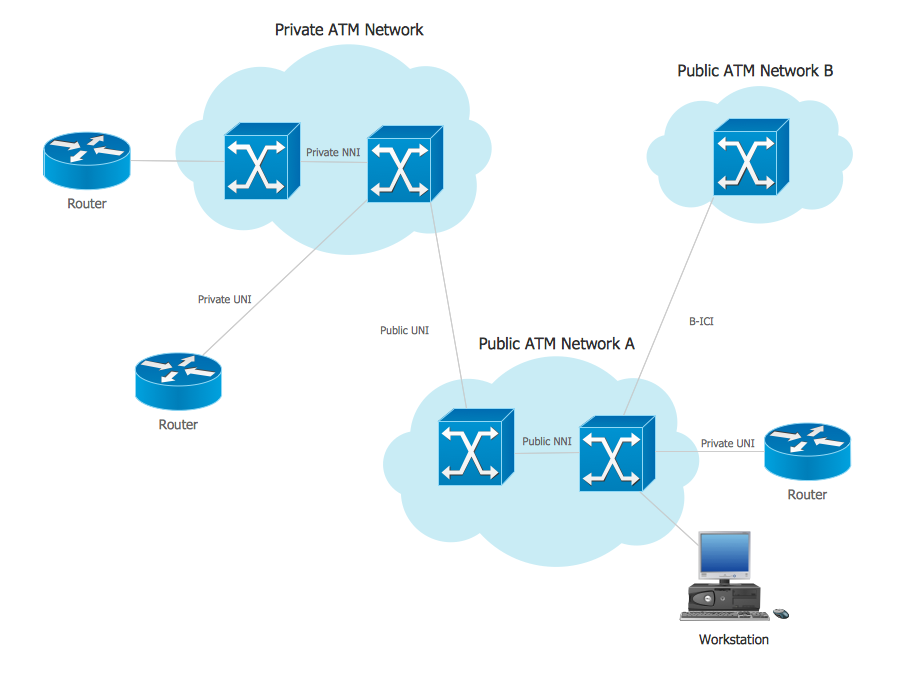
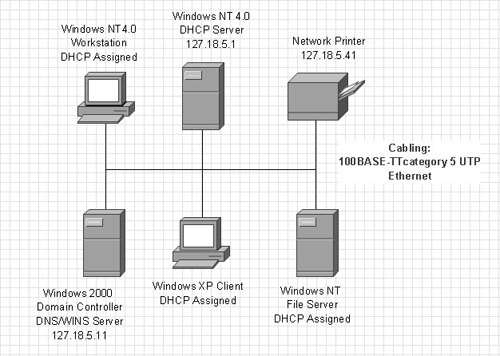
While documenting computer network it is often necessary to describe the existing network structure with the help of schemes or diagrams. It is required to document network configuration, used protocols, logical structure of the network, addresses and names of network objects. Network diagram is the tool for description, study and analysis of network knots and connections between these knots. Created network diagram can present you the existing information in comprehensible graphic view.

Network diagrams are divided into Physical Network Diagrams and Logical Network Diagrams.

As a rule at the development of diagrams ready sets of symbols and pictures for indication of network knots, connections between knots and information about diagram objects are used.

Outer objects, for instance Internet, out of network are described in the form of clouds. Depending on the diagram destination necessary level of the detailed elaboration of the diagram is selected. For instance, on the diagram there can be presented only network objects, such as computers and servers without indication of their parameters and connections type. Similar diagram presents the information about the general structure of the network and is not overloaded with excessive details. Besides, diagrams of different levels of the network contain different types of objects. On the diagram of LAN level (local area network) computers, printers, servers, etc. are displayed whereas on the diagram of WAN level (wide area network) whole buildings and even cities are displayed.

Physical Network Diagram presents to user following information:

  • Telecommunications data, such as cable length, carrying capacity or telecommunication type.
  • Servers with names, IP address (if it is static), server role and domain name.
  • Location of network equipment such as hubs, switches, modems, routers, bridges and printers.
  • Number of network users.

Pic. 1 Physical Network Diagram

Denote on the diagram all firmware versions of devices, telecommunications parameters, IP addresses assigned to devices and so on.

In contrast to Physical Network Diagram Logical Network Diagram presents the information about logical network structure, including:

  • Domain architecture
  • Used protocols
  • Servers roles
  • Trust relationship

Network diagram is an indispensable tool for network administrators and engineers at development of new networks and management of existing networks.

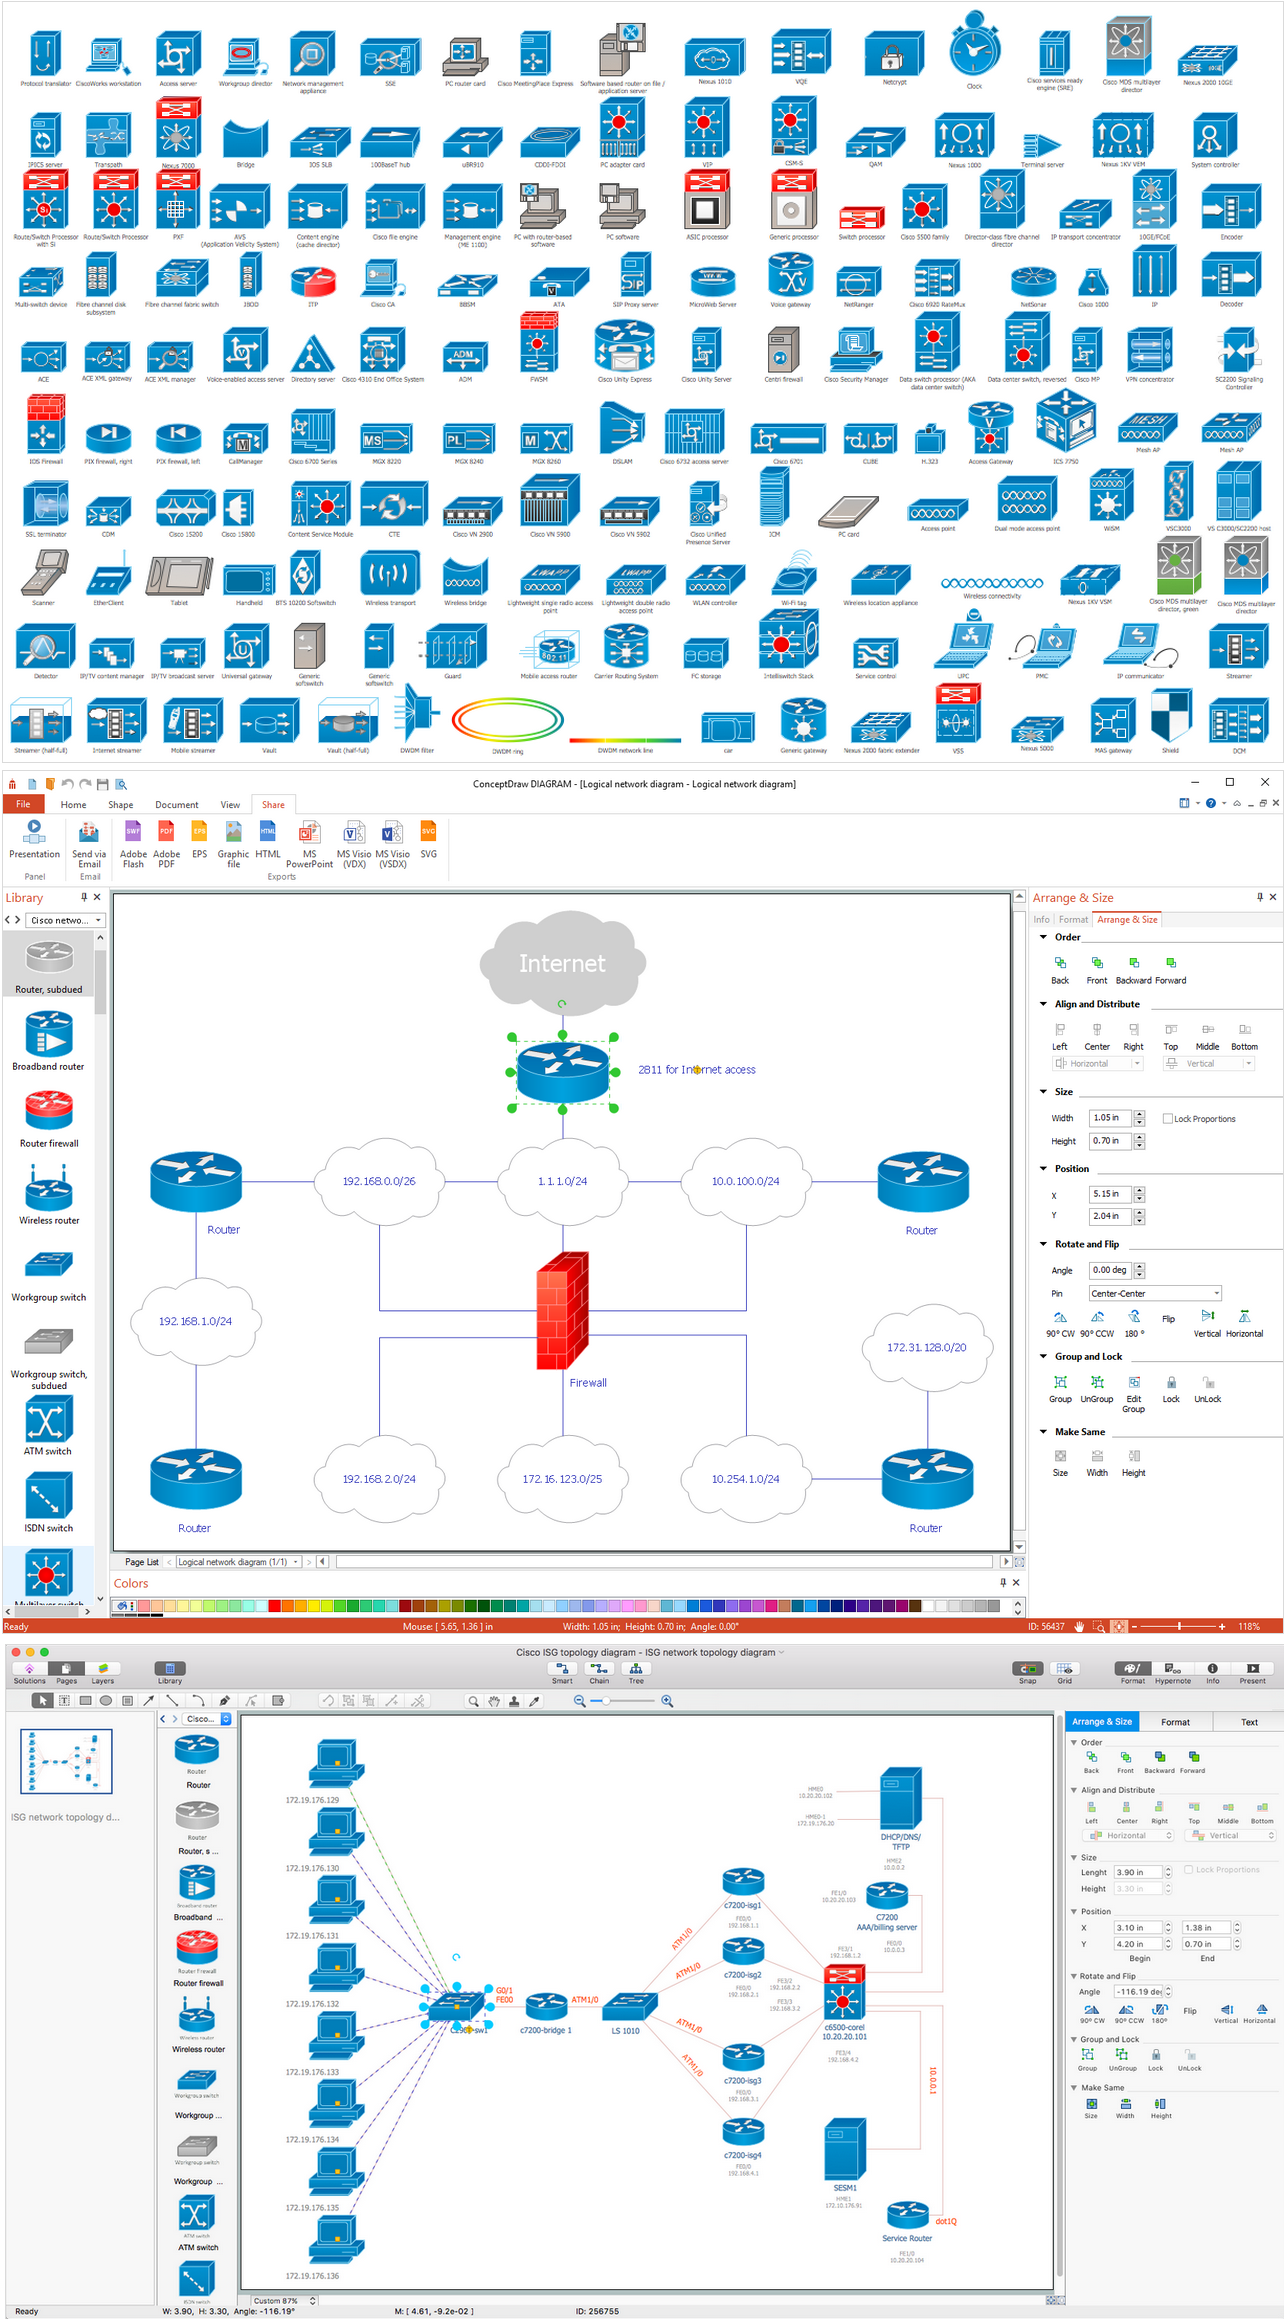
Pic. 2 Logical Network Diagram

This sample was created in ConceptDraw DIAGRAM from the Computer Network Diagrams solution.

Network diagrams with ConceptDraw DIAGRAM  *

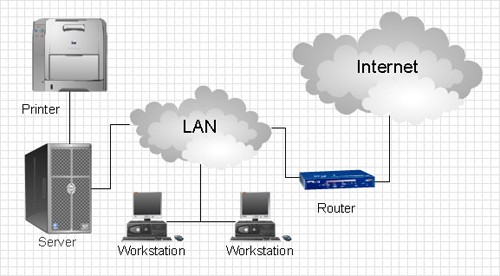
Pic. 3 Network diagram

All source documents are vector graphic documents. They are available for reviewing, modifying or converting to a variety of formats (PDF file, Power point Presentation, image or MS Visio) from the ConceptDraw Solution Park. The Computer Network Diagrams Solution is available for all ConceptDraw DIAGRAM users.


TEN RELATED HOW TO's:
Chemical and Process Engineering solution contains variety predesigned process flow diagram elements relating to instrumentation, containers, piping and distribution necessary for chemical engineering, and can be used to map out chemical processes or easy creating various Chemical and Process Flow Diagrams in ConceptDraw DIAGRAM.Process Flow Diagram Symbols
Picture: Process Flow Diagram Symbols
Related Solution:
When studying computer science, it is important to have good training manuals. To understand how the networks and data links work, you will probably need a set of network diagram examples depicting all the possible interconnections between network devices. You can find them on Internet or try to create your own. This example of a network topology diagram was made using ConceptDraw Computer and Network Diagrams solution. It represents a bus topology network diagram. A bus topology means that computers and peripherals in the network are connected to a mutual cable (backbone). This topology is often used for small networks. This diagram was designed using vector libraries of network equipment symbols. They also can be applied while creating various LAN and WAN diagrams.Network Diagram Examples *
Picture: Network Diagram Examples
Today, we can’t imagine our lives without daily data exchange. To call a set of devices that can be connected with each other a computer network, we must be sure that these devices support appropriate protocols to transfer data. A network consisting of personal devices is private, and global computer networks, for example, Internet, connects network nodes worldwide. This diagram represents a computer telecommunication network. The network depicted on the current diagram is featured with networked communication devices that provide data exchange through Internet. The network interconnections and connections between Internet nodes are settled using the cable media and wireless media. The nodes are the network workstations (terminals). and host computers. This network diagram was drawn with ConceptDraw DIAGRAM and its Computer and Networks Diagrams solution.Computer Network. <br>Computer and Network Examples *
Picture: Computer Network. Computer and Network Examples
Related Solution:
Data visualization is an important part of any software design. To understand how diagrams can improve your work, you can use examples of flowcharts that can be easily found on Internet. Flowcharts represent processes as sequences of steps written in appropriate symbols. Launching a website is a complex process. There’s a lot to accomplish, and multiple people who need to participate. This flowchart can be helpful in planning and prioritizing tasks, making the process well-organized and clear for both developers and customers. This example flowcharts was build using ConceptDraw Flowcharts solution. It is really handy and helpful for starting any website project. It includes the set of milestones, and activities that can be easily customized and applied to any individual project.Flowchart Design: Contoh Flowchart
Picture: Flowchart Design: Contoh Flowchart
Related Solution:
Special libraries of highly detailed, accurate shapes and computer graphics, servers, hubs, switches, printers, mainframes, face plates, routers etc.Network Printer *
Picture: Network Printer
The use case diagram (behavior scenarios, precedents) is the initial conceptual representation of the system during its design and development. This diagram consists of actors, use cases and relationships between them. When constructing a diagram, common notation elements can also be used: notes and extension mechanisms. This sample was created in ConceptDraw DIAGRAM diagramming and vector drawing software using the UML Use Case Diagram library of the Rapid UML Solution from the Software Development area of ConceptDraw Solution Park. This sample shows the types of user’s interactions with the system and is used at the registration and working with the database system.UML Use Case Diagram
Picture: UML Use Case Diagram Example. Registration System
Related Solution:
If you have a small budget to design a computer network, you have to be very careful. One of the most cheap technologies to implement is a bus network topology, however it has many disadvantages. For instance, if the network cable is somehow damaged, the entire network won't work. This diagram illustrates a so-called "Bus" network topology. This type of network arrangement means that each computer or other device is linked to a main link (bus). The end nodes are shown as a circle. The links to the bus are depicted as solid vertical lines. The bus is shown as a bold horizontal line. This diagram can serve as a template for creating logical or physical network diagrams. The set of vector libraries supplied with ConceptDraw Computer and Networks solution contains the symbols of all LAN and WLAN elements required for creating network diagrams of any configuration.Bus Network Topology *
Picture: Bus Network Topology
Related Solution:
Pyramid chart example is included in the Pyramid Diagrams solution from Marketing area of ConceptDraw Solution Park.Pyramid Diagram *
Picture: Pyramid Diagram
Related Solutions:
There are numerous articles about the advantages of flowcharting, creating business graphics and developing different charts. Nevertheless, these articles are almost useless without the main component - the examples of flowcharts, org charts and without a fine example, it is difficult to get all the conveniences of creating diagrams. You can find tons of templates and vivid examples on Solution Park. This illustration shows a variety of business diagrams that can be created using ConceptDraw DIAGRAM. It comprises a different fields of business activities: management, marketing, networking, software and database development along with design of infographics and business illustrations. ConceptDraw DIAGRAM provides a huge set of sample drawings including business process modeling diagrams,, network diagrams, UML diagrams, orgcharts, DFD, flowcharts, ERD, geographical maps and more.Examples of Flowcharts, Org Charts and More
Picture: Examples of Flowcharts, Org Charts and More
Related Solution:
While studying, many of the students encounter the necessity of remaking class projects, over and over. To facilitate this process you can use special electrical and telecom plan software, which helps altering projects in several clicks. Using templates will fasten your work, and you will have more free time. This sample represents an electrical and telecommunication floor plan. Electrical and telecom floor plans contain a floor plan , on which imposed the layout of electrical, and telecommunications equipment. They shows electrical and telecom details regarding the current floor of a building: lightening, fixtures, wires, outlets, circuit panels, etc. Using of standart notation of electrical and telecommunication symbols makes the plan understandable for engineers, architects, constructors, specialist in electricity and telecommunications.Electrical and Telecom Plan Software
Picture: Electrical and Telecom Plan Software
Related Solution:
ConceptDraw
DIAGRAM 18