Pyramid Diagram
Organization Triangle Diagram
At the base of the identity of an organisational is its organizational culture. A culture is comprised of the shared values, customs, traditions, rituals, behaviours and beliefs shared by a social group (national, ethnic, organizational, etc.). Cultures also share languages, or ways of speaking. From a communication perspective, cultures are made and remade through the words we use to describe our world. Culture represents a common set of values (“shared meanings”), shared by members of a population, a organization, a project/programme purpose unit or a profession (e.g., engineers versus scientists). Culture change with the times but the speed at which the culture of different institutions change varies widely. [Development Cooperation Handbook/The development aid organization/Organizational Culture. Wikibooks]
This Organization Triangle derived from Parker and Benson's model. It's for explaination of the Regatta: Adoption Method.
This triangular chart example is included in the Pyramid Diagrams solution from Marketing area of ConceptDraw Solution Park.

Example 1. Pyramid Diagram. Organization triangle diagram
This diagram was redesigned using ConceptDraw DIAGRAM diagramming and vector drawing software from Wikimedia Commons file Organization_Triangle.png.
[commons.wikimedia.org/wiki/File:Organization_Triangle.png]
This file is licensed under the Creative Commons Attribution-Share Alike 2.5 Generic license. [creativecommons.org/licenses/by-sa/2.5/deed.en]
See more Pyramid Diagram:
TEN RELATED HOW TO's:
No science can't exist without illustrations, and especially astronomy! Illustrations help to visualize knowledge, natural phenomenons which are studied by astronomy, they equally effective help in work, during the learning process and on the conferences.
Now we have professional astronomy illustration software - ConceptDraw DIAGRAM illustration and sketching software with templates, samples and libraries of a variety of astronomy symbols, including constellations, galaxies, stars, and planet vector shapes; a whole host of celestial bodies. When drawing scientific and educational astronomy illustrations, astronomy pictures and diagrams, can help you reach for the stars!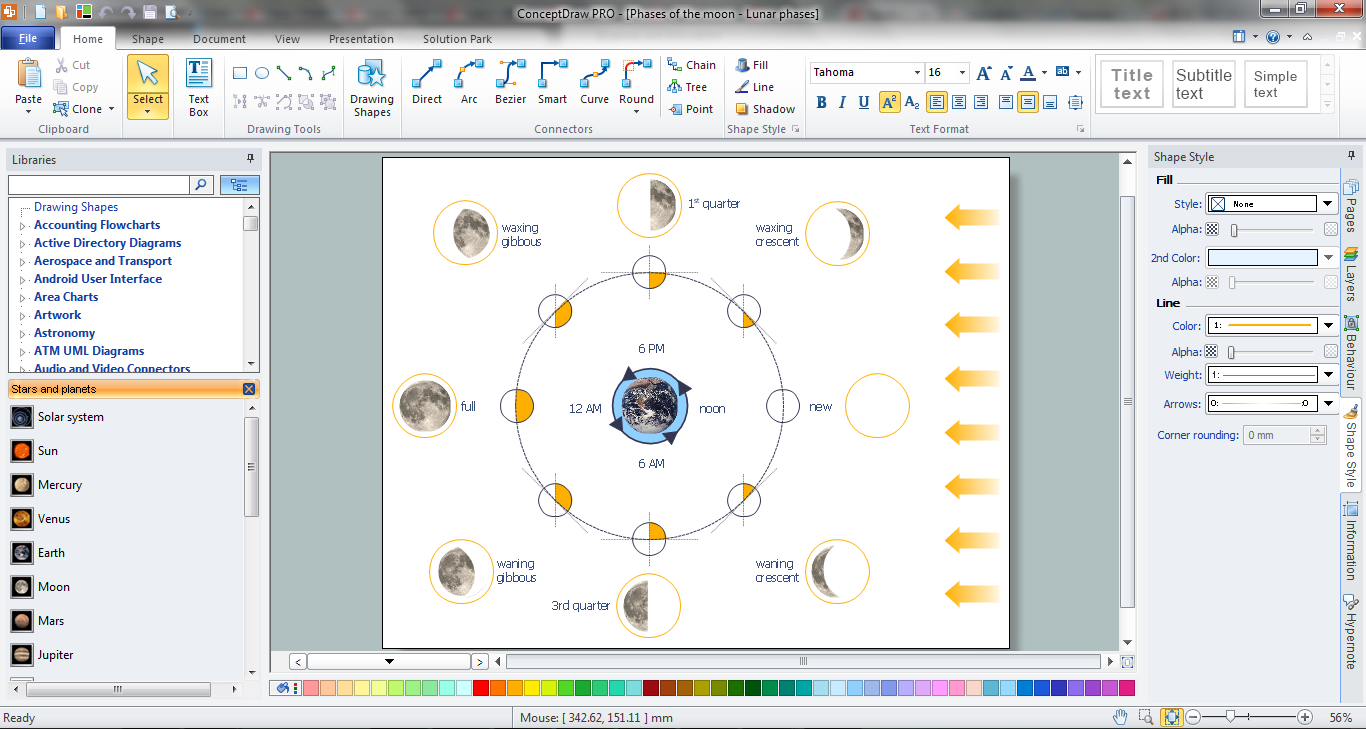
Picture: Illustration Software
Related Solution:
The Rapid UML solution from Software Development area of ConceptDraw Solution Park includes 13 vector stencils libraries for drawing the UML 2.4 diagrams using ConceptDraw DIAGRAM diagramming and vector drawing software.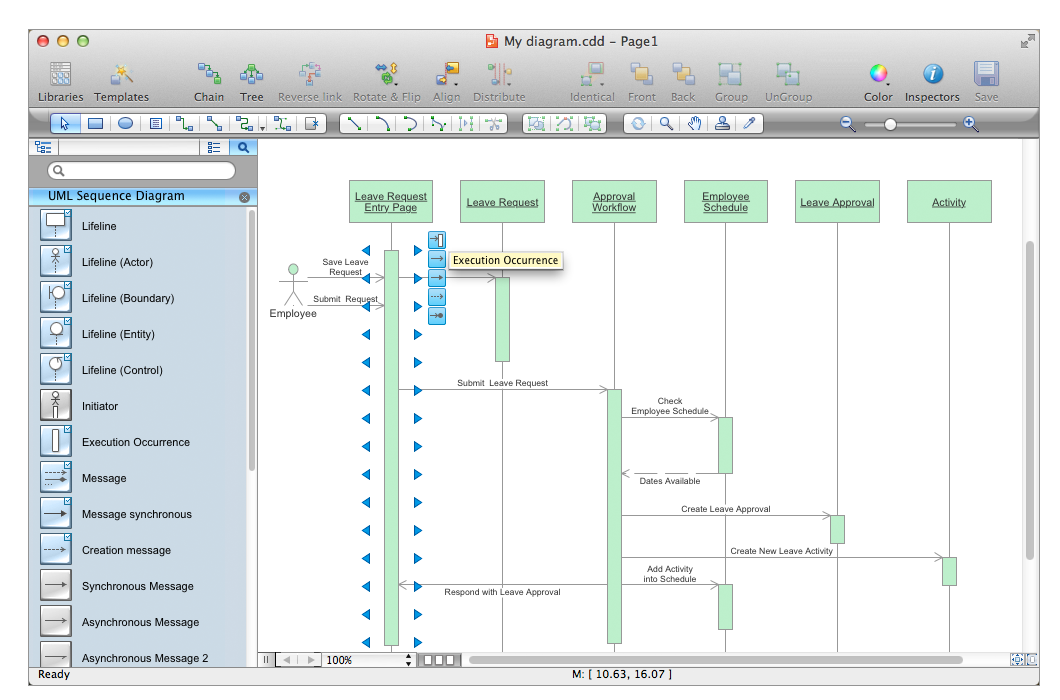
Picture: Design Elements for UML Diagrams
Related Solution:
ConceptDraw DIAGRAM creates drawings, flowcharts, block diagrams, bar charts, histograms, pie charts, divided bar diagrams, line graphs, area charts, scatter plots, circular arrows diagrams, Venn diagrams, bubble diagrams with great visual appeal on Mac OS X.
Picture: Best Diagramming Software for macOS
Related Solution:
Sometimes it's difficult to find a path in work processes or to understand the requirements, especially when you are a newcomer. To get your thoughts straight, create a workflow diagram, and put everything on it. This will not only help you to get into the workflow, but also show it’s weaknesses.
This illustration captures the workflow process of payment an invoice for the electricity consumed by certain enterprise. It was drawn in ConceptDraw DIAGRAM using its solution for Workflow Diagrams. Making a workflow charts means that you need to depict consistently all processes engaged to the workflow process. Then, you should connect them with symbols meaning study and analysis. Next, add symbols of decisions. A work flow diagram made precisely and correctly can help to clarify your work flow to any person.
Picture: Workflow Diagram
Related Solution:
ConceptDraw DIAGRAM diagramming and vector drawing software extended with Security and Access Plans Solution from the Building Plans Area of ConceptDraw Solution Park is a powerful software for fast and easy drawing professional looking Physical Security Plan.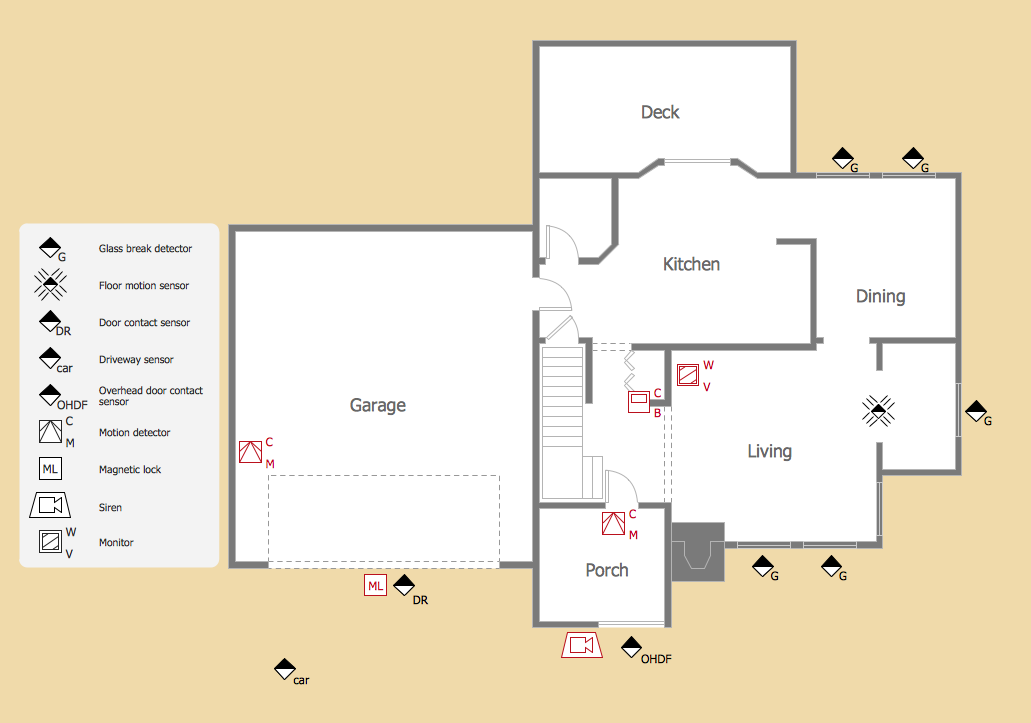
Picture: Physical Security Plan
Related Solution:
Use ConceptDraw DIAGRAM diagramming and vector graphics software to visually model your own IT construction processes.
Picture: How to Create a Process Flowchart
Related Solution:
ConceptDraw Wireless Network solution includes 81 of professional-looking stencils and several samples that you can modify and make your own diagram.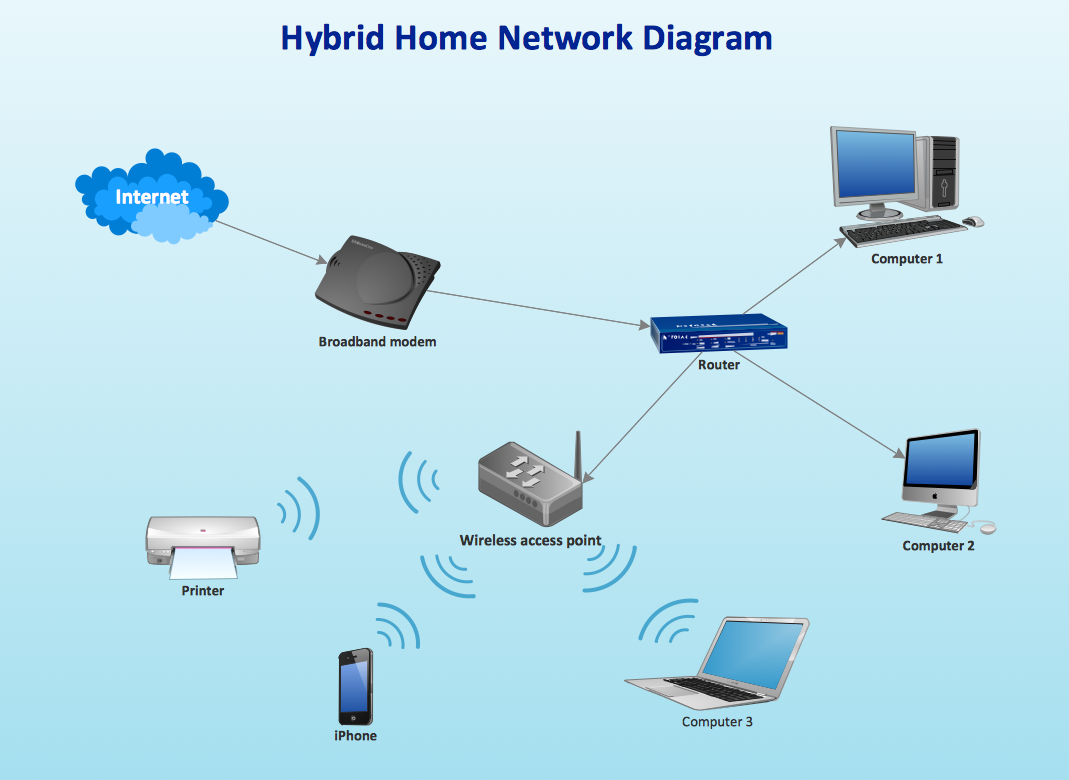
Picture: How to Create Network Diagrams
Related Solution:
How to Draw ER Diagrams? With Entity-Relationship Diagram (ERD) solution from the Software Development Area for ConceptDraw Solution Park you are able to draw ER diagram with no problem. It includes 45 predesigned icons advocated by popular Chen's and Crow’s Foot notations that can be used when describing an enterprise database.
Picture: How to Draw ER Diagrams
Related Solution:
UML Communication Diagram depicts the interactions between objects or parts in terms of sequenced messages and describes both the static structure and dynamic behavior of a system.
Picture: Diagramming Software for Design UML Communication Diagrams
Problems are obstacles and challenges that one should overcome to reach the goal. They are an inseparable part of any business, and the success of an enterprise often depends on ability to solve all problems effectively. The process of problem solving often uses rational approach, helping to find a suitable solution.
Using Fishbone Diagrams for Problem Solving is a productive and illustrative tool to identify the most important factors causing the trouble. ConceptDraw DIAGRAM extended with Fishbone Diagrams solution from the Management area of ConceptDraw Solution Park is a powerful tool for problem solving with Fishbone Ishikawa diagram graphic method.
Picture: Using Fishbone Diagrams for Problem Solving
Related Solution: