This diagram was redesigned using ConceptDraw DIAGRAM diagramming and vector drawing software from Wikimedia Commons file Time-Quality-Money.png.
[commons.wikimedia.org/wiki/File:Time-Quality-Money.png]
This file is licensed under the Creative Commons Attribution-Share Alike 3.0 Unported license. [creativecommons.org/licenses/by-sa/3.0/deed.en]
NINE RELATED HOW TO's:
When we start to speak about databases, we must always mention database structure visualization. One of the most common ways to do it is to create an entity relationship diagram, and to put appropriate symbols on it. It is important either for database projecting and for its' future maintenance.
Entity Relationship Diagram describes data elements and their relationships within a database. There are a set of special symbols that depict each element of an entity relationship diagram. Entities - represents some stable components such as supplier, employee, invoice, client, etc. Relation symbols show how the entities interact. Attributes define characteristics of the relationships. Attributes can be one-to-one or many-to-many. Physical symbols is used in the physical models. They represent items such as fields, tables, types and keys. ERD physical symbols are the building material for the database. Notation lines are used to illustrate the relationships. The most common method is Crow’s Feet notation. You can use ConceptDraw Entity-Relationship Diagram (ERD) solution to represent a database using the Entity-Relationship model.
Picture: Entity Relationship Diagram Symbols
Related Solution:
Stakeholder management is a critical component to the successful delivery of any project, programme or activity.
ConceptDraw DIAGRAM is a powerful diagramming and vector drawing software. Now, thanks to the Stakeholder Onion Diagrams Solution included to the Management Area of ConceptDraw Solution Park, ConceptDraw DIAGRAM became also unique stakeholder management system design software.
Picture: Stakeholder Management System using Onion Diagram
Related Solution:
These vector illustrations and cliparts are created for drawing the Project management Illustrations and contain plenty of project management design elements. The clipart library Project management includes 35 icons.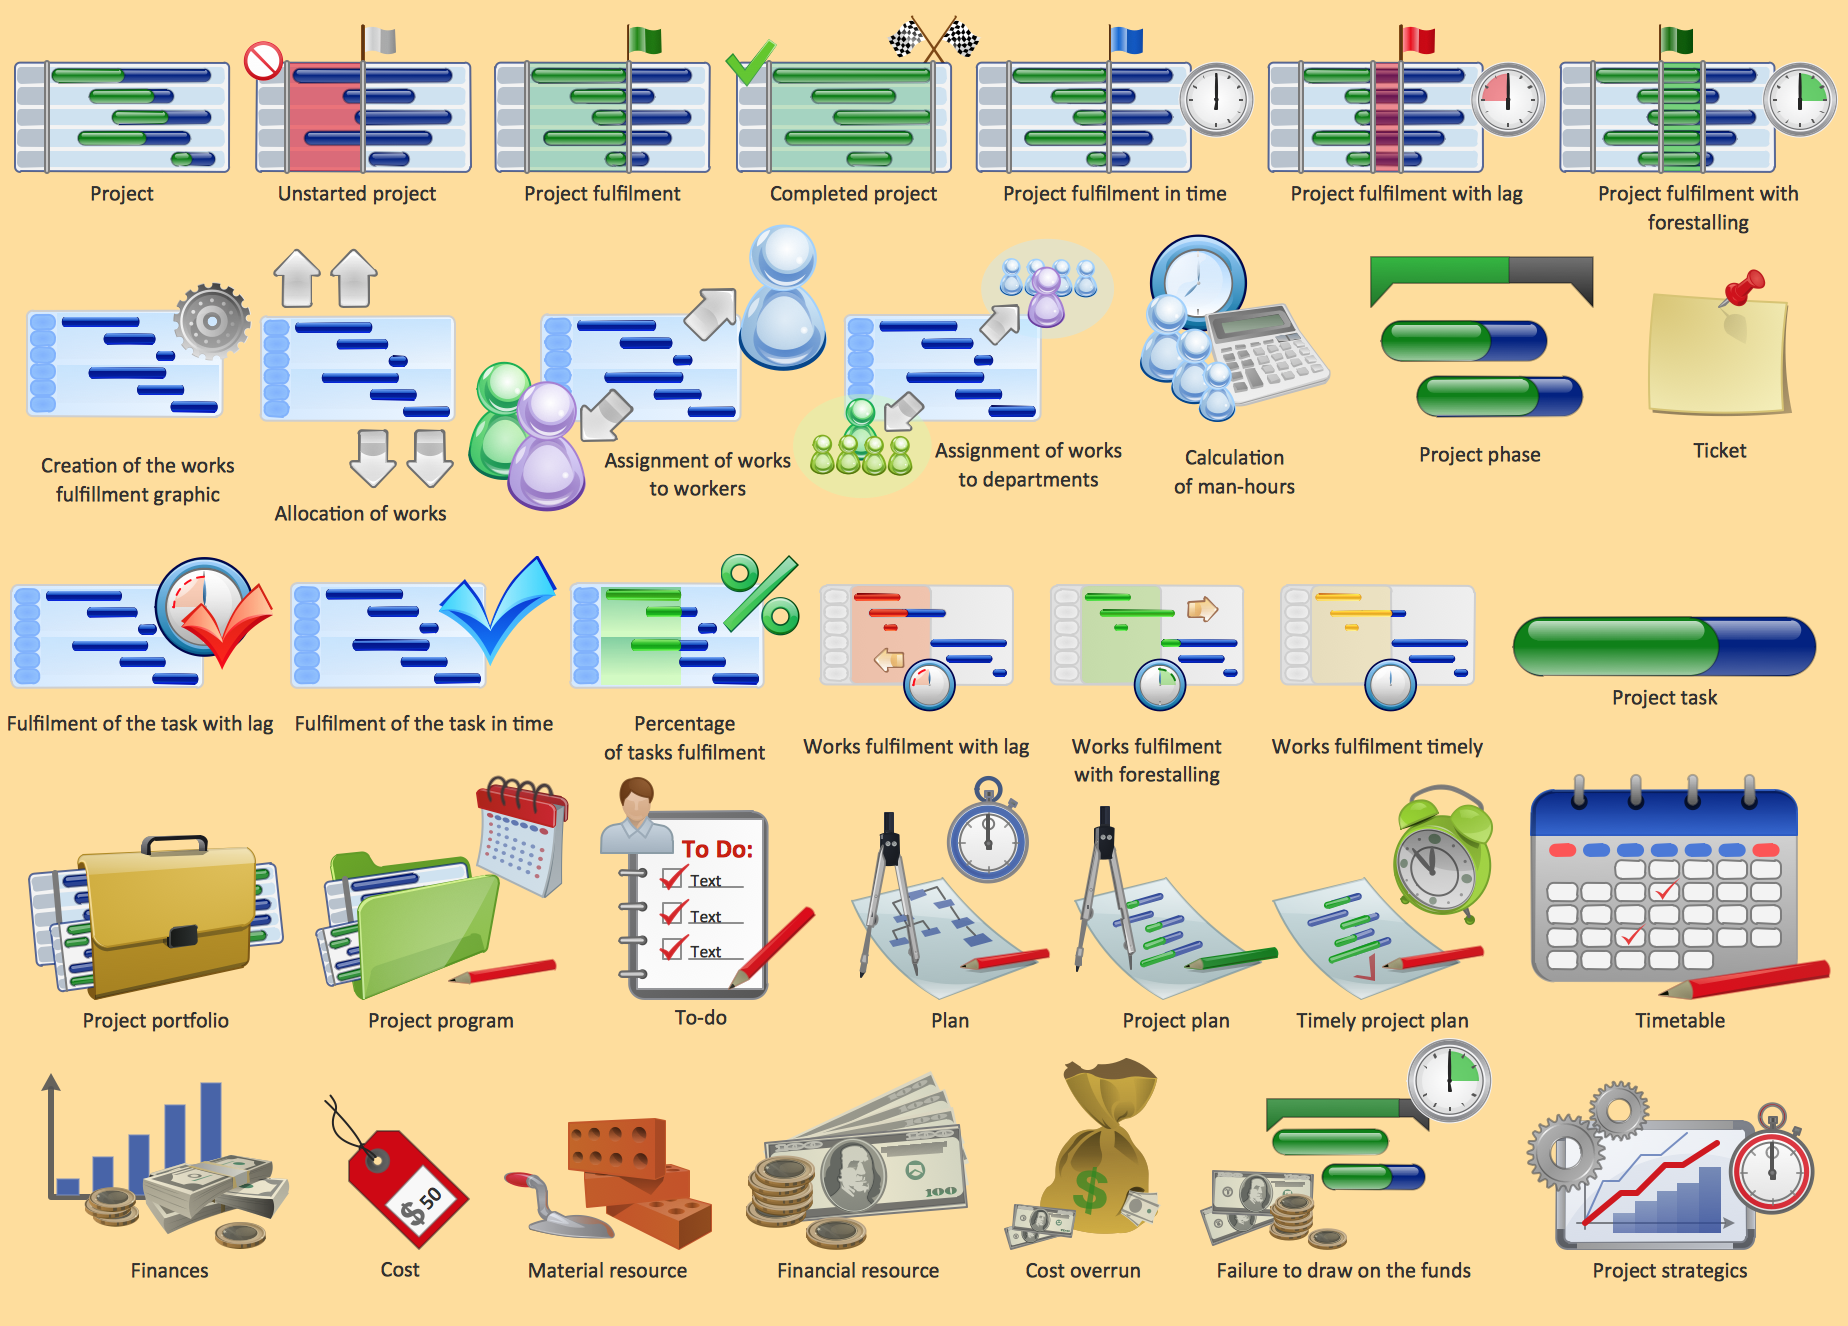
Picture: Project management - Design Elements
Related Solution:
A voltage source is a two terminal device which can maintain a fixed voltage. An ideal voltage source can maintain the fixed voltage independent of the load resistance or the output current. However, a real-world voltage source cannot supply unlimited current. A voltage source is the dual of a current source. Real-world sources of electrical energy, such as batteries, generators, and power systems, can be modeled for analysis purposes as a combination of an ideal voltage source and additional combinations of impedance elements.
26 libraries of the Electrical Engineering Solution of ConceptDraw DIAGRAM make your electrical diagramming simple, efficient, and effective. You can simply and quickly drop the ready-to-use objects from libraries into your document to create the electrical diagram.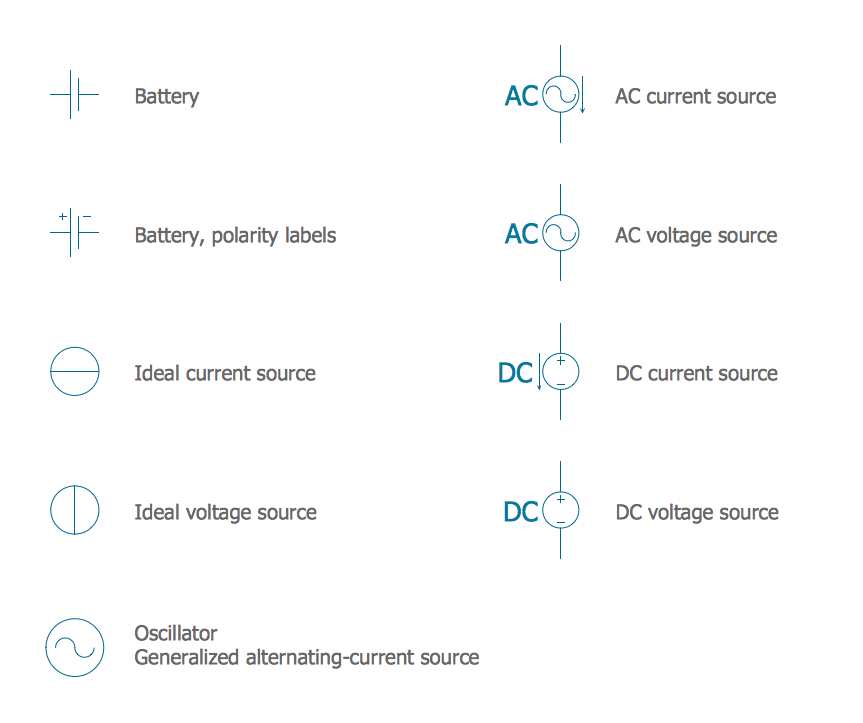
Picture: Electrical Symbols — Power Sources
Related Solution:
The vector stencils library Australia contains contours of New Zealand and Australian states and mainland territories for ConceptDraw DIAGRAM diagramming and vector drawing software.
Picture: Geo Map — Australia
Related Solution:
ConceptDraw is your tool for driving social integration and managing change across and streamline social media processes of your organisation.This tool keeps the entire team on the same page allowing you to realize your social media strategy, improve the quality of your answers, and minimize the time it takes to respond.
Picture: Social Media Response Management DFD Charts - software tools
Related Solution:
ConceptDraw RapidDraw technology is a simple point-and-click design that helps create professional, presentation-ready business process diagrams quickly and efficiently.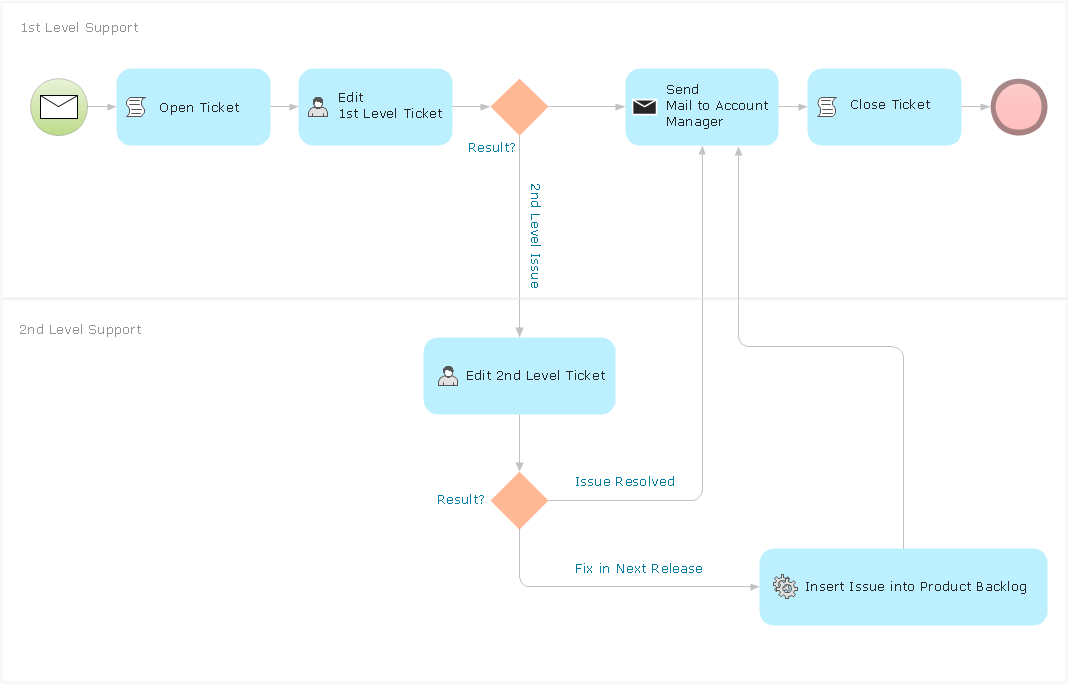
Picture: Business Process Management
A software tool that saves your time on making decisions now has the ability to make decisions with remote team via Skype.
Picture: Decision Making Software For Small Business
Related Solution:
Data flow diagrams are the graphical tool, used in the visualization of data flow of some data processing systems. It is the valuable process modeling tool. Also designing DFD is the important component of the initial part of any information system development project. The standard symbols are used to represent the interaction of a system components and how various kinds of components influence on data flow. The ConceptDraw Data Flow Diagrams solution is design to assist professional software engineers in making DFDs according to Gane and Sarson, and Yourdon and Coad notations.
Do you imagine yourself as a successful IT specialist? To your mind, they all use data flow diagram examples to learn and to get inspired. Aren’t you still with us?
Picture: Data Flow Diagram Examples
Related Solution:
