
Example 3. Workflow flowchart symbols
The ConceptDraw DIAGRAM offers for its users powerful RapidDraw technology which is ideal for generating the many repeatable tasks that can make up a workflow and allows create the process steps with a single click. For its activation, click the Rapid Draw button on the Shape toolbar.

Example 4. RapidDraw for Workflow Diagram Design
A Workflow Diagram is commonly used for documenting a workflow, for visualization the tasks to helps employees understand their roles, often it may include large quantity of convoluted processes. It is therefore very important for Workflow Diagram to be obligatory complete and accurate designed. The ConcepetDraw PRO helps to make your diagrams accurate and easy-to-understand.

Example 5. Workflow Diagram Solution (Mac OS X and Windows)
Thanks to the Workflow Diagrams solution, the ConceptDraw DIAGRAM diagramming and vector drawing software is rich in predesigned vector workflow diagram symbols for easy drawing Workflow Diagrams, and also professionally designed samples, examples and templates. Any Workflow Diagram can be then easy printed to share with colleagues, exported to various formats, including PPT, PDF, MS Visio, HTML, and many other graphic formats.
TEN RELATED HOW TO's:
While creating flowcharts and process flow diagrams, you should use special objects to define different statements, so anyone aware of flowcharts can get your scheme right. There is a short and an extended list of basic flowchart symbols and their meaning. Basic flowchart symbols include terminator objects, rectangles for describing steps of a process, diamonds representing appearing conditions and questions and parallelograms to show incoming data.
This diagram gives a general review of the standard symbols that are used when creating flowcharts and process flow diagrams. The practice of using a set of standard flowchart symbols was admitted in order to make flowcharts and other process flow diagrams created by any person properly understandable by other people. The flowchart symbols depict different kinds of actions and phases in a process. The sequence of the actions, and the relationships between them are shown by special lines and arrows. There are a large number of flowchart symbols. Which of them can be used in the particular diagram depends on its type. For instance, some symbols used in data flow diagrams usually are not used in the process flowcharts. Business process system use exactly these flowchart symbols.
Picture: Flowchart Symbols: Meaning and Examples
Related Solution:
Designing of food images, fruit art illustrations, pictures of vegetables, and many other food and cafe related images and infographics has never been easier than it is now with ConceptDraw DIAGRAM software.
ConceptDraw DIAGRAM diagramming and vector drawing software extended with Food Court solution from the Food and Beverage area of ConceptDraw Solution Park is perfect food pictures design software.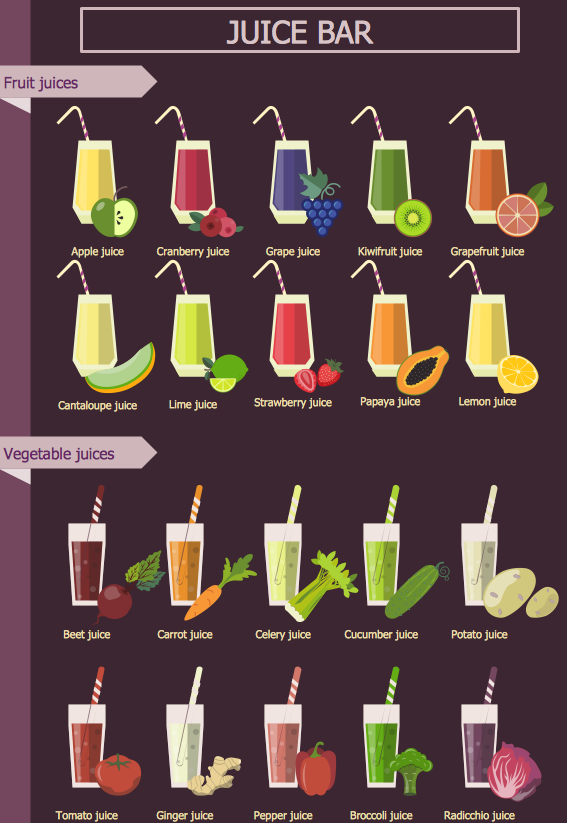
Picture: Pictures of Vegetables
Related Solution:
There are numerous articles about the advantages of flowcharting, creating business graphics and developing different charts. Nevertheless, these articles are almost useless without the main component - the examples of flowcharts, org charts and without a fine example, it is difficult to get all the conveniences of creating diagrams. You can find tons of templates and vivid examples on Solution Park.
This illustration shows a variety of business diagrams that can be created using ConceptDraw DIAGRAM. It comprises a different fields of business activities: management, marketing, networking, software and database development along with design of infographics and business illustrations. ConceptDraw DIAGRAM provides a huge set of sample drawings including business process modeling diagrams,, network diagrams, UML diagrams, orgcharts, DFD, flowcharts, ERD, geographical maps and more.
Picture: Examples of Flowcharts, Org Charts and More
Related Solution:
Desbloquee el lenguaje de los diagramas de flujo con nuestra guía de símbolos de diagramas de flujo. 🔸 Todo lo que necesita saber sobre los conceptos básicos del diagrama de flujo, desde ✔️ puntos de decisión hasta ✔️ pasos del proceso, explore el significado detrás de cada símbolo y domine el arte de crear representaciones visuales claras y efectivas de sus procesos.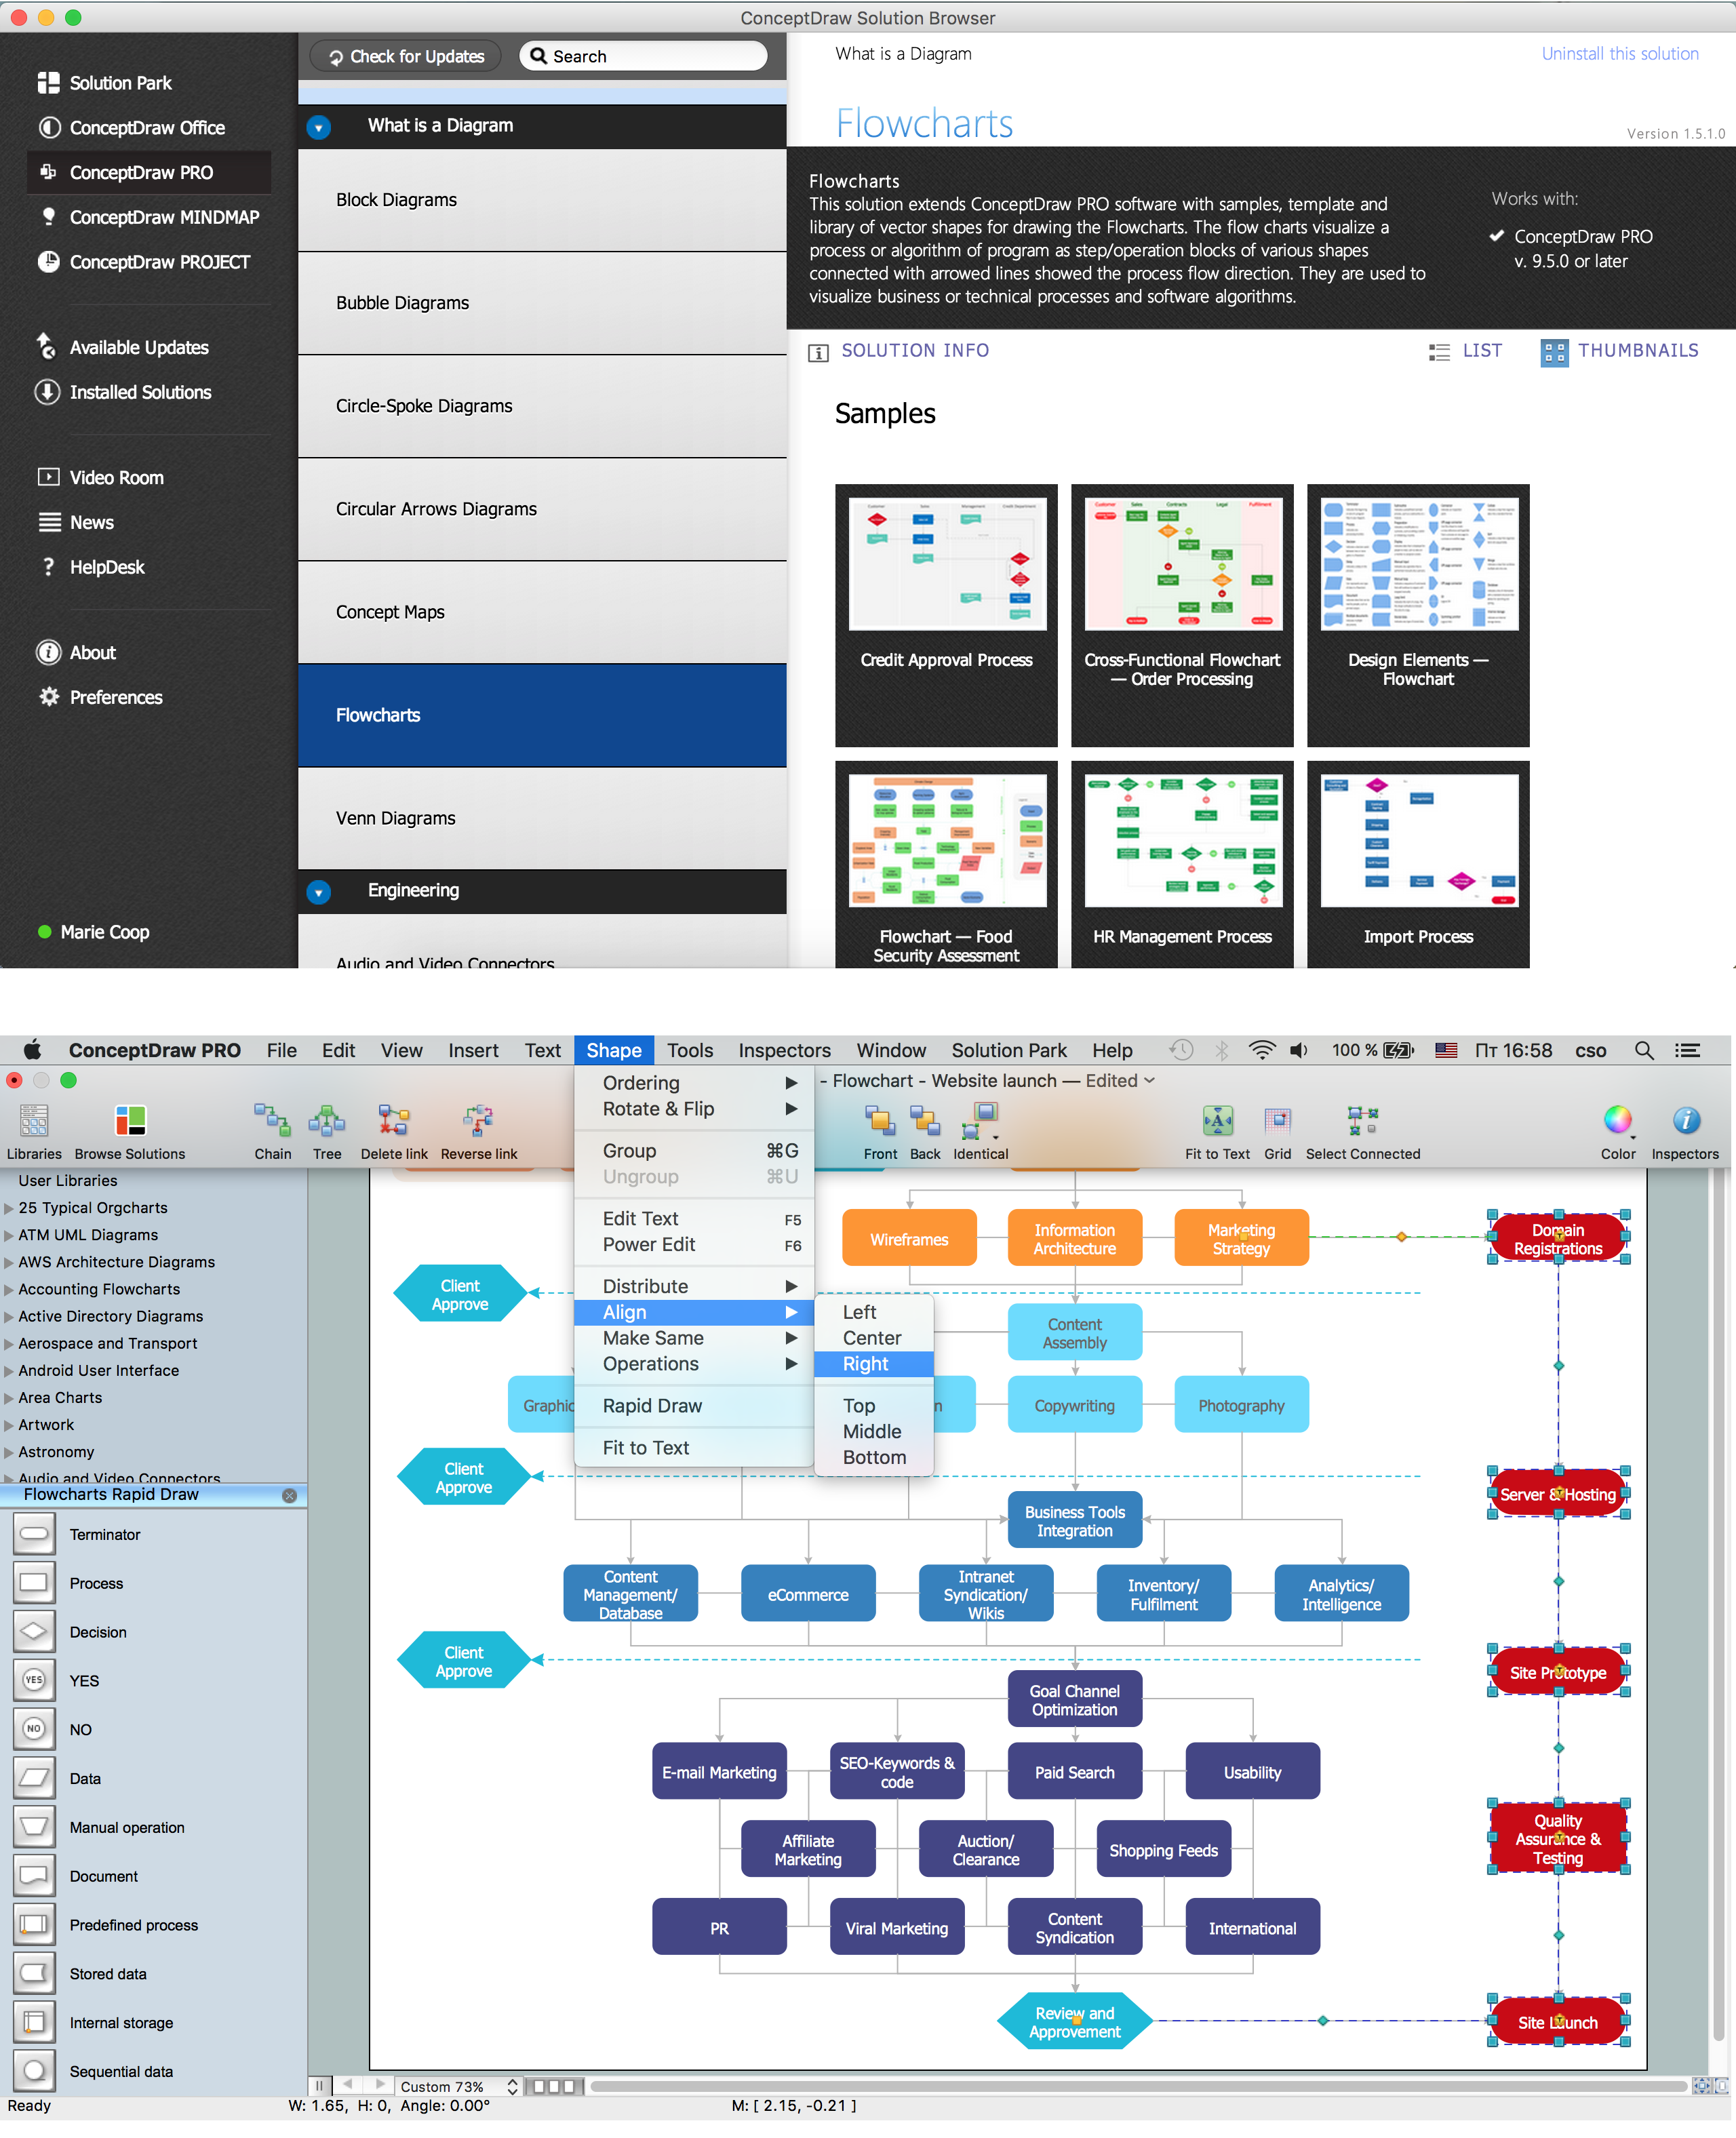
Picture: Symboles Organigramme
Related Solution:
Diagramming is an astonishing way to visualize business processes. The list of the most common business process flowchart symbols is quite long starting from basic flowcharts, continuing with SIPOC diagrams. Business process modeling was never easier than now, with special ConceptDraw Business Process Mapping solution.
To carry out all professional standard requirements for business processes mapping, it is necessarily to follow the special graphical notations. ConceptDraw Business Process Mapping solution offers an exhaustive suite of tools to aid business process mapping. There are three vector libraries SIPOC Diagrams, Business Process Flowcharts, and Swim Lanes that contains totally more than 50 symbols of standard BPM notations. This is all that professionals need to effectively evaluate and manage quality in business processes.
Picture: Business Process Flowchart Symbols
Related Solution:
ConceptDraw DIAGRAM is a professional software for building of great-looking Flowcharts ✔️ of various types and any degree of complexity, ✔️ in a few simple steps, ✔️ even if you have no experience, ✔️ using RapidDraw technology, ✔️ to perform different tasks in different fields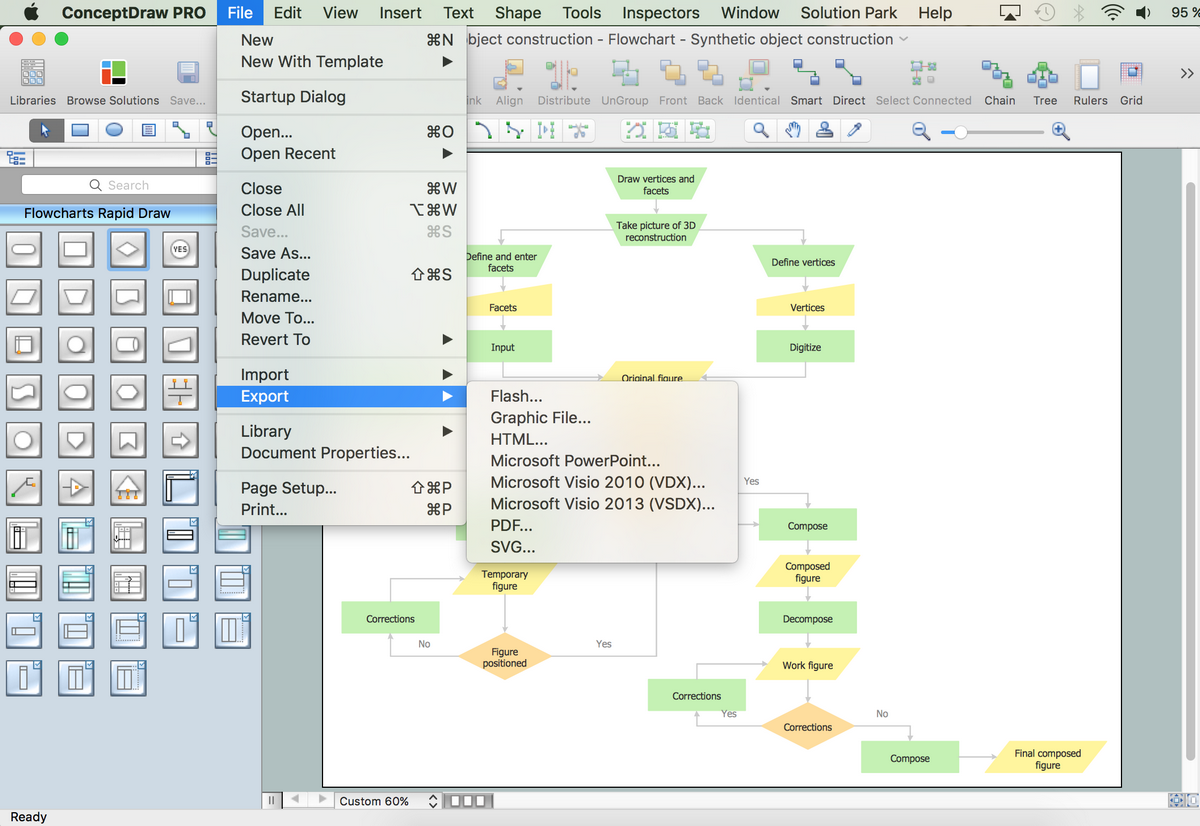
Picture: How to Build a Flowchart
Related Solution:
ConceptDraw DIAGRAM the best business process modeling tools.contains pre-designed libraries and templates based on the BPMN 2.0 standard that allows to create of both simple and complex (nested) models of processes.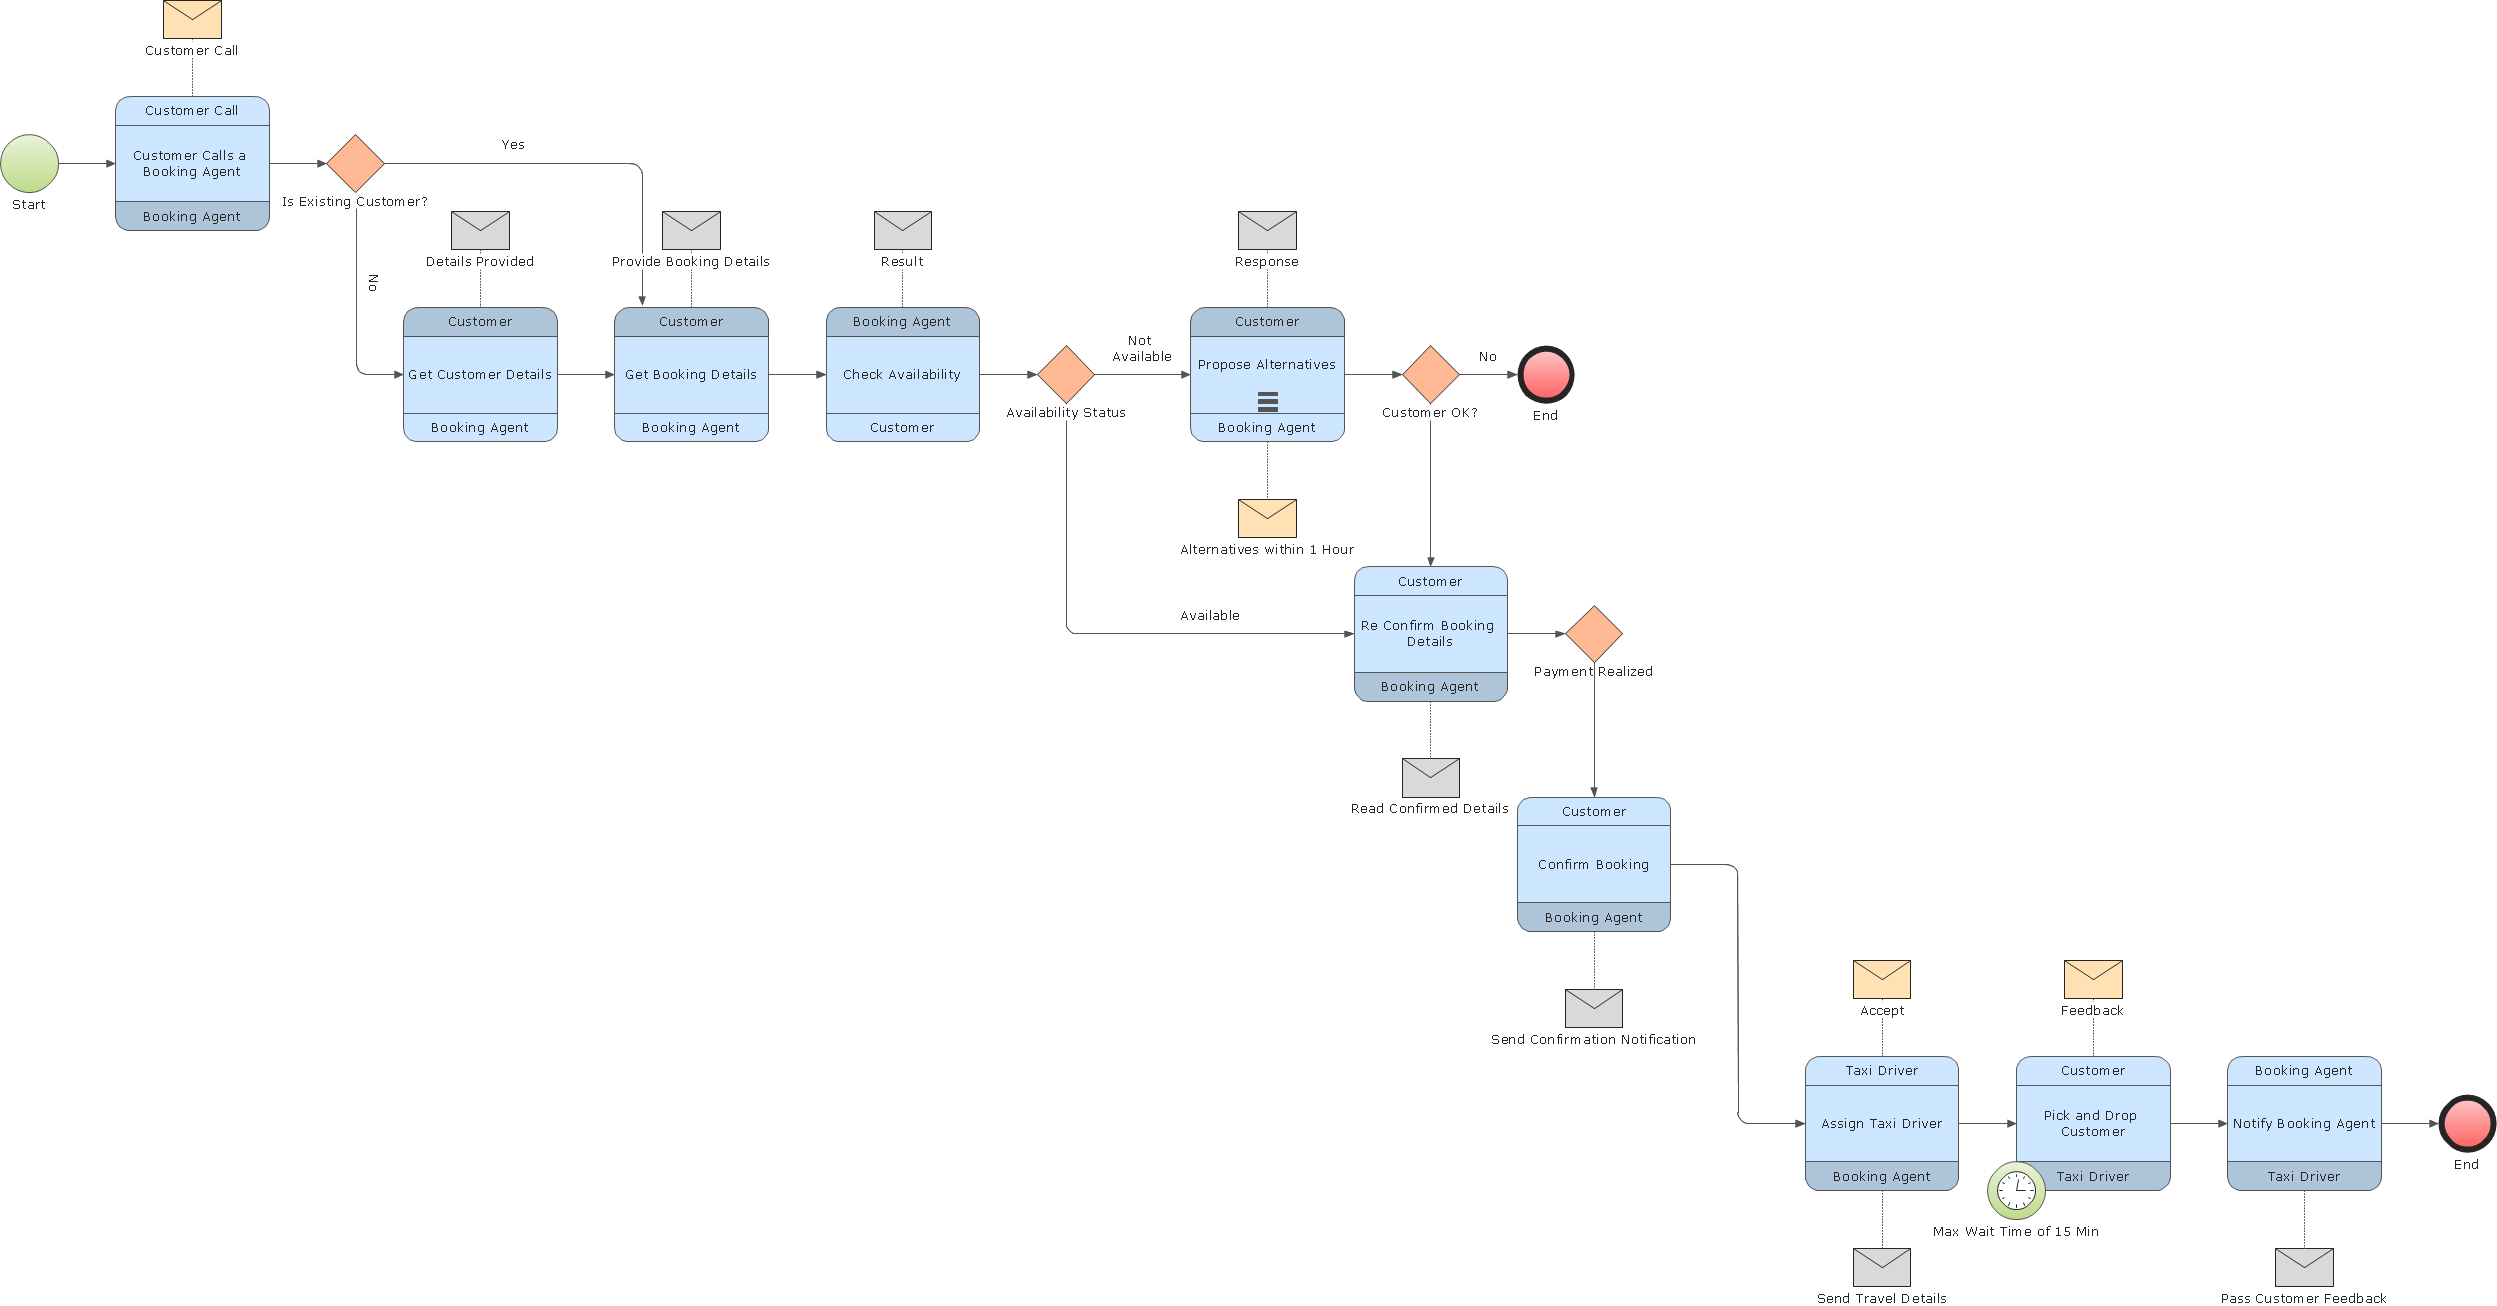
Picture: Business Process Modeling Tools
For those who want to know what is a cross functional flowchart and how to draw it, we preared a special library and professional looking templates.
Take all the advantage of your drawing software to learn and create such a well-designed flowcharts.
Watch the HowTo video to learn more.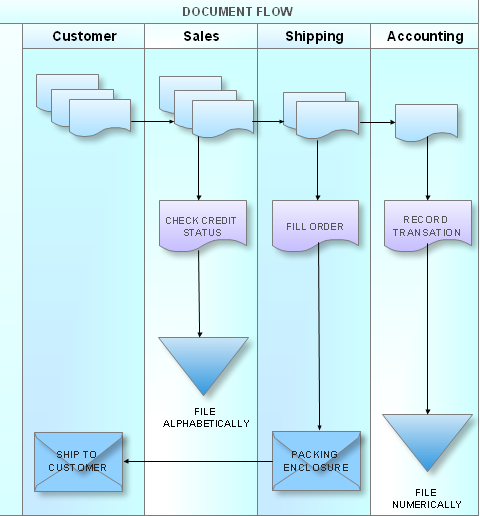
Picture: What is a Cross Functional Flow Chart?
Using the ready-to-use predesigned objects, samples and templates from the Business Diagrams Solution you can create your own professional-looking Venn Diagrams quick and easy.
Picture: 2 Circle Venn Diagram. Venn Diagram Example
Related Solution:
The following examples cctv network were created in ConceptDraw DIAGRAM diagramming and vector drawing software using the Audio, Video, Media Solution. Using this easily customizable cctv network template you can represent any existing cctv network.
Picture: CCTV Network Example
Related Solutions:


