
Example 1. Pictorial Chart - World Population
First of all we want to pay your attention on 10 libraries included in Pictorial Infographics Solution:
- Business People Pictograms
- Computer Pictograms
- Ecology Pictograms
- Medicine and Health Pictograms
- Office Pictograms
- People Pictograms
- Shopping Pictograms
- Time and Clock Pictograms
- Transport Pictograms
- Travel and Tourism Pictograms

Example 2. People Pictograms Library Design Elements
These 10 libraries contain 197 predesigned vector pictograms which are the most popular and widely used in infographics design. They are helpful and timesaving because all what you need is simply drag desired of them from the libraries and arrange in your document.

Example 3. Pictorial Chart - Computer and Internet Use in the United States
ConceptDraw STORE offers you also a set of samples of various colorful and attractive pictorial charts. They are the good examples which can be also used as the base for your own pictorial infographics.

Example 4. Pictorial Chart - Tourism in the World
This pictorial chart was created in ConceptDraw DIAGRAM using the Pictorial Infographics Solution and visualize the information for the tourism in the world. An experienced user spent 10 minutes creating this sample.
Use the tools of Pictorial Infographics Solution for drawing your own Pictorial Infographics of any complexity quick, easy and effective.
All source documents are vector graphic documents. They are available for reviewing, modifying, or converting to a variety of formats (PDF file, MS PowerPoint, MS Visio, and many other graphic formats) from the ConceptDraw STORE. The Pictorial Infographics Solution is available for all ConceptDraw DIAGRAM or later users.
TEN RELATED HOW TO's:
Using the ConceptDraw DIAGRAM software you will find it really simple to design thematic maps.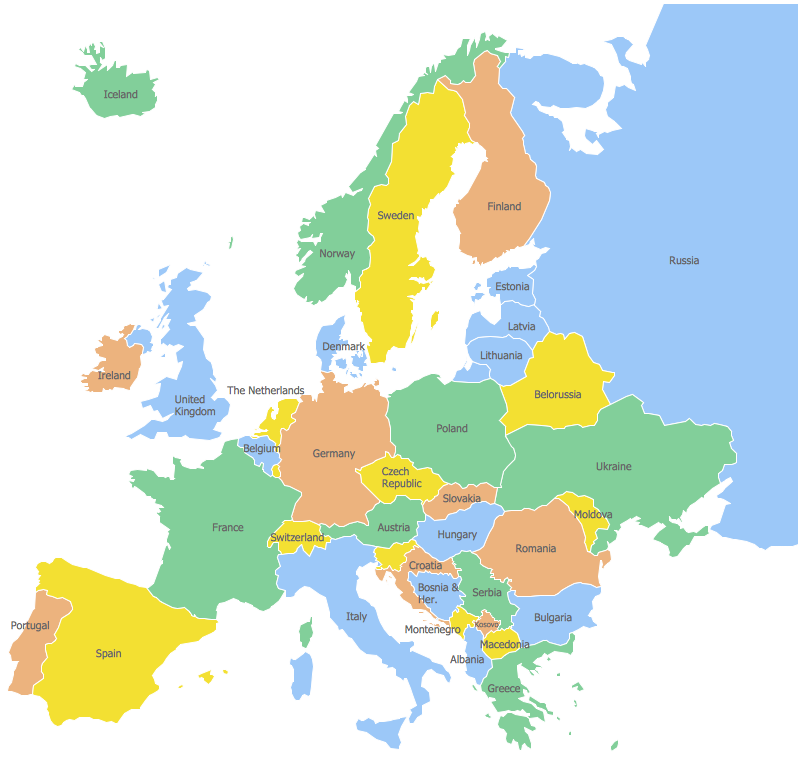
Picture: Geo Map — Europe
Related Solution:
ConceptDraw DIAGRAM extended with Pictorial Infographics Solution from the “Infographics” Area is a powerful Infographic Software. Make sure in it right now!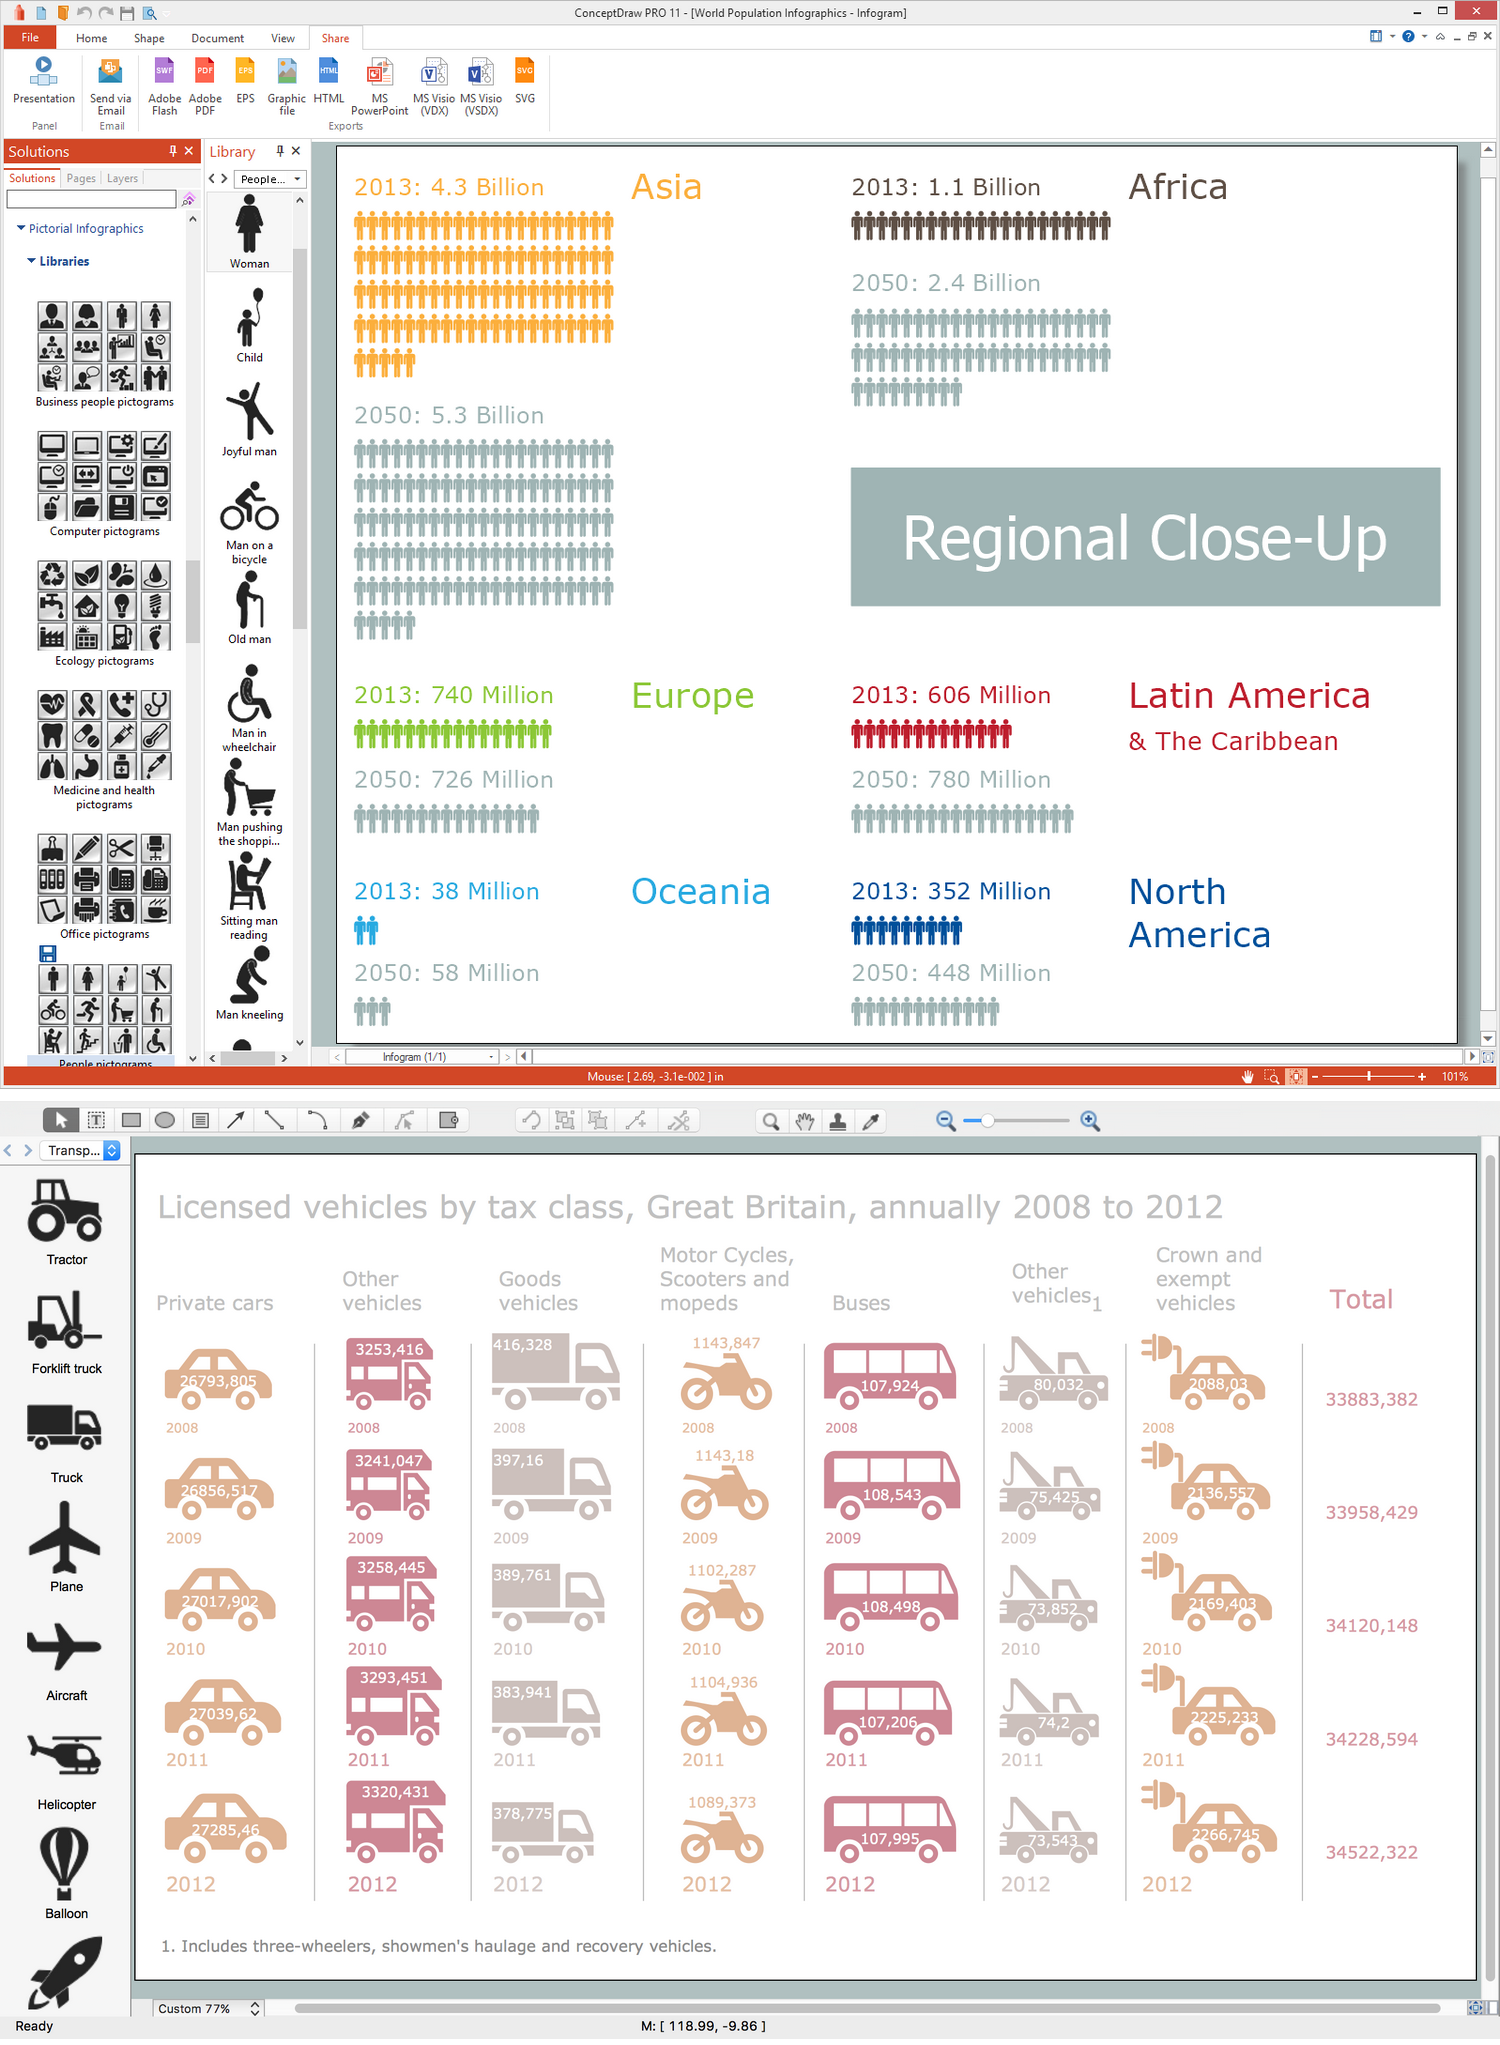
Picture: Infographic Software
Related Solution:
Electrical plan is a document that is developed during the first stage of the building design. This scheme is composed of conventional images or symbols of components that operate by means of electric energy. To simplify the creation of these schemes you can use house electrical plan software, which will not require a long additional training to understand how to use it. You only need to install the necessary software ant it’s libraries and you’ll have one less problem during the building projection.
Any building contains a number of electrical systems, including switches, fixtures, outlets and other lightening equipment. All these should be depicted in a building electrical plans and included to general building documentation. This home electrical plan displays electrical and telecommunication devices placed to a home floor plan. On the plan, each electrical device is referenced with the proper symbol. Electrical symbols are used for universal recognition of the building plan by different persons who will be working on the construction. Not all possible electric symbols used on a certain plan, so the symbols used in the current home plan are included to a legend. The electrical home plan may be added as a separate document to a complete set of building plans.
Picture: How To use House Electrical Plan Software
Related Solution:
Computer networks nowadays are spread all across the world. The large number of parameters, such as geographic scale or communication protocols, can divide networks. One of the most common types of networks is called local area network (LAN). It convenient to represent network examples by means of diagrams.
This local area network (LAN) diagram provides an easy way to see the way the devices in a local network are interacted. The diagram uses a library containing specific symbols to represent network equipment , media and the end-user devices such as computers (PC, mac, laptop) , network printer, hubs, server and finally a modem. There are two types of network topologies: physical and logical. The current diagram represents precisely a physical type of LAN topology because it refers to the physical layout of a local network equipment.
Picture:
What is a Local Area Network?
Examples of LAN Diagrams
Related Solution:
A key point of conference success is the ability to see slides in real time, and hold documented discussions during the meeting. Remote Presentation for Skype is a new solution allows real-time presenting that benefits work groups who need collaborate by web meetings.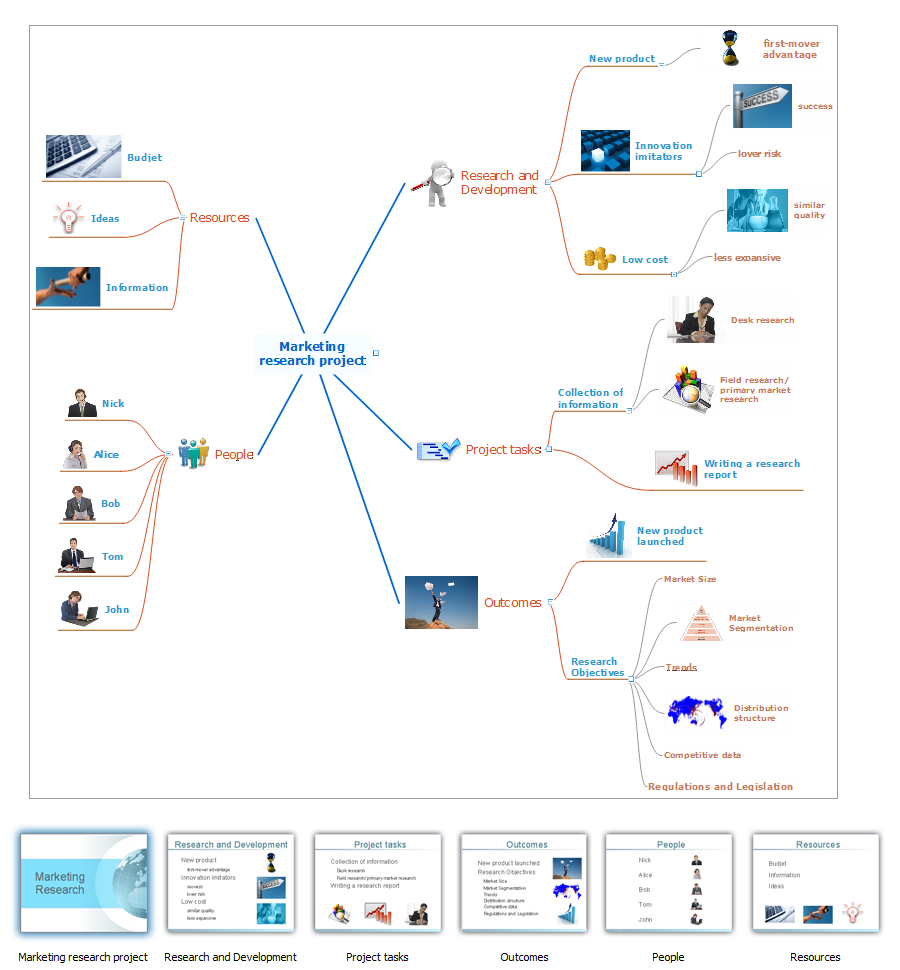
Picture: Tool for Workgroup Briefings, Meetings and Decisions
Related Solution:
UML Diagrams Social Networking Sites Project. This sample was created in ConceptDraw DIAGRAM diagramming and vector drawing software using the UML Use Case Diagram library of the Rapid UML Solution from the Software Development area of ConceptDraw Solution Park.
This sample shows the Facebook Socio-health system and is used at the projection and creating of the social networking sites.
Picture: UML Use Case Diagram Example. Social Networking Sites Project
Related Solution:
Local area network connects computers and other network appliances within an area, such as office building or a campus. It can be difficult to provide such network without a predesigned plan. For these purposes you can use network diagram software, which helps you to create LAN network diagrams and office network diagrams quickly and effortless. This will speed up your work and you can save the diagram for the future network improvements.
The following diagram illustrates a network topology of the small office. LAN configuration has a star topology. The local network joins 8 computers among which are several desktop PCs, laptop, two iMacs and iBook. The end-point devices are divided into three groups. Each group is connected to its hub. There is a network printer and a modem, which are interconnected with other devices through a network server. Each computer on the LAN can access the server through a corresponding hub.
Picture: Network Diagram Software. LAN Network Diagrams. Physical Office Network Diagrams
Related Solution:
Process Decision Program Chart (PDPC) is a commonly used technique that was designed in order to help prepare the contingency plans. The emphasis of the PDPC is identifying the consequential impact of failure on activity plans as well as creating the appropriate contingency plans in terms of limiting the risks. Planning to make the tree diagrams and/or the process diagrams can be extended by a couple of levels when the PDPC can be applied to the bottom level tasks on those diagrams.
Picture: Risk Diagram (Process Decision Program Chart)
Related Solution:
As restaurant industry is growing rapidly nowadays, researches show that almost half of the adults have worked in a restaurant or a cafe. Moreover, many of them dream to start their own someday. Unfortunately, it takes a lot of time to write a business plan and to find a great location, although some know how to create a restaurant floor plan in minutes or how to plan budget effortlessly. Hiring employees can also cause a lot of headache, but this is crucial for further success, because every guest comes to restaurant for a good service and delicious food. It is also worth noting that restaurant concept is also important, because it defines target audience and influences the menu.
This diagram represents the floor plan of an ongoing sports-theme establishment - restaurant, cafe, or other food service. A number of widescreen monitors installed along the perimeter provide visitors the opportunity to follow the course of a match from anywhere in the dining room of restaurant or cafe. The most of sports fans believe that food and alcohol is a big part of any sports show. That is why the dining room takes the most space - almost 60% of the total establishment space. Nearly all sports fans consume beverages while watching sports - beer, soda or water at least. Thus, the restaurant floor plan designers added a large lavatory there. Moreover, project developers considered unnecessary the gender division of such delicate place - perhaps they guess that only men are watching football, or believe that alcohol will eliminate the most of gender differences.
Picture: How To Create Restaurant Floor Plan in Minutes
Related Solution:
The vector stencils library UML Use Case contains specific symbols of the UML notation such as actors, actions, associations and relationships for the ConceptDraw DIAGRAM diagramming and vector drawing software.
Picture: Jacobson Use Cases Diagram
Related Solution:


