Information Graphics
Infographics can be created with the help of ConceptDraw DIAGRAM diagramming and drawing software same way any other scheme or flowchart can be made: by using the appropriate solution taken from the ConceptDraw STORE application which consists of the needed tools such as the stencil libraries with the design elements that all can be used by the ConceptDraw DIAGRAM users.
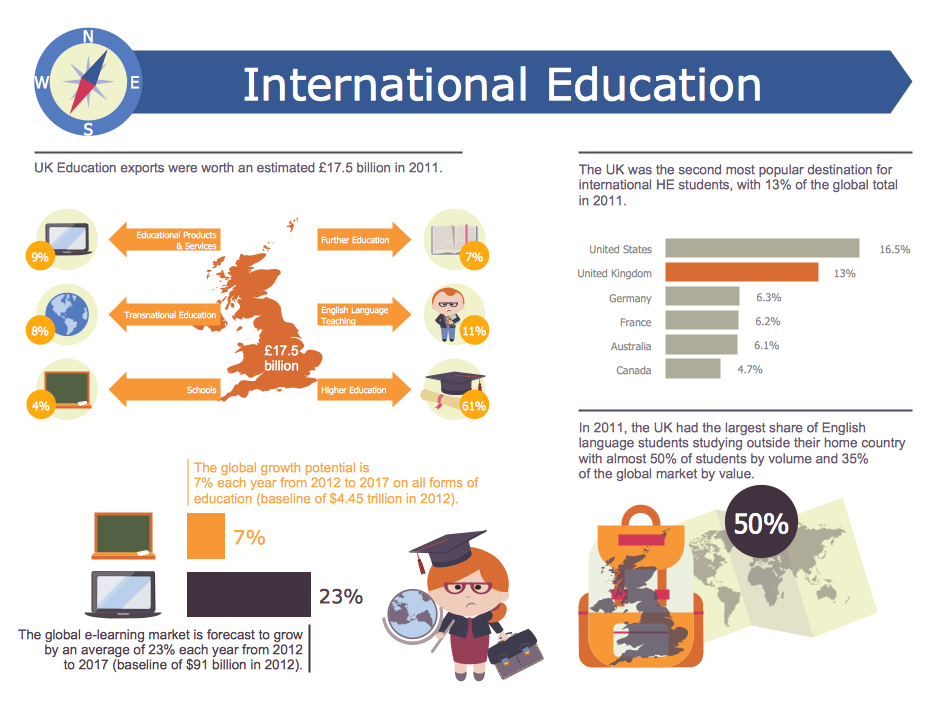
Being a clipped compound of two words — "graphics" and "information", infographics is the graphic visual representations of some information, some data or some knowledge that is intended to present that information, data or knowledge both quickly and clearly. Improving the cognition by utilizing the needed graphics in order to enhance the human’s ability to see both trends and patterns, the information graphics is a common way of illustrating the needed data.
Similar to infographics pursuits are data visualization, information visualization, statistical graphics, information architecture and information design as infographics have evolved in recent years to be the one used for mass communication so it is more popular nowadays than all the other mentioned ways. Being designed with much fewer assumptions about the readers' knowledge base than other types of visualizations, information graphics can be created with the help of the ConceptDraw DIAGRAM application within only a few minutes as long as the appropriate (such as the “Pictorial Infographics”) solution is being used.
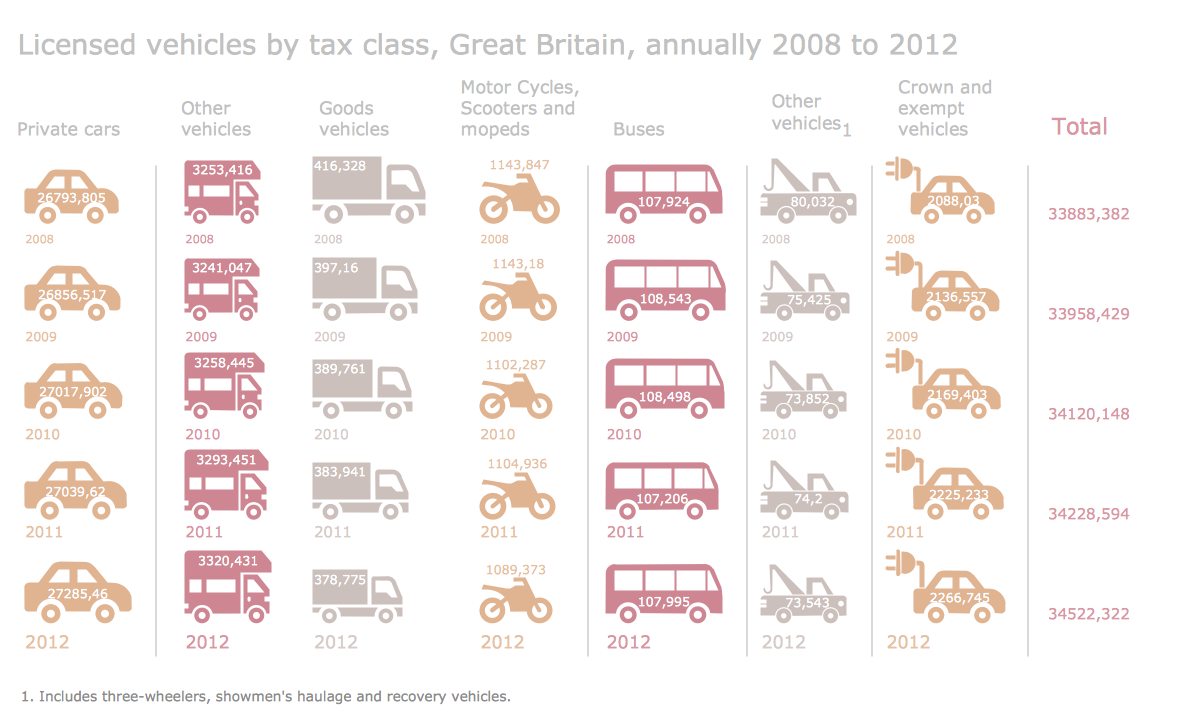
Example 1. Information Graphics — Licensed Vehicles by tax class Great Britain annually 2008 to 2012
There are three parts of all infographics that are the content, the knowledge and the visual. The last one consists of both colours and graphics, which can be two different types of — reference and theme. All the theme graphics can be included in all infographics, representing all the underlying visual representation of any needed data. Next type, the reference graphics can look like icons which all can be used for pointing some certain data making those who look through it focusing on its particular parts.
Although the icons are very common for being used within information graphics, they are not always found in infographics. At the same time, there are the most important aspects of infographics, one of which is the fact that they may contain some kind of insight into that data that they present.
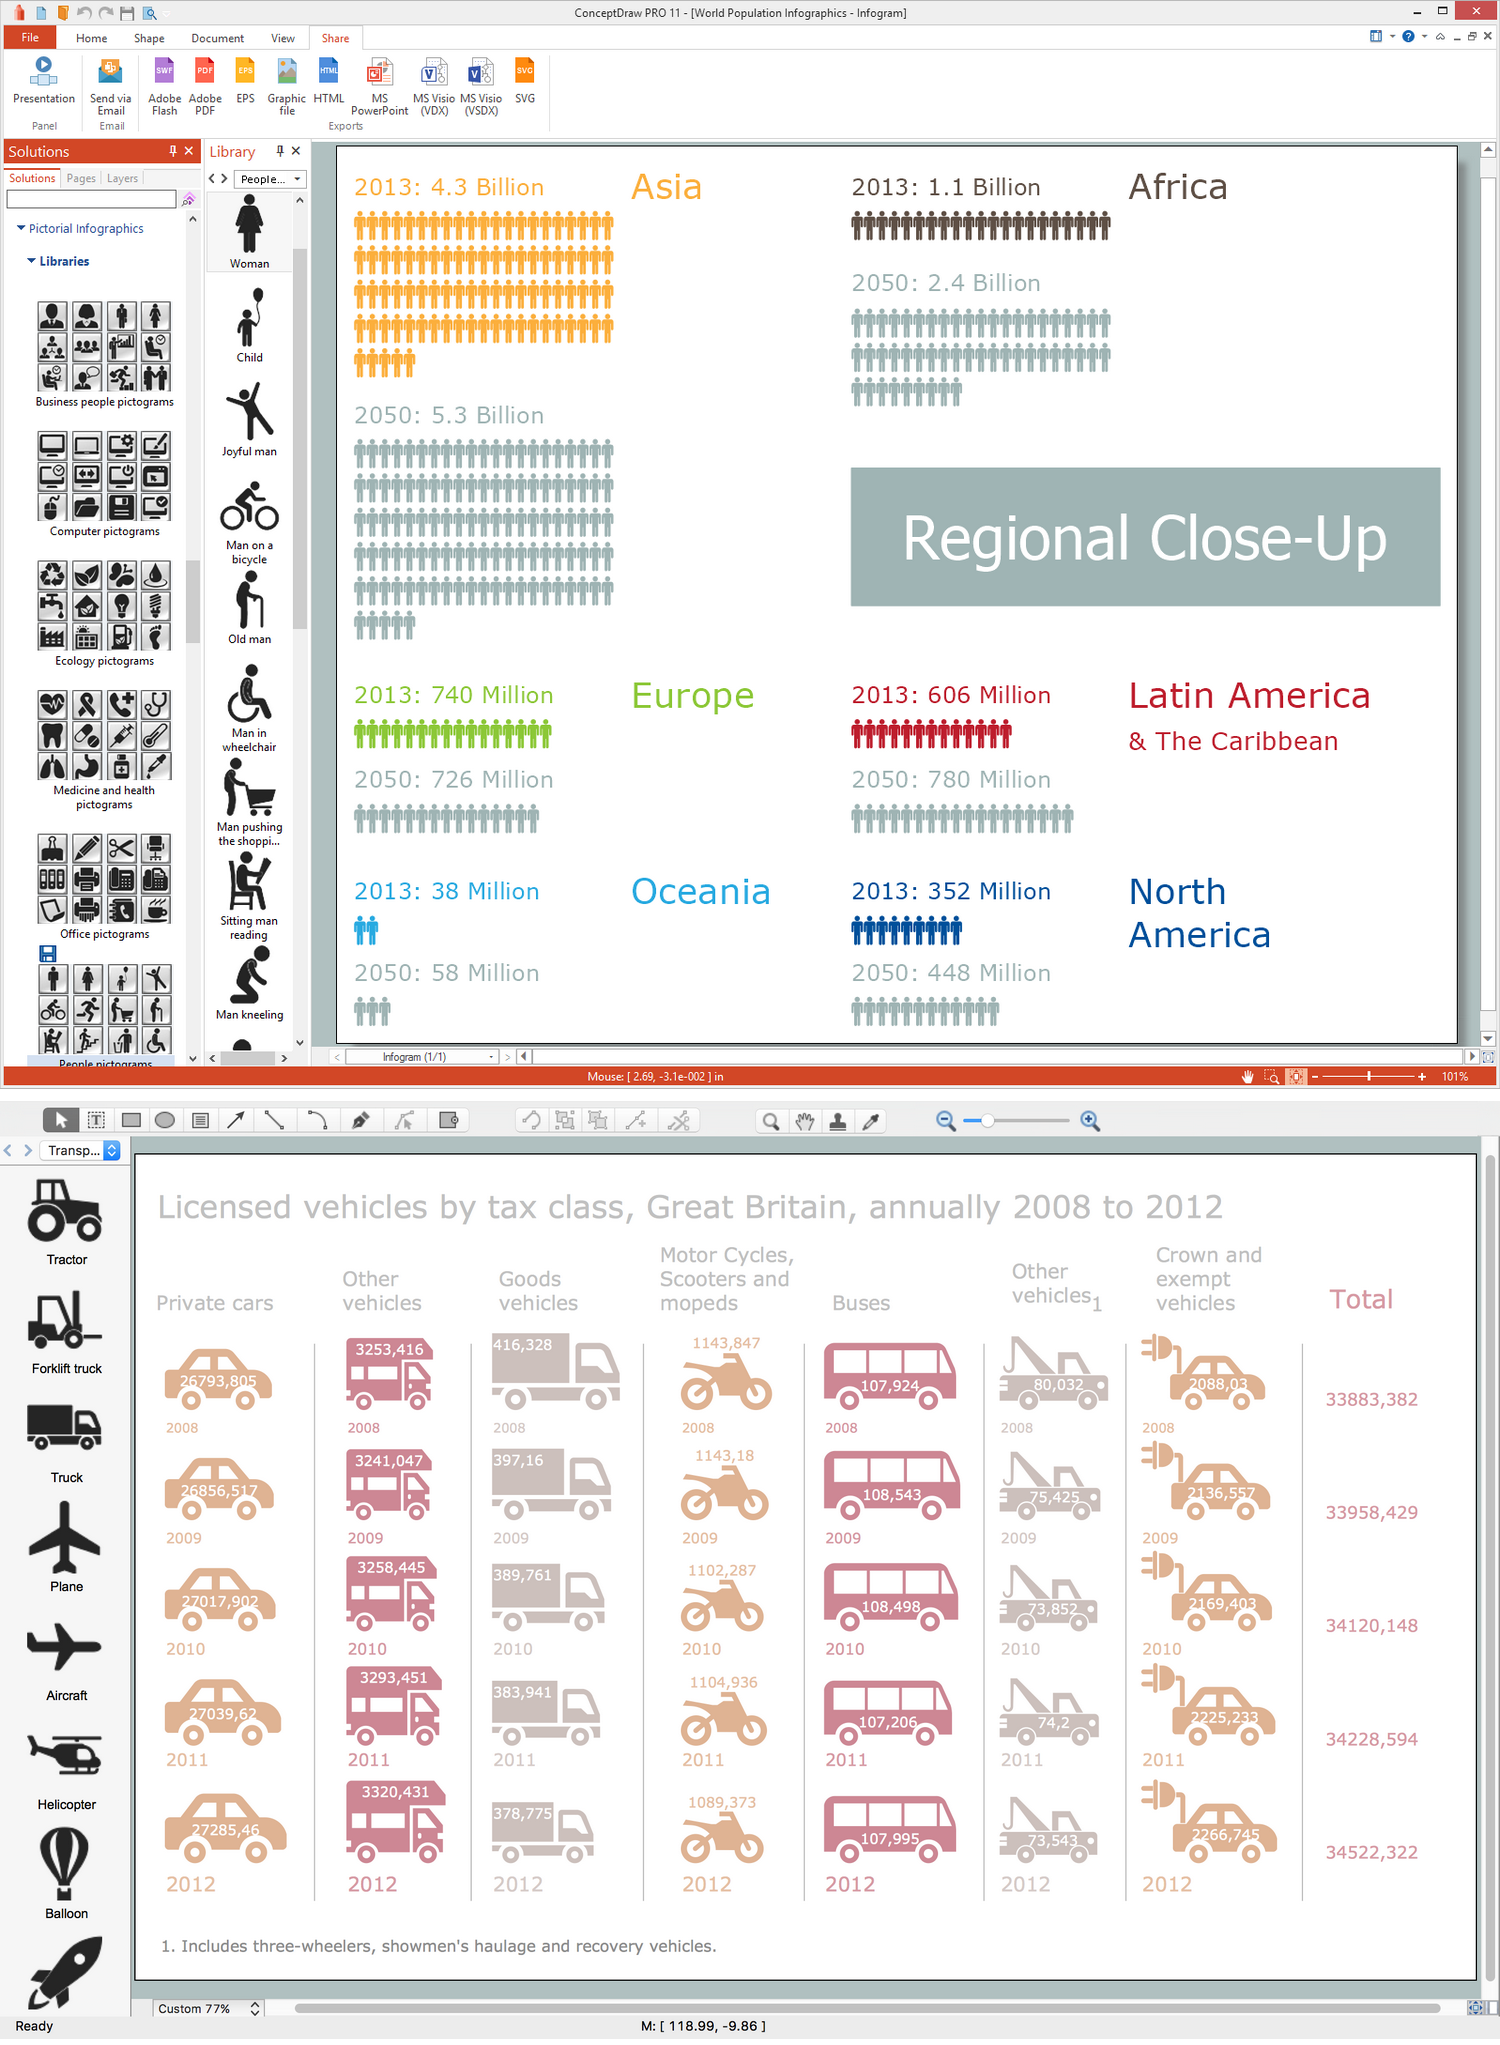
Known to be very effective because of their visual element, infographics is what can be created in the ConceptDraw DIAGRAM diagramming and drawing software with the aid of the Pictorial Infographics solution where 10 stencil libraries full of the design elements can be found (197 of them for now).
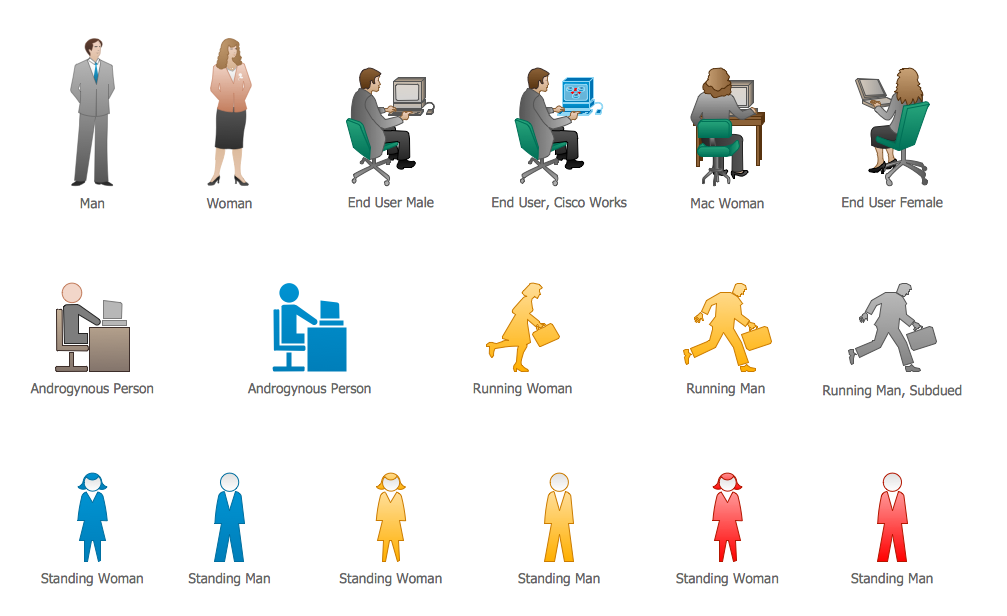
The design elements from the “Pictorial Inforgraphics” stencil library are: “Man”, “Child”, “Woman”, “Joyful man”, “Man in wheelchair”, “Old man”, “Man cooking”, “Man exit”, “Running man”, “Balloon”, “Plane”, “Aircraft”, “Car”, “Tram”, “Bicycle”, “Electric car”, “Rocket”, “Locomotive”, “Subway”, “Train”, “Tow truck”, “Forklift truck”, “Man photographing” and many other icons.

Example 2. Pictorial Infographics Solution in ConceptDraw STORE
It is well-known that all people receive input from all five of their senses which are sight, hearing, smell, touch and taste, but we can receive much more information from vision than any of the other four mentioned senses. 50% of the human brain is known to be dedicated to the visual functions and any image can be processed much faster than any text.
Our brain has the ability to process the pictures all at once, but processing text might take more time as it can be done only in a linear fashion, so it takes much longer to obtain any information from text. The page on the Internet may link to some complete report, but the infographic is what makes the reader to pay attention to it and to understand it.
While designing the visual aspects of some infographic, a few issues have to be taken into consideration in order to optimize the effectiveness of such visualization. Thus, there are six different components of any visual encoding which are marks, connection, spatial, enclosure, temporal encoding and retinal properties. Each of the mentioned features can be used in its own way for representing the relationships between different types of information.
The spatial position is known to be the most effective way to represent some numerical data, leading to the easiest as well as the fastest understanding by the viewers. That is the reason why some of the designers often represent the most important relationship that is depicted in an infographic spatially.
There are also three basic provisions of communication that need to be taken into account while designing some infographic. They are comprehension, retention and appeal. The first one, an “appeal" is the idea that the communication needs to engage its audience. The comprehension may imply that the viewer should be able to understand the information that is presented to them easily meaning he or she should not have any doubts about what is illustrated but looking at the clearly represented facts.

Example 3. Information Graphics — Small Business Statistics UK 2013
Recently, as another try of study the effect of the layout of the infographics on the comprehension of the viewers, a new method was applied on different types of common layouts for the infographic design that was called as a “Neural Network” one being based on the cognitive load estimation. When all the factors that were listed above are taken into consideration due to designing some infographics, such drawings can be highly efficient as well as effective, allowing to convey some large amounts of information in a simple visual manner.
Having the Pictorial Infographics solution that consists the previously mentioned design elements as well as the examples, such as a “Pictorial Chart — Computer and Internet Use in the United States”, “Pictorial Chart — World Population Infographics”, “Pictorial Chart — Licensed Vehicles by Tax Class, Great Britain, Annually — 2008 to 2012”, “Pictorial Chart — Small Business Statistics (UK 2013)” and “Pictorial Chart — Tourism in the World”, all the ConceptDraw DIAGRAM users have a chance to make the unique as well as the smart and professionally looking information graphics by either making them from a scratch using the needed available symbols or editing the pre-made templates.