Sample Pictorial Chart.
Sample Infographics
Sample Pictorial Chart
Everyone loves infographics! It is very popular tool that allows to represent the complex information, data, knowledge in simple, visual and attractive graphical form.
But how to draw pictorial chart simply and quickly? ConceptDraw DIAGRAM diagramming and vector drawing software extended with unique Pictorial Infographics Solution from the “What is Infographics” Area will help you design pictorial infographics illustrations without efforts.

Sample Pictorial Chart 1. Tourism in the World
Pictorial Infographics solution provides easy-to-use design infographics drawing tools, large collection of different sample infographics and infograms, sample pictorial chart and templates to be filled in, and 10 libraries with great quantity of predesigned vector pictograms.

Sample Pictorial Chart 2. Licensed Vehicles by tax Class Great Britain Annually (2008 to 2012)
How to use infograms included in the Pictorial Infographics solution? They can be effectively used for quickly drawing your own professional looking, interesting and attractive infographics. Or if you want, you can use them as-is.

Sample Infographics 3. World Population Infographics
The easiest way to design pictorial infographics is:
- choose the sample appropriate for your needs from the Pictorial Infographics solution,
- and make changes – edit the text, add pictograms from the libraries.

Sample Infographics 4. Computer and Internet Use in the United States
ConceptDraw DIAGRAM also gives you the perfect possibility to change the colors of predesigned pictograms. It is indispensable tool to make your design infographics illustrations more beautiful and colorful!

Sample Pictorial Chart 5. Small Business Statistics (UK 2013)
The samples you see on this page were created in ConceptDraw DIAGRAM using the vector pictograms from the Pictorial Infographics Solution libraries. These samples demonstrate the solution's capabilities and the professional results you can achieve. An experienced user spent 10 minutes creating every of these samples.
Use Pictorial Infographics solution to draw your own design pictorial infographics documents quick and easy.
All source documents are vector graphic documents. They are available for reviewing, modifying, or converting to a variety of formats (PDF file, MS PowerPoint, MS Visio, and many other graphic formats) from the ConceptDraw STORE. The Pictorial Infographics Solution is available for all ConceptDraw DIAGRAM or later users.
TEN RELATED HOW TO's:
Start design your own flowchart with ConceptDraw DIAGRAM and accomplish great results at the moment.
Picture: Draw Flowcharts with ConceptDraw
Related Solution:
ConceptDraw Column Chart software allows drawing column charts using predesigned objects or drawing tools. In ConceptDraw Column Chart software you can find a complete set of column chart tools and objects.
Picture: Column Chart Software
Related Solution:
TOWS Matrix is an effective tool which allows to analize the external opportunities and threats by means of analyzing the internal strengths and weaknesses of a company. ConceptDraw DIAGRAM diagramming and vector drawing software extended with SWOT and TOWS Matrix Diagrams Solution from the Management Area will help design TOWS Matrix for your company without efforts.
Picture: TOWS Matrix
Related Solution:
ConceptDraw DIAGRAM software enhanced with Metro Map Solution from the Maps Area of ConceptDraw Solution Park provides extensive drawing tools for fast and easy creating various metro maps, route maps, transport schemes, metro path maps, subway train maps, and many other types of maps.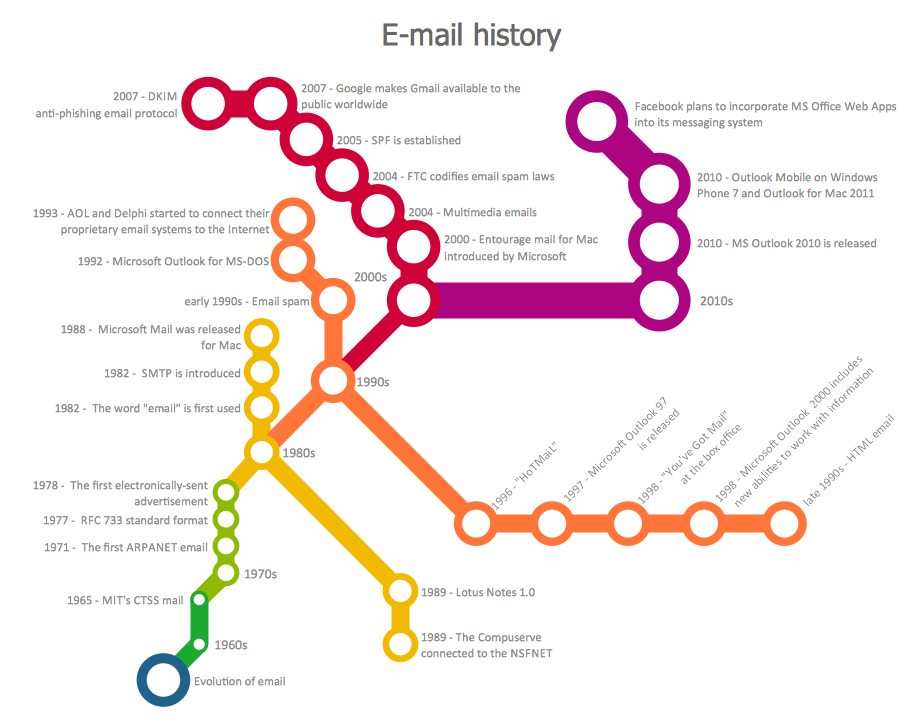
Picture: Metro Maps
Related Solution:
Tool to draw Metro Map styled inforgraphics. London Tube map sample.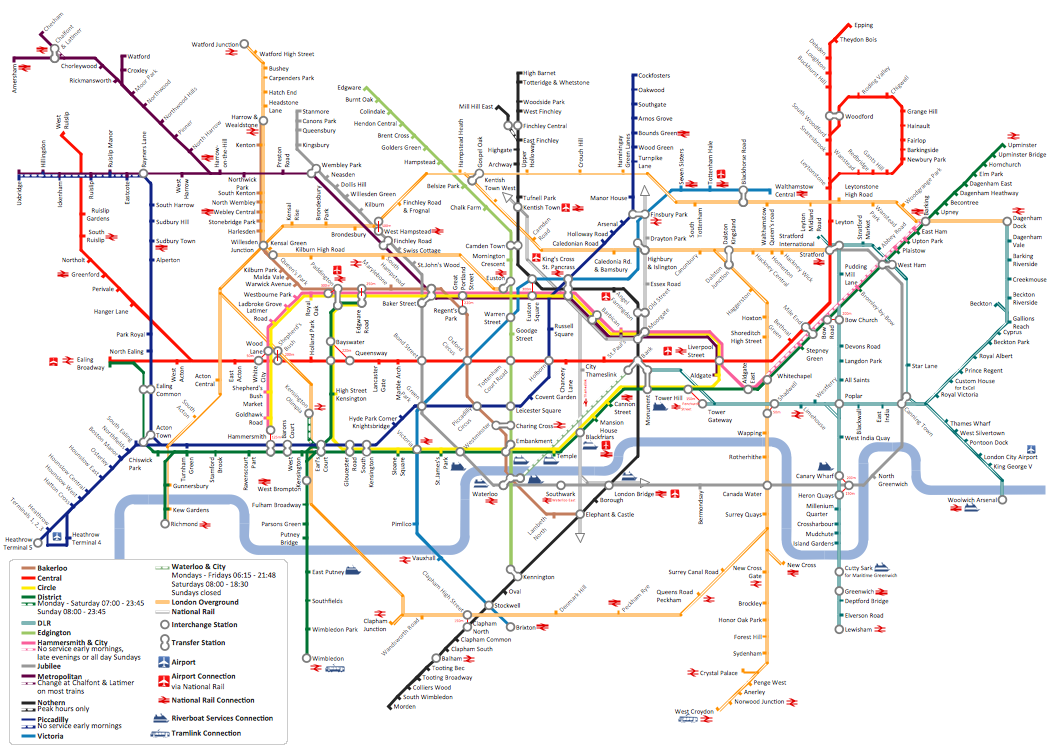
Picture: How to draw Metro Map style infographics? (London)
Related Solution:
Processing Flow Chart is a simplified sketch used in chemical and process engineering to illustrate general plant streams, major equipment, and key control loops. ConceptDraw DIAGRAM enhanced with Flowcharts Solution is ideal software for designing ✔️ Processing Flow Charts, ✔️ Process Flow Charts, ✔️ Flow Chart Process Maps
Picture: Processing Flow Chart
Related Solution:
Local area network connects computers and other network appliances within an area, such as office building or a campus. It can be difficult to provide such network without a predesigned plan. For these purposes you can use network diagram software, which helps you to create LAN network diagrams and office network diagrams quickly and effortless. This will speed up your work and you can save the diagram for the future network improvements.
The following diagram illustrates a network topology of the small office. LAN configuration has a star topology. The local network joins 8 computers among which are several desktop PCs, laptop, two iMacs and iBook. The end-point devices are divided into three groups. Each group is connected to its hub. There is a network printer and a modem, which are interconnected with other devices through a network server. Each computer on the LAN can access the server through a corresponding hub.
Picture: Network Diagram Software. LAN Network Diagrams. Physical Office Network Diagrams
Related Solution:
There are three main types of organizational structures which can be adopted by organizations depending on their objectives: functional structure, divisional structure, matrix structure.
ConceptDraw DIAGRAM diagramming and vector drawing software enhanced with 25 Typical Orgcharts solution from the Management area of ConceptDraw Solution Park is ideal for designing diagrams and charts of any organizational structure types.
Picture: Organizational Structure Types
Related Solution:
Typography Infographics Solution for ConceptDraw Solution Park is the best answer on the question “How to create an Infographic?”. The Typography Infographics created in ConceptDraw DIAGRAM using the Typography Infographics Solution are the real typography art.
Picture: Typography Art
Related Solution:
A database is a data collection, structured into some conceptual model. Two most common approaches of developing data models are UML diagrams and ER-model diagrams. There are several notations of entity-relationship diagram symbols and their meaning is slightly different. Crow’s Foot notation is quite descriptive and easy to understand, meanwhile, the Chen notation is great for conceptual modeling.
An entity relationship diagrams look very simple to a flowcharts. The main difference is the symbols provided by specific ERD notations. There are several models applied in entity-relationship diagrams: conceptual, logical and physical. Creating an entity relationship diagram requires using a specific notation. There are five main components of common ERD notations: Entities, Actions, Attributes, Cardinality and Connections. The two of notations most widely used for creating ERD are Chen notation and Crow foot notation. By the way, the Crow foot notation originates from the Chen notation - it is an adapted version of the Chen notation.
Picture: ERD Symbols and Meanings
Related Solution:


