Example 1. Object-Oriented Design - Final Object Schematic
There are altogether four libraries that are included in the previously mentioned solution: the “Design Elements — IDEF0” one, the “Design Elements — IDEF3 Object Schematic Symbols” one, the “Design elements — IDEF3 Process Schematic Symbols” and the “Design Elements — IDEF3 Referents and Notes”. Choosing any needed of them depends on the tasks you need to complete as each of them has its own unique design elements.

Example 2. IDEF Business Process Diagrams Solution in ConceptDraw STORE
Thus, in the “Design Elements — IDEF0” stencil library there are such design elements as a Box where a “Function name” can be mentioned, the Arrows named “Straight the segment”, “Straight the arrow segment”, “Curved arrow segment; corners are rounded with 90 degree arcs”, “Forking arrows”, “Joining arrows”, “Tunneled arrows; Use the Action button to reverse tunnel” and “Dotted line”.
There are also Control arrow, Input arrow, a Mechanism arrow, a Call arrow and an Output arrow available for any ConceptDraw DIAGRAM user to have as long as both the ConceptDraw STORE application is downloaded and the IDEF Business Process Diagrams solution from it.
Software design is known to be the process by which any agent can create some particular specification of a software artifact. The mentioned specification may be known to be intending to accomplish some particular goals by using a set of some simple components as well as the subject to constraints.
Any software design may refer to either the activity of following the requirements’ specification in a stylized software engineering process or all the possible activity that is known to be involved in conceptualizing, implementing, framing, commissioning and modifying complex systems.
Software design is also usually known to be involving the process of problem-solving as well as the process of planning some software solution, including both a low-level component and algorithm design as well as another, an architecture design known to be “high-level” one.
To help the IDEF Business Process Diagrams get complete on time, the IDEF Business Process Diagrams solution can be used anytime by any ConceptDraw DIAGRAM user as long and they have the ConceptDraw STORE application downloaded from this site as well.
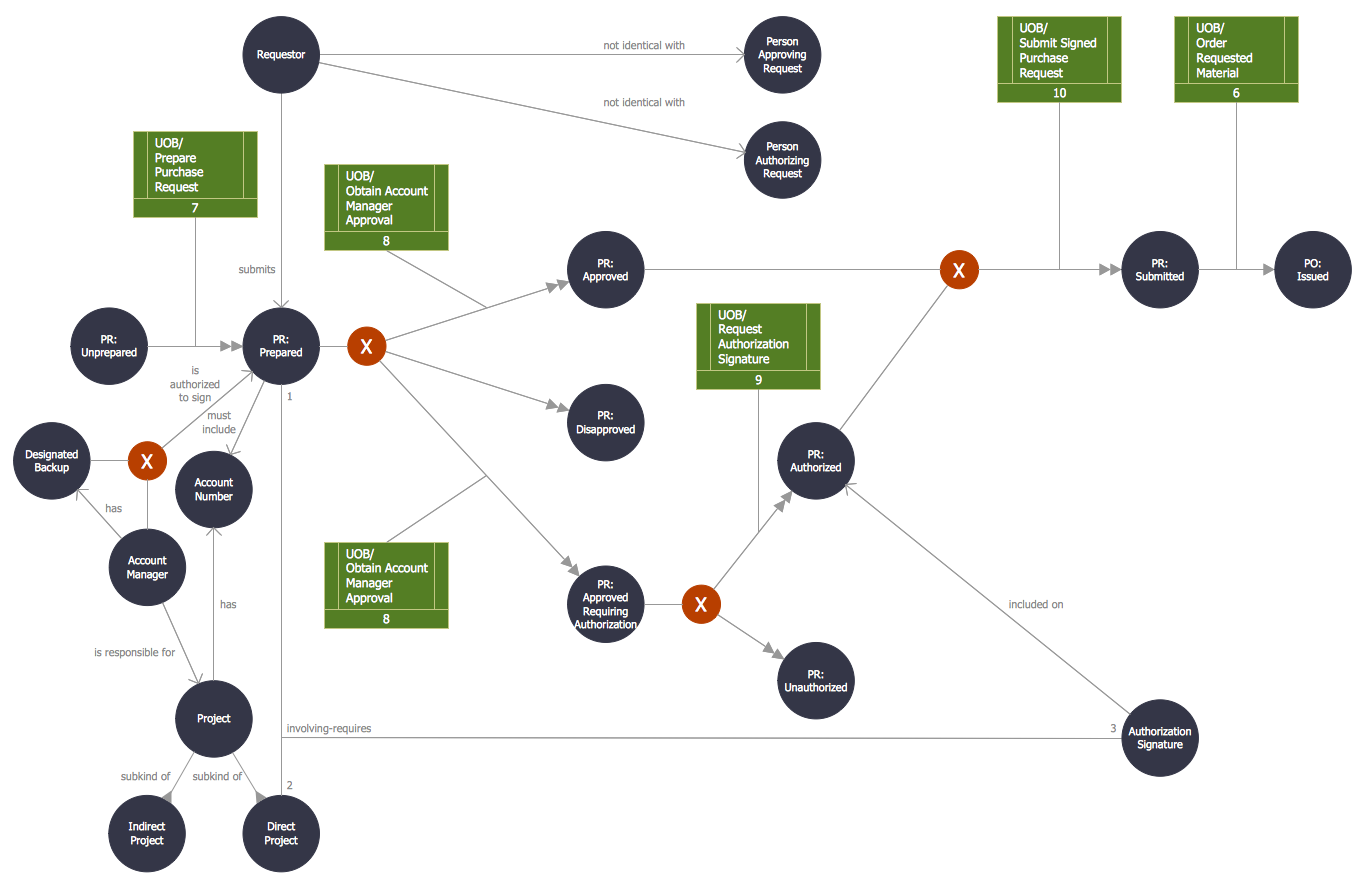
Any object is known to be containing some encapsulated data as well as the procedures that are all grouped together in order to represent some entity. The so-called “object interface” is the one defining how exactly the object can be interacted with.
Any object-oriented program can be described by the interaction of such objects and the object-oriented design is what the discipline of defining the objects as well as their interactions called. The mentioned objects interactions if what is used for solving the problems that were both identified and documented during the object-oriented analysis.
A description of the class-based subset of object-oriented design follows next, not including the object prototype-based approaches. Such approaches are known for being the ones where the objects are typically obtained by cloning other (prototype) objects, such as their prototypes, but not instantiating the classes.
Any object-oriented design is what a method of the design known that can encompass the process of the object-oriented decomposition as well as a notation. It is being done for depicting both physical and logical, dynamic and state models of some system under design.
Any input used within the object-oriented design is known to be provided by the output of object-oriented analysis. Realizing that any output artifact never needs to be completely developed in order to serve as input of object-oriented design, both design and analysis may occur in parallel.
In practice, though, the results of one activity can feed the other one through an iterative process in a short feedback cycle. Both design and analysis can be performed incrementally. Also, all the artifacts can be continuously grown instead of completely developed in one shot.
The examples of the input artifacts used within the object-oriented design can be a conceptual model and user interface documentation, as well as the so-called relational data model.
There are also known to be five basic concepts of the object-oriented design that are simply the implementation level features built into the programming language, having such names as Object/Class, Information hiding, Inheritance, Interface, etc.

Example 3. IDEF3 Object State Transition Schematic
The design principles as well as the strategies are: the dependency injection that is known to be the basic idea affirming that in case some object depends upon having an instance of some other object then the needed object is known to be "injected" into the dependent object, and an acyclic dependencies principle that can be referred to the dependency graph of some components as well as the packages where there are no cycles at all.
The last one also is known to be referred to as having a directed acyclic graph and it can also be created with the help of the ConceptDraw DIAGRAM diagramming and drawing software as well as the other needed drawings.
TEN RELATED HOW TO's:
While creating flowcharts and process flow diagrams, you should use special objects to define different statements, so anyone aware of flowcharts can get your scheme right. There is a short and an extended list of basic flowchart symbols and their meaning. Basic flowchart symbols include terminator objects, rectangles for describing steps of a process, diamonds representing appearing conditions and questions and parallelograms to show incoming data.
This diagram gives a general review of the standard symbols that are used when creating flowcharts and process flow diagrams. The practice of using a set of standard flowchart symbols was admitted in order to make flowcharts and other process flow diagrams created by any person properly understandable by other people. The flowchart symbols depict different kinds of actions and phases in a process. The sequence of the actions, and the relationships between them are shown by special lines and arrows. There are a large number of flowchart symbols. Which of them can be used in the particular diagram depends on its type. For instance, some symbols used in data flow diagrams usually are not used in the process flowcharts. Business process system use exactly these flowchart symbols.
Picture: Flowchart Symbols: Meaning and Examples
Related Solution:
ConceptDraw DIAGRAM system design software is a product of CS Odessa that was developed especially for making it much simpler to create all the needed diagrams, charts, flowcharts, schemes and other drawings when there is such a need in it. Having the Specification and Description Language (SDL) solution installed from the ConceptDraw STORE application may be another bonus to any ConceptDraw DIAGRAM diagramming and drawing software’s user as it offers both stencil libraries with the design elements and the pre-made examples of the diagrams, such as the SDL ones.
Picture: System Design
Related Solution:
Designing your own house sounds exciting at the beginning, but as the time passes, the more you realize there are stumbling blocks. To aid yourself, discover how to use house design software, and develop floor plans, landscape layouts or furniture arrangement plans easily. You can start from altering templates, and you won’t even notice how your designing skills would improve rapidly.
This private country house and landscape plan was created using ConceptDraw Floor Plans solution. Its power set of libraries containing near 700 vector graphic elements enhanced with handy templates is designed, so that an ordinary people can create professional floor plans. Using the stuff, provided by this solution, you can effortlessly design a plan of house, rooms and even backyard layout and landscape. This will save your time and money.This sample plan represents a detailed plan of the private ownership. It defines the apartments layout, the appointment arrangement and even possible location of plants in the garden.
Picture: How To use House Design Software
Related Solution:
ConceptDraw software has been developed for drawing any type of flowchart. Use RapidDraw - thi is flowchart maker technology for adding new objects to a flowchart quickly. This is technology of fast drawing technique focused on making great-looking flowcharts quickly. To get started using it download flowchart maker ConceptDraw DIAGRAM.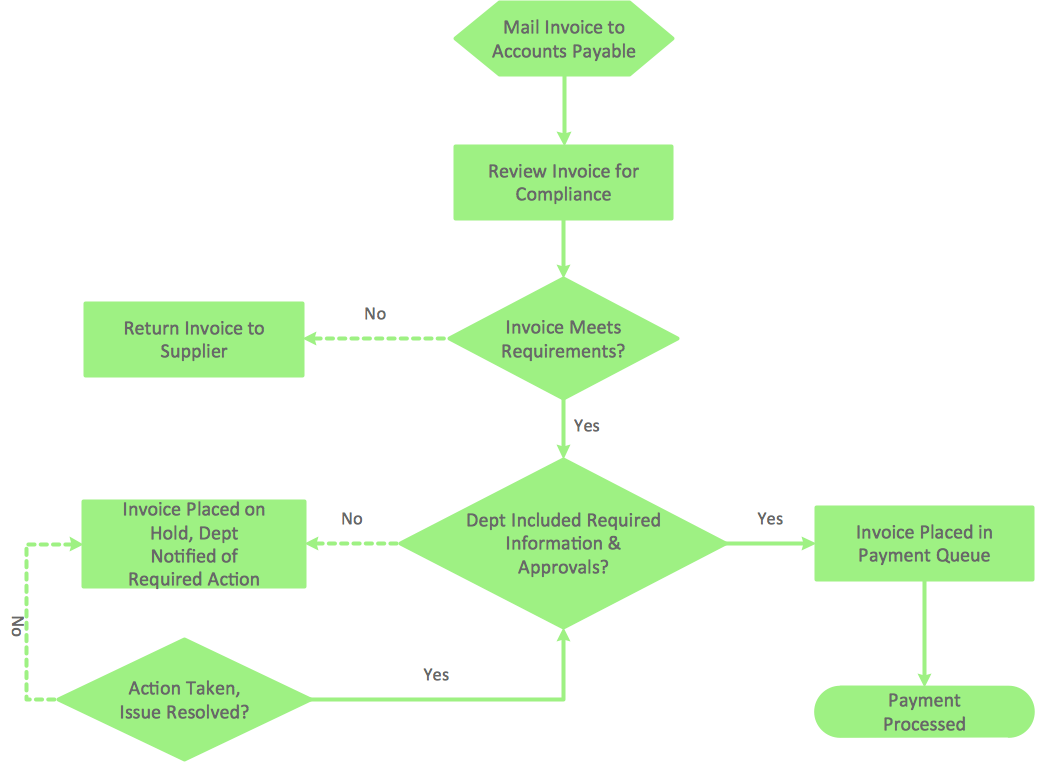
Picture: Flowchart Program Mac
Related Solution:
Wiring and circuit diagrams use special symbols recognized by everyone who uses the drawings. The symbols on the drawings show how components like resistors, capacitors, inductors, switches, lamps, acoustic devices, measuring devices and other electrical and electronic components are connected together.
26 libraries of the Electrical Engineering Solution of ConceptDraw DIAGRAM make your electrical diagramming simple, efficient, and effective. You can simply and quickly drop the ready-to-use objects from libraries into your document to create the electrical diagram.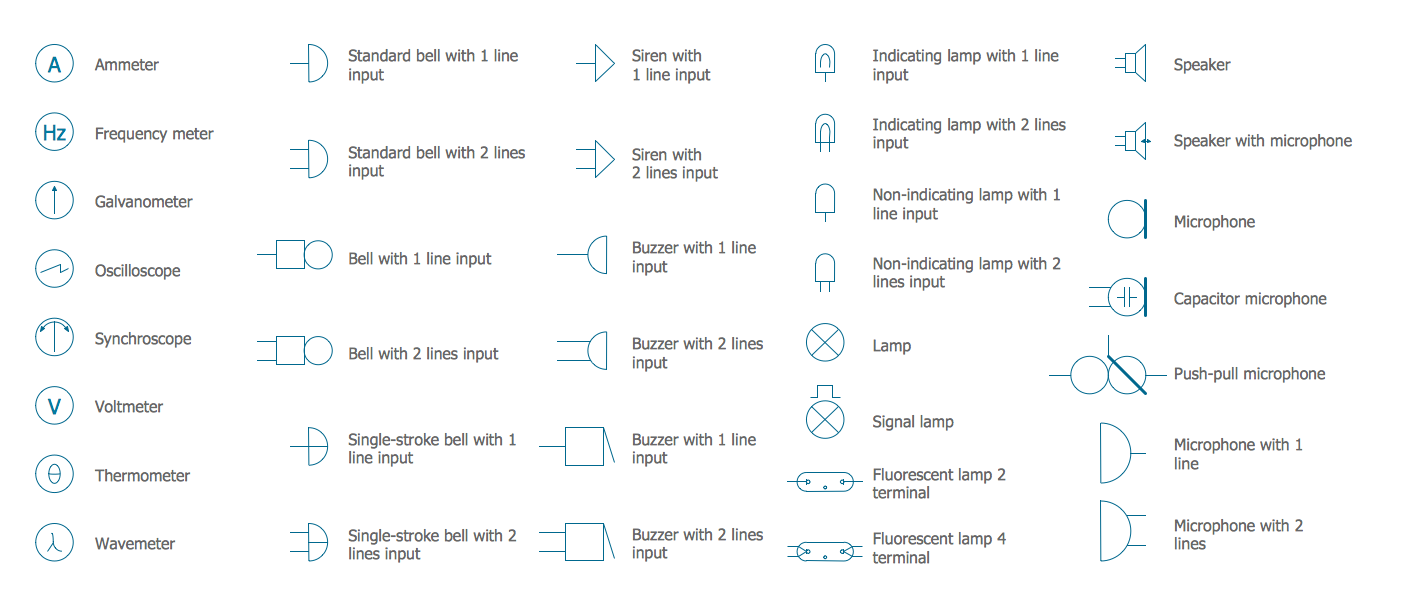
Picture: Electrical Symbols — Lamps, Acoustics, Readouts
Related Solution:
A waterfall model describes software development process as a sequence of phases that flow downwards. SSADM is one of the implementations of waterfall method. It’s easier to learn about structured systems analysis and design method (SSADM) with ConceptDraw DIAGRAM because this software has appropriate tools for creating data flow diagrams. You can use all the three main techniques of SSADM method with special tools and predesigned templates.
This data flow diagram illustrates the Structured Systems Analysis and Design Method. This method method considers analysis, projecting and documenting of information systems. Data flow models are the most important elements of SSADM and data flow diagrams are usually used for their description. It includes the analysis and description of a system as well as visualization of possible issues.
Picture: Structured Systems Analysis and Design Method. SSADM with ConceptDraw DIAGRAM
Related Solution:
Teams working with Scrum methodology use the product backlog items (PBIs), bug work item types (WITs), reports and dashboards. SCRUM Workflow solution for ConceptDraw DIAGRAM software offers collection of samples, variety of predesigned objects, clipart and graphic elements, a set of Scrum process work items and workflow which are developed for agile teams working using Scrum.
Picture: Scrum process work items and workflow
Related Solution:
This example shows the OOSE method. It was created in ConceptDraw DIAGRAM diagramming and vector drawing software using the Rapid UML Solution from the Software Development area of ConceptDraw Solution Park.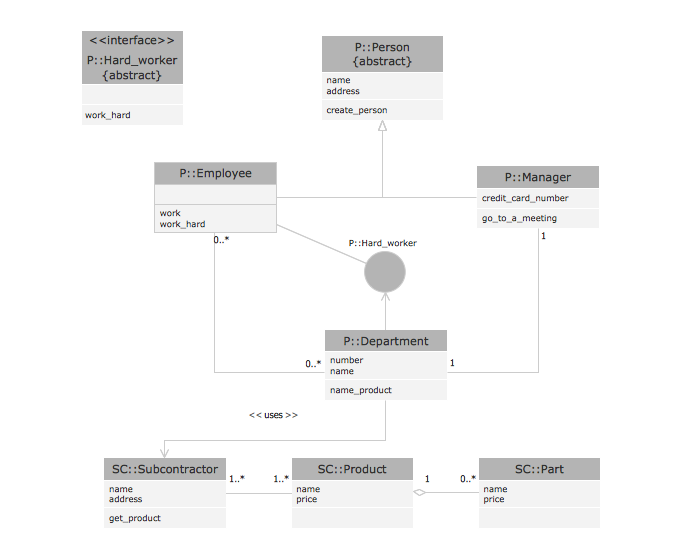
Picture: Examples for OOSE Method
Related Solution:
This diagram represents the electrical floor plan. This is a common practice - to draw the electrical plan on the floor plan. The outlets, fixtures and other electrical equipment are depicted on the floor plan with special symbols. This drawing was created using the possibilities of ConceptDraw DIAGRAM as CAD software. Computer-aided design software is intended to replaces manual engineering drafting with an automated process. CAD software is used by engineers, architects, and others to make high-precision technical drawings and illustrations. CAD software allows technical specialists to develop, examine and manage various engineering projects.
It is almost impossible nowadays to imagine mechanical engineering without digital technologies. Finding a suitable CAD software for creating mechanic diagram and electrical diagram architectural designs can take a lot of time and effort. However, with ConceptDraw DIAGRAM you can create any diagram that you want and later convert it to the most popular graphic formats like.vsdx,.png,.pptx etc.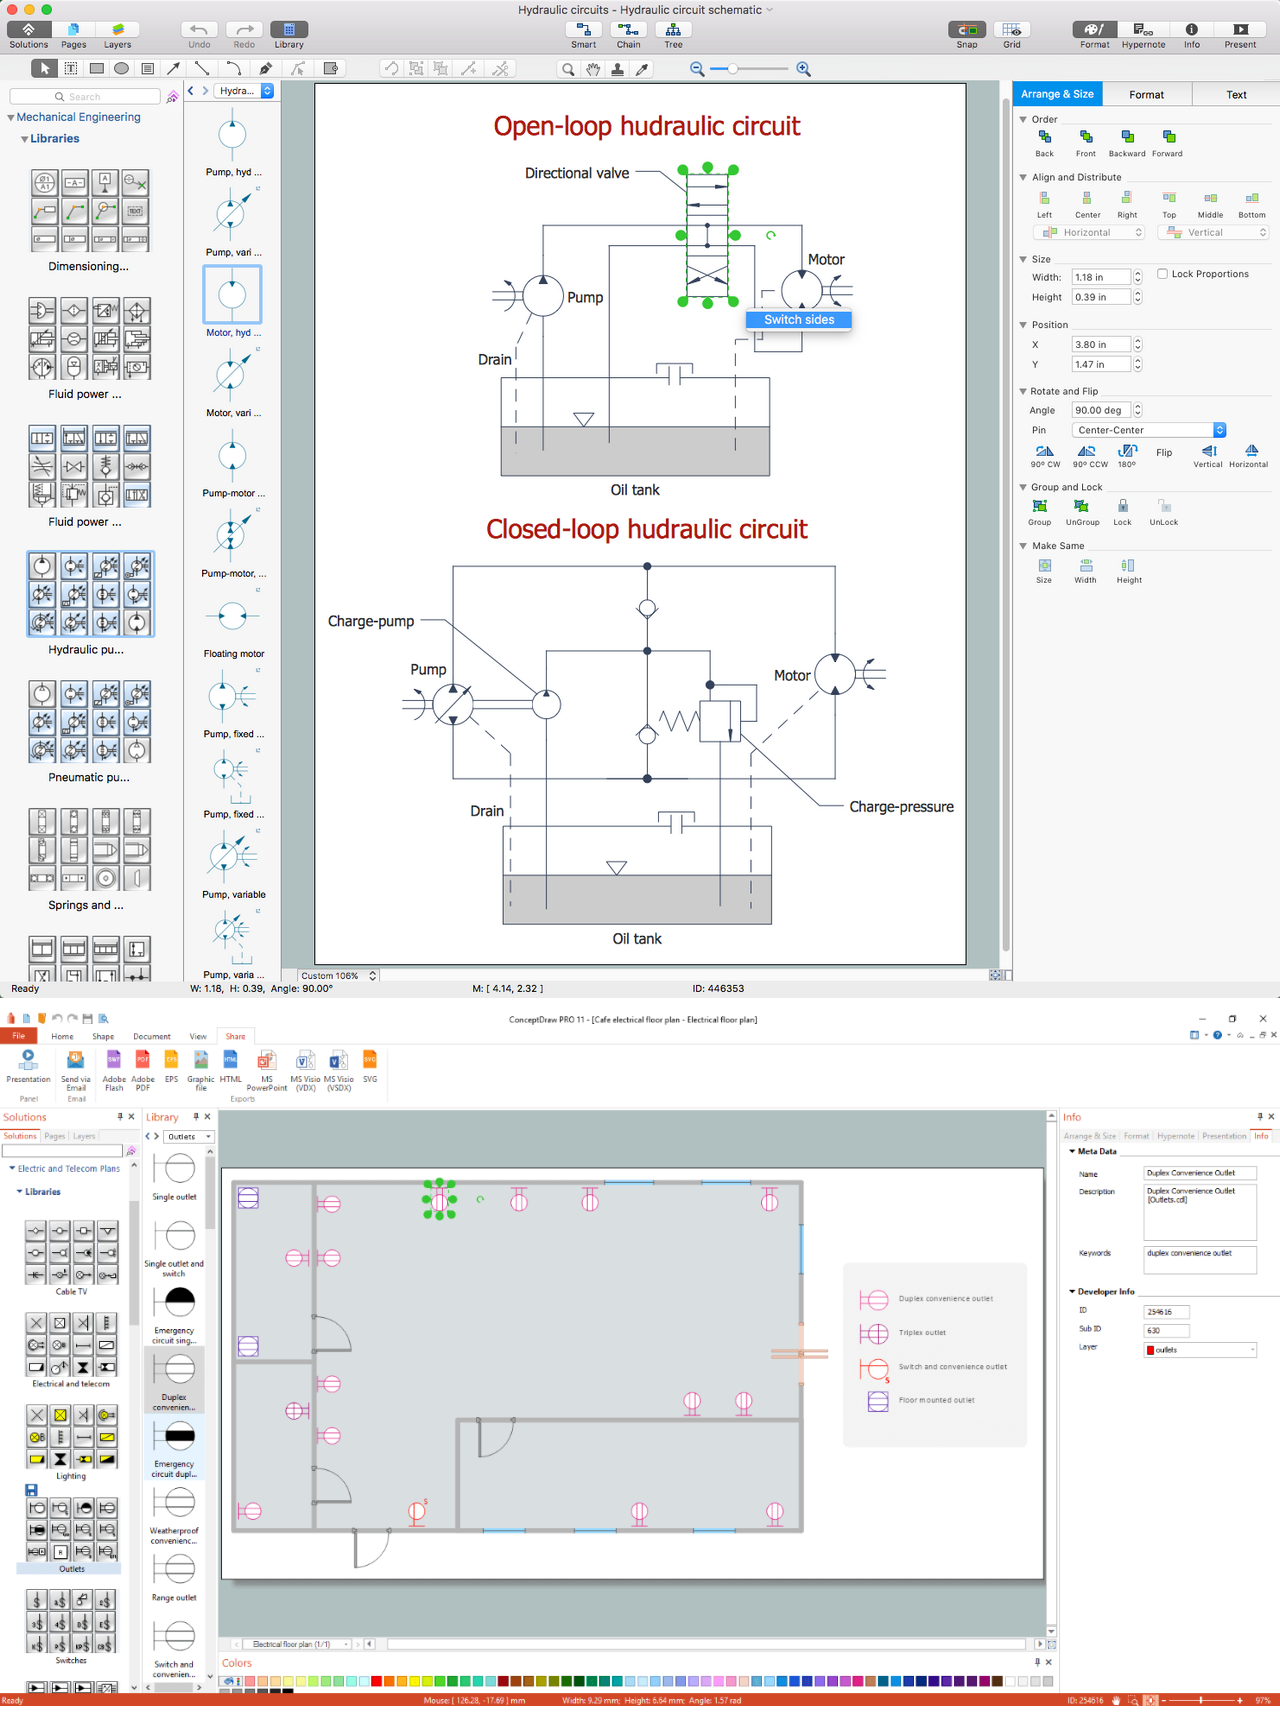
Picture: CAD Drawing Software for Making Mechanic Diagram and Electrical Diagram Architectural Designs
Related Solution:
When thinking about data visualization, one of the first tools that comes to mind is a flowchart design. You can find flowchart symbols, shapes, stencils and icons easily on the Internet, but it might take time to systematize this information. Nevertheless, once you start flowcharting, you’ll love its simplicity and efficiency.
This diagram consists from standard flowchart symbols, approved by ANSI (American National Standard Institute) for drawing flowcharts. A flowchart is a diagram that represents a step-by-step algorithm of any process, displaying the process stages as boxes that are connected with arrows. Flowchart design makes it clear and readable.
Flowchart designed using ConceptDraw DIAGRAM flowchart software allows to make attractive and clear process presentation, it makes interpretation of the business process flow fresh and versatile. Great flowchart design view is a big advantage over the diagram created manually on a paper.
Picture: Flowchart Design: Principles, Layout, Symbols and Best Practices
Related Solution:

