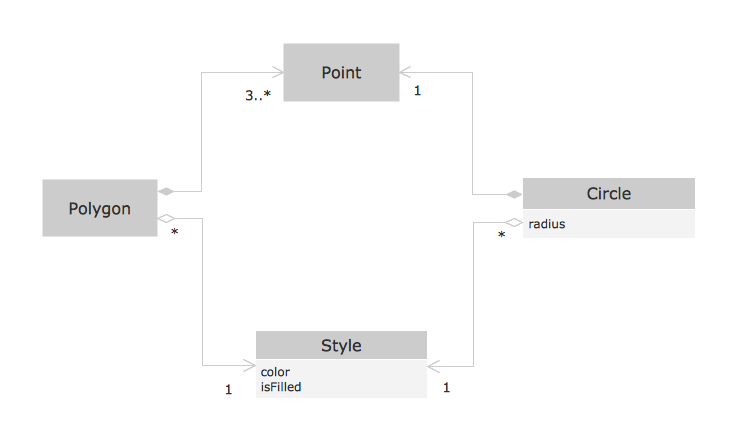
Pic. 1. OOSE method example.
This sample shows the OOSE diagram with aggregation and composition associations.
Using the Rapid UML Solution for ConceptDraw DIAGRAM you can create your own professional OOSE Diagrams quick and easy.
The OOSE diagrams produced with ConceptDraw DIAGRAM are vector graphic documents and are available for reviewing, modifying, and converting to a variety of formats (image, HTML, PDF file, MS PowerPoint Presentation, Adobe Flash or MS Visio).
SEVEN RELATED HOW TO's:
IT world is extremely rational and logical. So what can be more precise than Software Diagrams to rate the results of work? Visual statistics is the best way to understand the data.
This figure demonstrates the data flow diagram (DFD), which was created to describe the electronic system of custom purchase. This is the process of buying using electronic bar code scanning system. Such systems are used in large stores. The cashier scans the bar code, the system outputs the data on the price of the goods and carries out a purchase process. This DFD utilizes the Gane/Sarson notation. To create it The ConceptDraw DFD solution has been applied.
Picture: Software Diagrams
The vector stencils library UML Use Case contains specific symbols of the UML notation such as actors, actions, associations and relationships for the ConceptDraw DIAGRAM diagramming and vector drawing software.
Picture: Jacobson Use Cases Diagram
Related Solution:
This sample shows the Booch OOD diagram of the environment. The Booch method (developed by Grady Booch) is an object modeling language and methodology used in software engineering.
This sample was created in ConceptDraw DIAGRAM diagramming and vector drawing software using the Rapid UML Solution from the Software Development area of ConceptDraw Solution Park.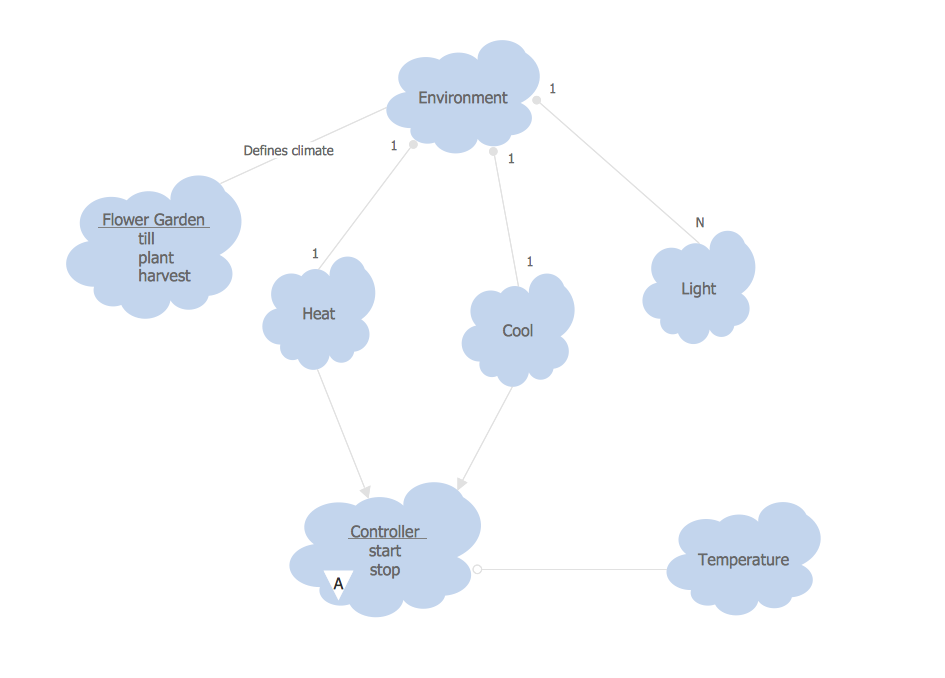
Picture: Object-Oriented Development (OOD) Method
Related Solution:
This example shows the OOSE method. It was created in ConceptDraw DIAGRAM diagramming and vector drawing software using the Rapid UML Solution from the Software Development area of ConceptDraw Solution Park.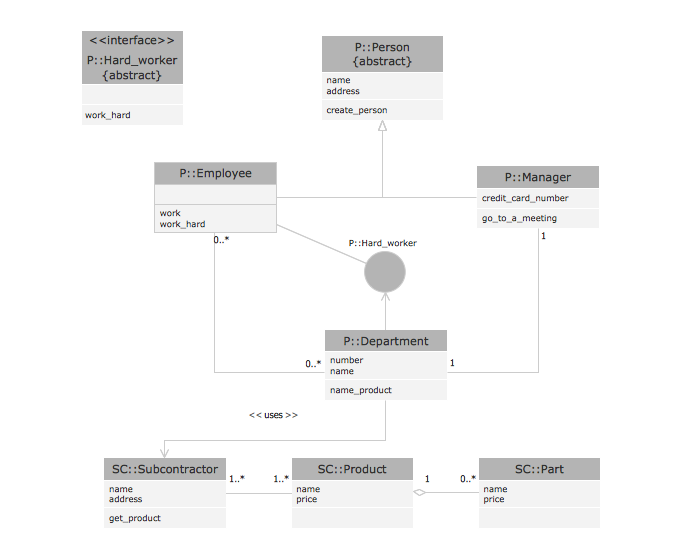
Picture: Examples for OOSE Method
Related Solution:
The UML diagram is a powerful tool which lets visually represent all system's components, the interactions between them and relationships with external user interface.
The Rapid UML solution for ConceptDraw DIAGRAM software offers diversity of UML flowchart symbols for drawing all types of UML diagrams.
Picture: UML Flowchart Symbols
Related Solution:
The first thing that usually comes to mind when talking about database models is ER-diagrams, and the ways to create them. The second most recognizable notation is the Crow’s Foot, which visually differs from Chen’s notation. Actually, it doesn’t matter which notation you’ll use for your entity relationship diagram (ERD), but the content is what matters.
When designing an Entity-Relationship Diagram one need to use a certain notated symbols that were developed and standardized especially for databases description. First of them - the Chen’s notation had a linguistic origin. It includes rectangle boxes to show entities that may be described as nouns, and the relationships between them described as verbs depicted in a form of diamond. Finally the Chen’s notation was simplified up to the Crow’s Foot notation. It represents a relationship as labeled line. It is precisely this notation is shown in the given figure. ConceptDraw DIAGRAM together with its Entity-Relationship Diagram (ERD) solution is designed to support professionals who deals with creating ER diagrams using the element of both - Chen’s and Crow's Foot notations.
Picture: Design Element: Crows Foot for Entity Relationship Diagram - ERD
Related Solution:
While designing a conceptual data model, you should use appropriate software. For instance, ConceptDraw DIAGRAM is a user-friendly ER diagram tool that has a lot of samples and templates to facilitate your work. A clear entity-relationship diagram helps to define the relations between system’s components.
Software engineering is the section of a computer science engaged to design, realization, and support of complex software products. An ERD is a data modeling method that is widely applied in the software engineering practice. Commonly it is used for developing a structure of a a relational database. An entity relationship diagram is helpful for structuring and organizing databases that can be modeled using a relational structure. An entity relationship diagram is designed to depicts the interrelationships within the sets of entities which are accumulated in the database. Each entity represents a particular component of a data. Thus, ER diagrams depicts the logical structure of databases. ConceptDraw ER Diagrams solution provides software engineers with the professional tool for making entity-relationship diagrams.
Picture: Entity Relationship Diagram Software Engineering
Related Solution: