
Example 1. Design Elements — Crow's Foot (Mac OS X, Windows) for Entity Relationship Diagrams
The Entity-Relationship Diagram (ERD) solution offers also a lot of samples of ER Diagrams of Crow's Foot and also Chen's notations, and two templates providing useful quick start. All they are professional looking, stylish and attractive and are proposed for using from ConceptDraw STORE.

Example 2. Entity Relationship Diagrams solution, examples and template
The samples you see on this page were created in ConceptDraw DIAGRAM software using the Entity-Relationship Diagram (ERD) solution and show the ER Diagrams created with Crow's Foot notation. An experienced user spent 10 minutes creating these samples.
Use the Entity-Relationship Diagram (ERD) Solution for ConceptDraw DIAGRAM to create quick and easy your own ERDs using the Crow's Foot and Chen's notations.
All source documents are vector graphic documents. They are available for reviewing, modifying, or converting to a variety of formats (PDF file, MS PowerPoint, MS Visio, and many other graphic formats) from the ConceptDraw STORE. The Entity-Relationship Diagram (ERD) Solution is available for all ConceptDraw DIAGRAM or later users.
TEN RELATED HOW TO's:
ConceptDraw DIAGRAM is a powerful tool for drawing business communication ideas and concepts, simple visual presentation of numerical data in the Mac environment.
Picture: Best Multi-Platform Diagram Software
Related Solution:
The entity–relationship (ER) model is a data model that lets graphically represent the information system and depict the relationships between people, objects, concepts, places, and events within a given system. It is also convenient to use the ER Diagram for Cloud computing representation and description the Cloud computing architecture, design them with pleasure using the extensive tools of the Cloud Computing Diagrams solution from the Computers and Network area of ConceptDraw Solution Park.
Picture: ER Diagram for Cloud Computing
Related Solution:
UML Deployment diagram describes the hardware used in system implementations and the execution environments and artifacts deployed on the hardware.
ConceptDraw has 393 vector stencils in the 13 libraries that helps you to start using software for designing your own UML Diagrams. You can use the appropriate stencils of UML notation from UML Deployment library.
Picture: UML Deployment Diagram. Design Elements
Related Solution:
ConceptDraw DIAGRAM extended with IDEF Business Process Diagrams solution from the Business Processes area of ConceptDraw Solution Park is an ideal software for effective database design and drawing IDEF diagrams visually representing all steps of database design process.
Picture: Database Design
Related Solution:
The Nature Solution addition to ConceptDraw Solution Park for ConceptDraw DIAGRAM includes new libraries that provide a wide range nature objects and it can be used to augment documentation and graphics. Draw beautiful nature scenes using ConceptDraw DIAGRAM software with Nature solution.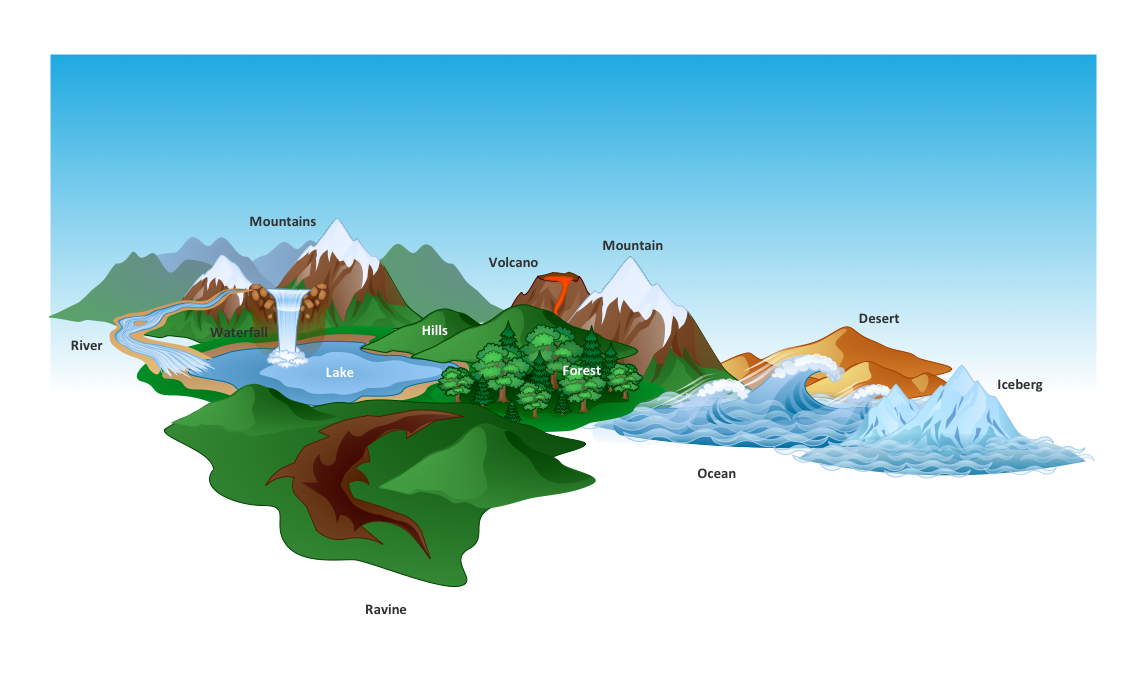
Picture: Beautiful Nature Scene: Drawing
When thinking about data visualization, one of the first tools that comes to mind is a flowchart design. You can find flowchart symbols, shapes, stencils and icons easily on the Internet, but it might take time to systematize this information. Nevertheless, once you start flowcharting, you’ll love its simplicity and efficiency.
This diagram consists from standard flowchart symbols, approved by ANSI (American National Standard Institute) for drawing flowcharts. A flowchart is a diagram that represents a step-by-step algorithm of any process, displaying the process stages as boxes that are connected with arrows. Flowchart design makes it clear and readable.
Flowchart designed using ConceptDraw DIAGRAM flowchart software allows to make attractive and clear process presentation, it makes interpretation of the business process flow fresh and versatile. Great flowchart design view is a big advantage over the diagram created manually on a paper.
Picture: Flowchart Design: Principles, Layout, Symbols and Best Practices
Related Solution:
Electrical maintenance - troubleshooting electrical circuit.
The diagrams are a big help when workers try to find out why a circuit does not work correctly.
26 libraries of the Electrical Engineering Solution of ConceptDraw DIAGRAM make your electrical diagramming simple, efficient, and effective. You can simply and quickly drop the ready-to-use objects from libraries into your document to create the electrical diagram.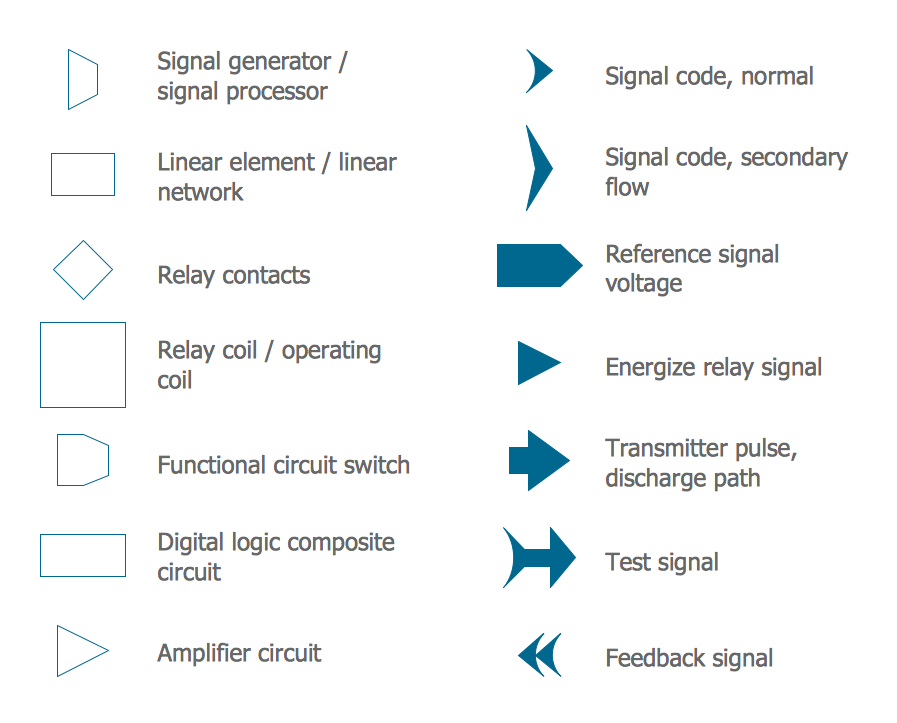
Picture: Electrical Symbols — Maintenance
Related Solution:
This sample represents the actors, use cases and dependencies between them, and also the relationships between use cases. There are used dependency and use case generalization associations on this UML diagram. Use case generalization is used when you have two similar use cases, but one of them does more than another.
This sample shows the work of the Financial Trade sphere and can be used by trading companies, commercial organizations, traders, different exchanges.
Picture: Financial Trade UML Use Case Diagram Example
Diagrams are a very important part of modern life. With the help of flow diagram software, a lot of companies can promote their ideas at the market. Its usefulness is totally doubtless.
This is a flow chart of the invoice payment flow. This flowchart details decrypts all stages of the process of obtaining and paying bills. It is a description of the universal process - such steps performs accounting departments of almost any organization. Since every business no matter what it does is a consumer of some goods or services. The given flow chart was made using ConceptDraw DIAGRAM software and the Diagrams solution for making flowcharts of any kind.
Picture: Flow Diagram Software
Related Solution:
ERD drawing becomes easier with predesigned entity relationship symbols, work flow shapes, entity relationship stencils. All variety of ERD symbols you may need for ERDs design is packed into libraries and templates from Entity-Relationship Diagram (ERD) Solution for ConceptDraw DIAGRAM diagramming and vector drawing software.
But anyone have an ERD symbols quick reference? Detailed reference information for them is represented at the tables.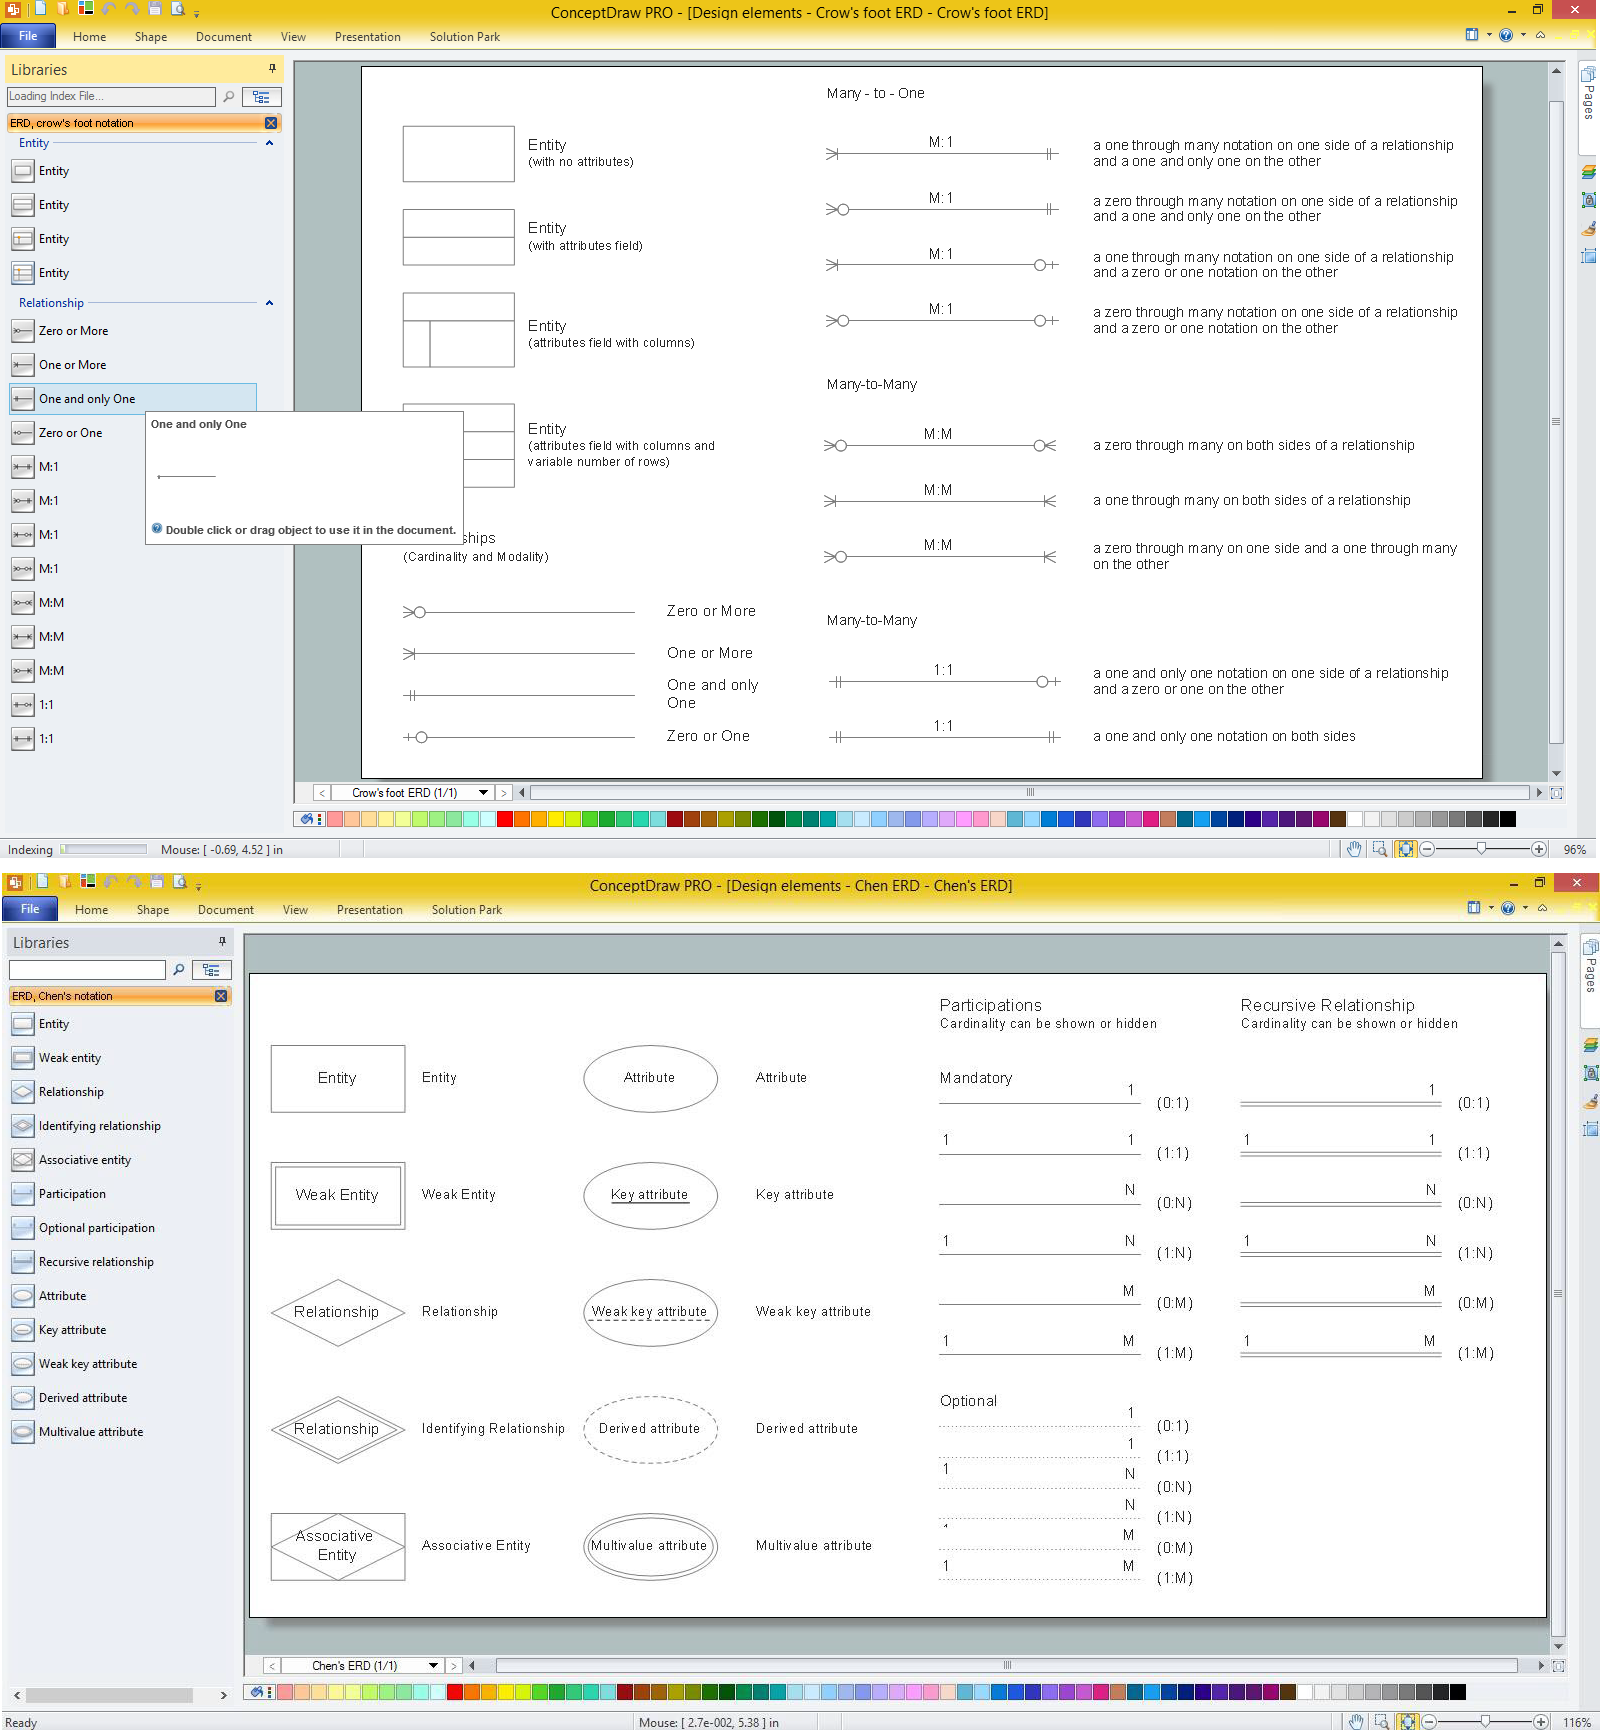
Picture: Anyone Have an ERD Symbols Quick Reference?
Related Solution:
