Design Data Flow. DFD Library
Data Flow Diagram (DFD) notationsData processing is a process of manipulation after collection the items of data for producing the meaningful information, being considered as a subset of information processing. Any processing of information in any manner can be done by an observer. Within an organization, there are usually particular departments responsible for all the operation of data processing process. There are different kinds of data processing, such as a “commercial data processing”, which involves a large volume of input data, only a few computational operations and lots of output. An example of commercial data processing can be the processes within a logistics company of keeping the records on hundreds of thousands of shipping documents, printing and mailing all the existing bills to the clients, as well as receiving the payments from them. For engineering or science, the both terms “information systems” as well as “data processing” are known to be very broad. Thus, more often the specialized term data analysis is usually used. Within the “data analysis” term the precise and specialized algorithms are used, as well as the statistical calculations which can be sometimes observed in a typical business environment. To describe the data processing in a way of a drawing, you can always create a so-called “data flow diagram”, which is basically a graphical representation of the "flow" of data”. The flow of data described in a way of such illustration is represented as the one going through an information system, modelling its process aspects. The data flow diagrams are often used as a first step in order to create an overview of the system in general, not going into many details, as well as for the visualization of some data processing (commonly used in the structured design). Making a data flow diagram means showing what kind of information can be input to as well as output from the system, in what way the data can advance through the system, and where this data can be stored. No data flow diagram shows the information about the process timing itself or if such processes can operate in a sequence or being parallel to each other, but it is still very commonly used for describing the processes in general. There are a few data flow diagrams which are used most of all and they are logical and physical ones. The logical data flow diagrams are used for capturing the data flows – those, which are important for a system to keep in order to be able to operate in a proper way. All data flow diagrams are expected to be describing the undertaken processes. After data being produced by each of the processes taking place within some particular organization, the stores are expected to hold this data. But any physical data flow diagram shows the way the system is implemented itself. There are a few different kinds of physical data flow diagrams, such as Current Physical ones, describing the data at this very moment, and Required Physical ones, illustrating the way the designer wants the data to be looking in the future. Any Physical data flow diagram is widely used for describing the set of data items which appear on each of the pieces of paper moving around an office. At the same time, any Logical data flow diagram is known to be attempting in order to capture the data flow aspects of some particular system in a certain form not having any duplication and any redundancy. Another name for data flow diagrams is “bubble charts”. Basically, the data flow diagrams are used as a designing tool in the top-down approach to the “Systems Design”. There is a so-called “context-level data flow diagram” used for producing a Level 1 data flow diagrams – the ones used for showing some particular details of the system, which is known to be modelled. Any Level 1 data flow diagram is used for showing the way some particular system is divided into the so-called “sub-systems”, which are also known to be called as simply the “processes”. Any of the mentioned sub-systems is known to be dealing with one or more than one data flows going to or from some external agent. All the sub-systems together provide all the needed functionality of the system as a whole. Identifying the internal data stores which are expected to be present for the system to do its job, the data flow diagrams are one of the best tools for completing this task. But the most important reason of using the data flow diagrams is to show the flow of data between the various parts of the system, so it is obvious to notice the connection between them and so the relationships between them. Having a data flow diagram, all the users can visualize the way the system operates or will operate in the future, how this system will be implemented and what this system will accomplish. The usage of the Data flow diagrams can be also for a reason of providing the end users with a physical idea of where exactly the data they input has an effect upon the whole structure of the system, beginning from the first stage of order of the goods, for example, all the way up to the final stage of the reporting. Using a data flow diagram model, you can always represent the way how any developed system can be determined, forcing addressing the way how this system may be decomposed into the component sub-systems, as well as identifying the transaction data in a particular data model. Used in both the Design phases of the SDLC and in Analysis, Data flow diagrams can be created in ConceptDraw DIAGRAM diagramming and drawing software with an ease. Especially having the Data Flow Diagrams solution downloaded from another product of CS Odessa — ConceptDraw STORE — developed especially for a reason of providing all the ConceptDraw DIAGRAM users with the tools for making the mentioned diagrams, as well as the other ones. Thus, using different notations, such as “Gane and Sarson”, and “Yourdon and Coad” ones, in order to draw a data flow diagram for defining different visual representations of the data stores, the processes, the data flow, as well as the external entities, you can complete your task of creating the professionally looking diagrams within only an hour or even less, depending on how good you are at using ConceptDraw DIAGRAM application already. Pic 1. ConceptDraw Software for Design Data Flow The design elements library "Data flow diagram (DFD)" contains 15 symbols for drawing both context-level data flow diagram and Level 1 DFD:
 Pic 2. Design Data Flow — DFD Symbols The design elements library "DFD, Gane-Sarson notation contains 12 symbols of Gane-Sarson DFD notation. The design elements library "DFD, Yourdon and Coad notation contains 22 symbols of Yourdon/DeMarco DFD notation. Gane-Sarson notation:
 Pic 3. Design Data Flow — Gane-Sarson notation symbols Yourdon and Coad notation:
 Pic 4. Design Data Flow — Yourdon and Coad notation symbols Use these DFD symbol libraries to design the process-oriented models, data-oriented models, data flowcharts, data process diagrams, structured analysis diagrams, and information flow diagrams. |

Pic 5. Design Data Flow. DFD Library
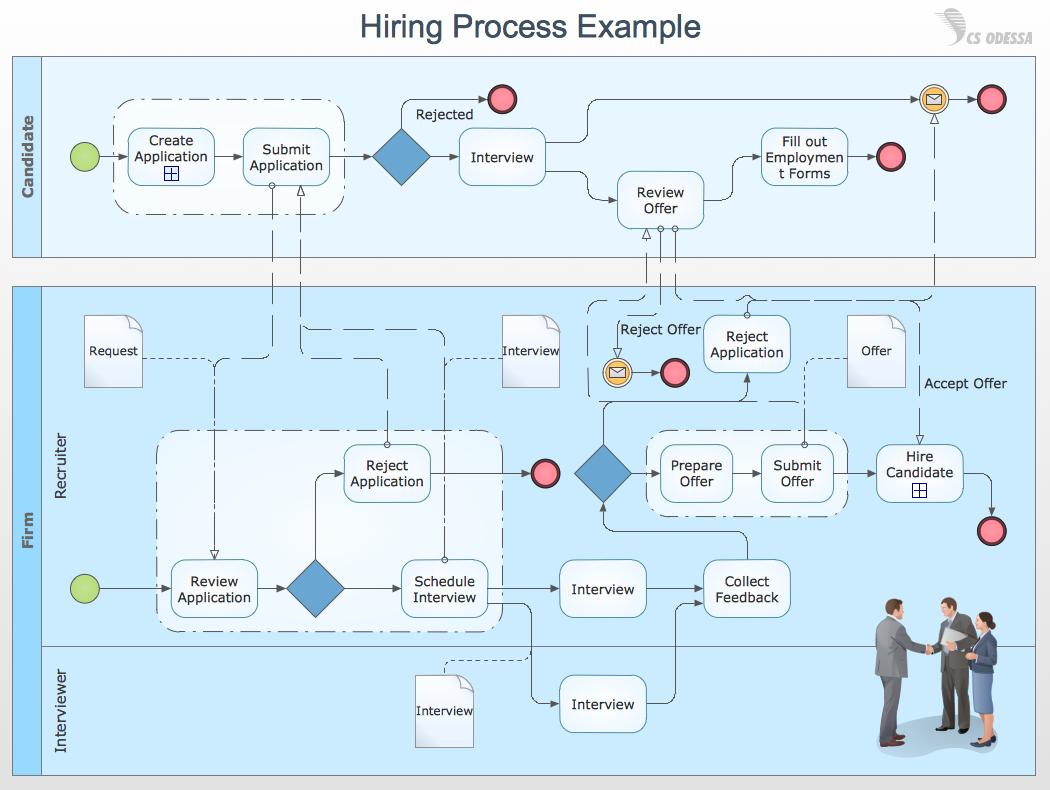
Data Flow Diagrams Sample:


_Win_Mac.png)