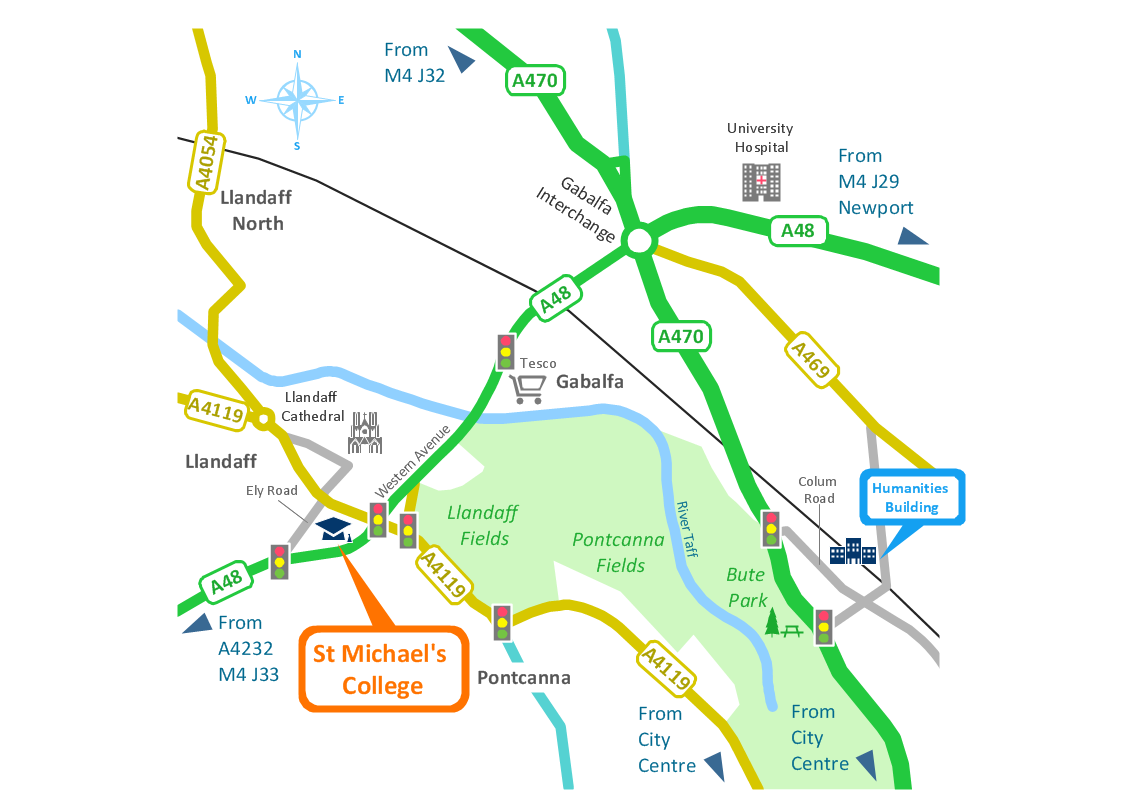
Sample 1. Conference centre - Location map.
Solution Spatial Infographics from ConceptDraw Solution Park extends ConceptDraw DIAGRAM ector diagramming and business graphics software with easy-to-use spatial infographics drawing tools.
This solution contains spatial infographics samples, map templates to be filled in, and libraries of vector stencils for main design elements of spatial infographics.
Use this solution to draw your own geospatial infographics documents with thematic maps, road maps, directional maps and transport maps.
TEN RELATED HOW TO's:
A Data Flow Diagram (DFD) is a graphical technique which allows effectively model and analyze the information processes and systems. The ability to fast and easy create the DFDs is made possible with Data Flow Diagrams solution from the Software Development area of ConceptDraw Solution Park. For designing the Data Flow Diagrams are used simple DFD flowchart symbols which are connected each other by arrows depicting the data flow from one step to another.
Picture: DFD Flowchart Symbols
Related Solution:
Business Processes description with ConceptDraw. Business-processes it allows to describe functional blocks, for example production and marketing. ConceptDraw lets creation of business processes description using IDEF0 and IDEF2 methods.
Picture: Business Processes description with ConceptDraw DIAGRAM
Related Solution:
The diagrams with highest level in the hierarchy define the main processes or subsystems with external and internal data sources. To detail them, DFD Library is used to build a system of lower level diagrams. This decomposition continues hereinafter it is meaningless.
This data flow diagram of a system of a library management is a context-level DFD. The data flow diagram of this type depicts the large system as a solid process, and does not input any explanation of its content. It is an ordinary practice - creation of a context-level data flow diagram when starting system development. This DFD was made using ConceptDraw solution designed especially for data flow diagrams development. One can find out Data Flow Diagrams Solution in a Solution Park of ConceptDraw and can use in as addition to the common Conceptdraw DIAGRAM diagramming tools.
Picture: DFD Library System
Related Solution:
The vector stencils library United Kingdom contains contours for ConceptDraw DIAGRAM diagramming and vector drawing software. This library is contained in the Continent Maps solution from Maps area of ConceptDraw Solution Park.
Picture: Geo Map - Europe - United Kingdom
Related Solution:
ConceptDraw DIAGRAM software is a great assistant in electrical engineering and electrical design. It is efficient in creating ✔️ complex and simple electrical designs, ✔️ power generation, transmission, and distribution electrical schematics, ✔️ transformers diagrams, ✔️ electrical schematics with transformers
Picture: Electrical Symbols — Transformers and Windings
Related Solution:
Engineering students usually have huge amount of homework. Learning how to develop a technical drawing is one of the necessary skills. Luckily, at the present time, there’s no need to draw it on paper, because there a lot of software tools for it.
This drawing represents the Bearing symbols library, that is the part of the ConceptDraw Mechanical Engineering solution. Bearings are the important components of any movable mechanism. The function of bearing is to align, guide, and support the moving parts in any mechanical construction. Usually they are located between moving and stationary parts, it works as a connection point between them. Using Mechanical Engineering solution and ConceptDraw DIAGRAM one can effortlessly draw engineering diagrams of any complexity.
Picture: Technical Drawing Software
Related Solution:
While creating flowcharts and process flow diagrams, you should use special objects to define different statements, so anyone aware of flowcharts can get your scheme right. There is a short and an extended list of basic flowchart symbols and their meaning. Basic flowchart symbols include terminator objects, rectangles for describing steps of a process, diamonds representing appearing conditions and questions and parallelograms to show incoming data.
This diagram gives a general review of the standard symbols that are used when creating flowcharts and process flow diagrams. The practice of using a set of standard flowchart symbols was admitted in order to make flowcharts and other process flow diagrams created by any person properly understandable by other people. The flowchart symbols depict different kinds of actions and phases in a process. The sequence of the actions, and the relationships between them are shown by special lines and arrows. There are a large number of flowchart symbols. Which of them can be used in the particular diagram depends on its type. For instance, some symbols used in data flow diagrams usually are not used in the process flowcharts. Business process system use exactly these flowchart symbols.
Picture: Flowchart Symbols: Meaning and Examples
Related Solution:
ConceptDraw DIAGRAM diagramming and vector drawing software extended with Business Diagrams Solution from the Management Area is a powerful Bubble Chart Maker.
Picture: Bubble Chart Maker
Related Solution:
ConceptDraw Metro Maps solution is a one-click tool to add stations to the metro map. It lets you control the direction in which you create new stations, change lengths, and add text labels and icons. It contains Lines, Stations, and Landmarks objects.
The Metro Map Solution from the Maps Area uses two ConceptDraw techniques: Replicating Objects and Switching Objects. And the result is a vector graphic document.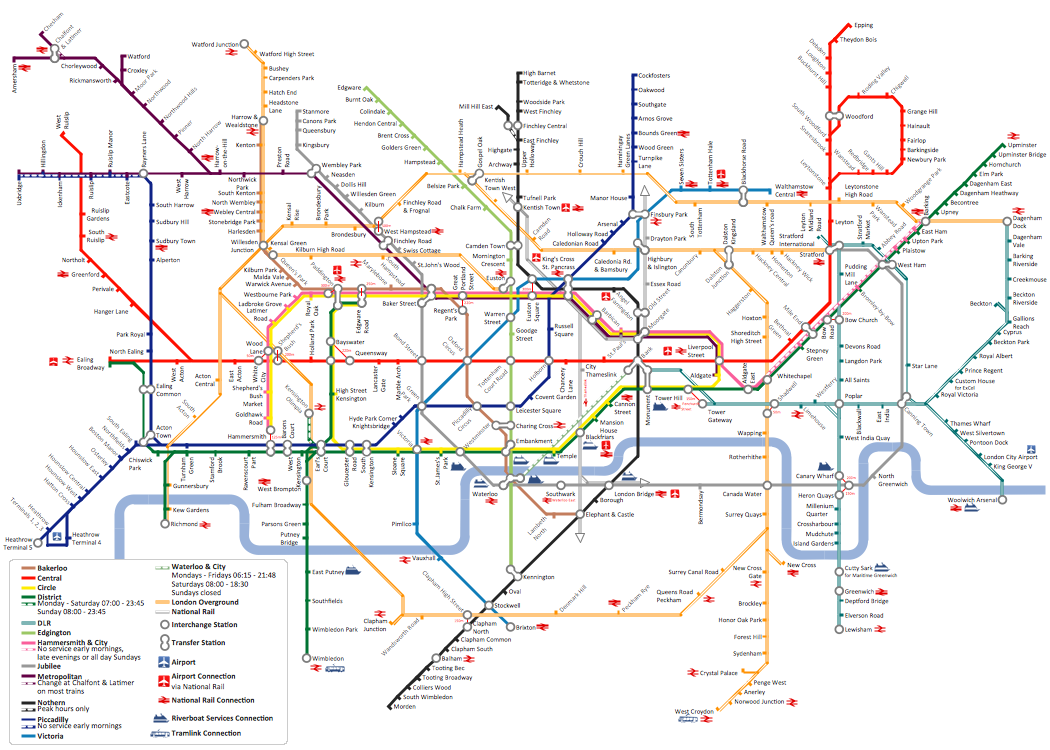
Picture: Metro Map
Related Solution:
The vector stencils library SSADM from the solution Systems engineering contains specific symbols of SSADM diagrams for ConceptDraw DIAGRAM software.
Picture: SSADM Diagram