ER Diagram Programs for Mac
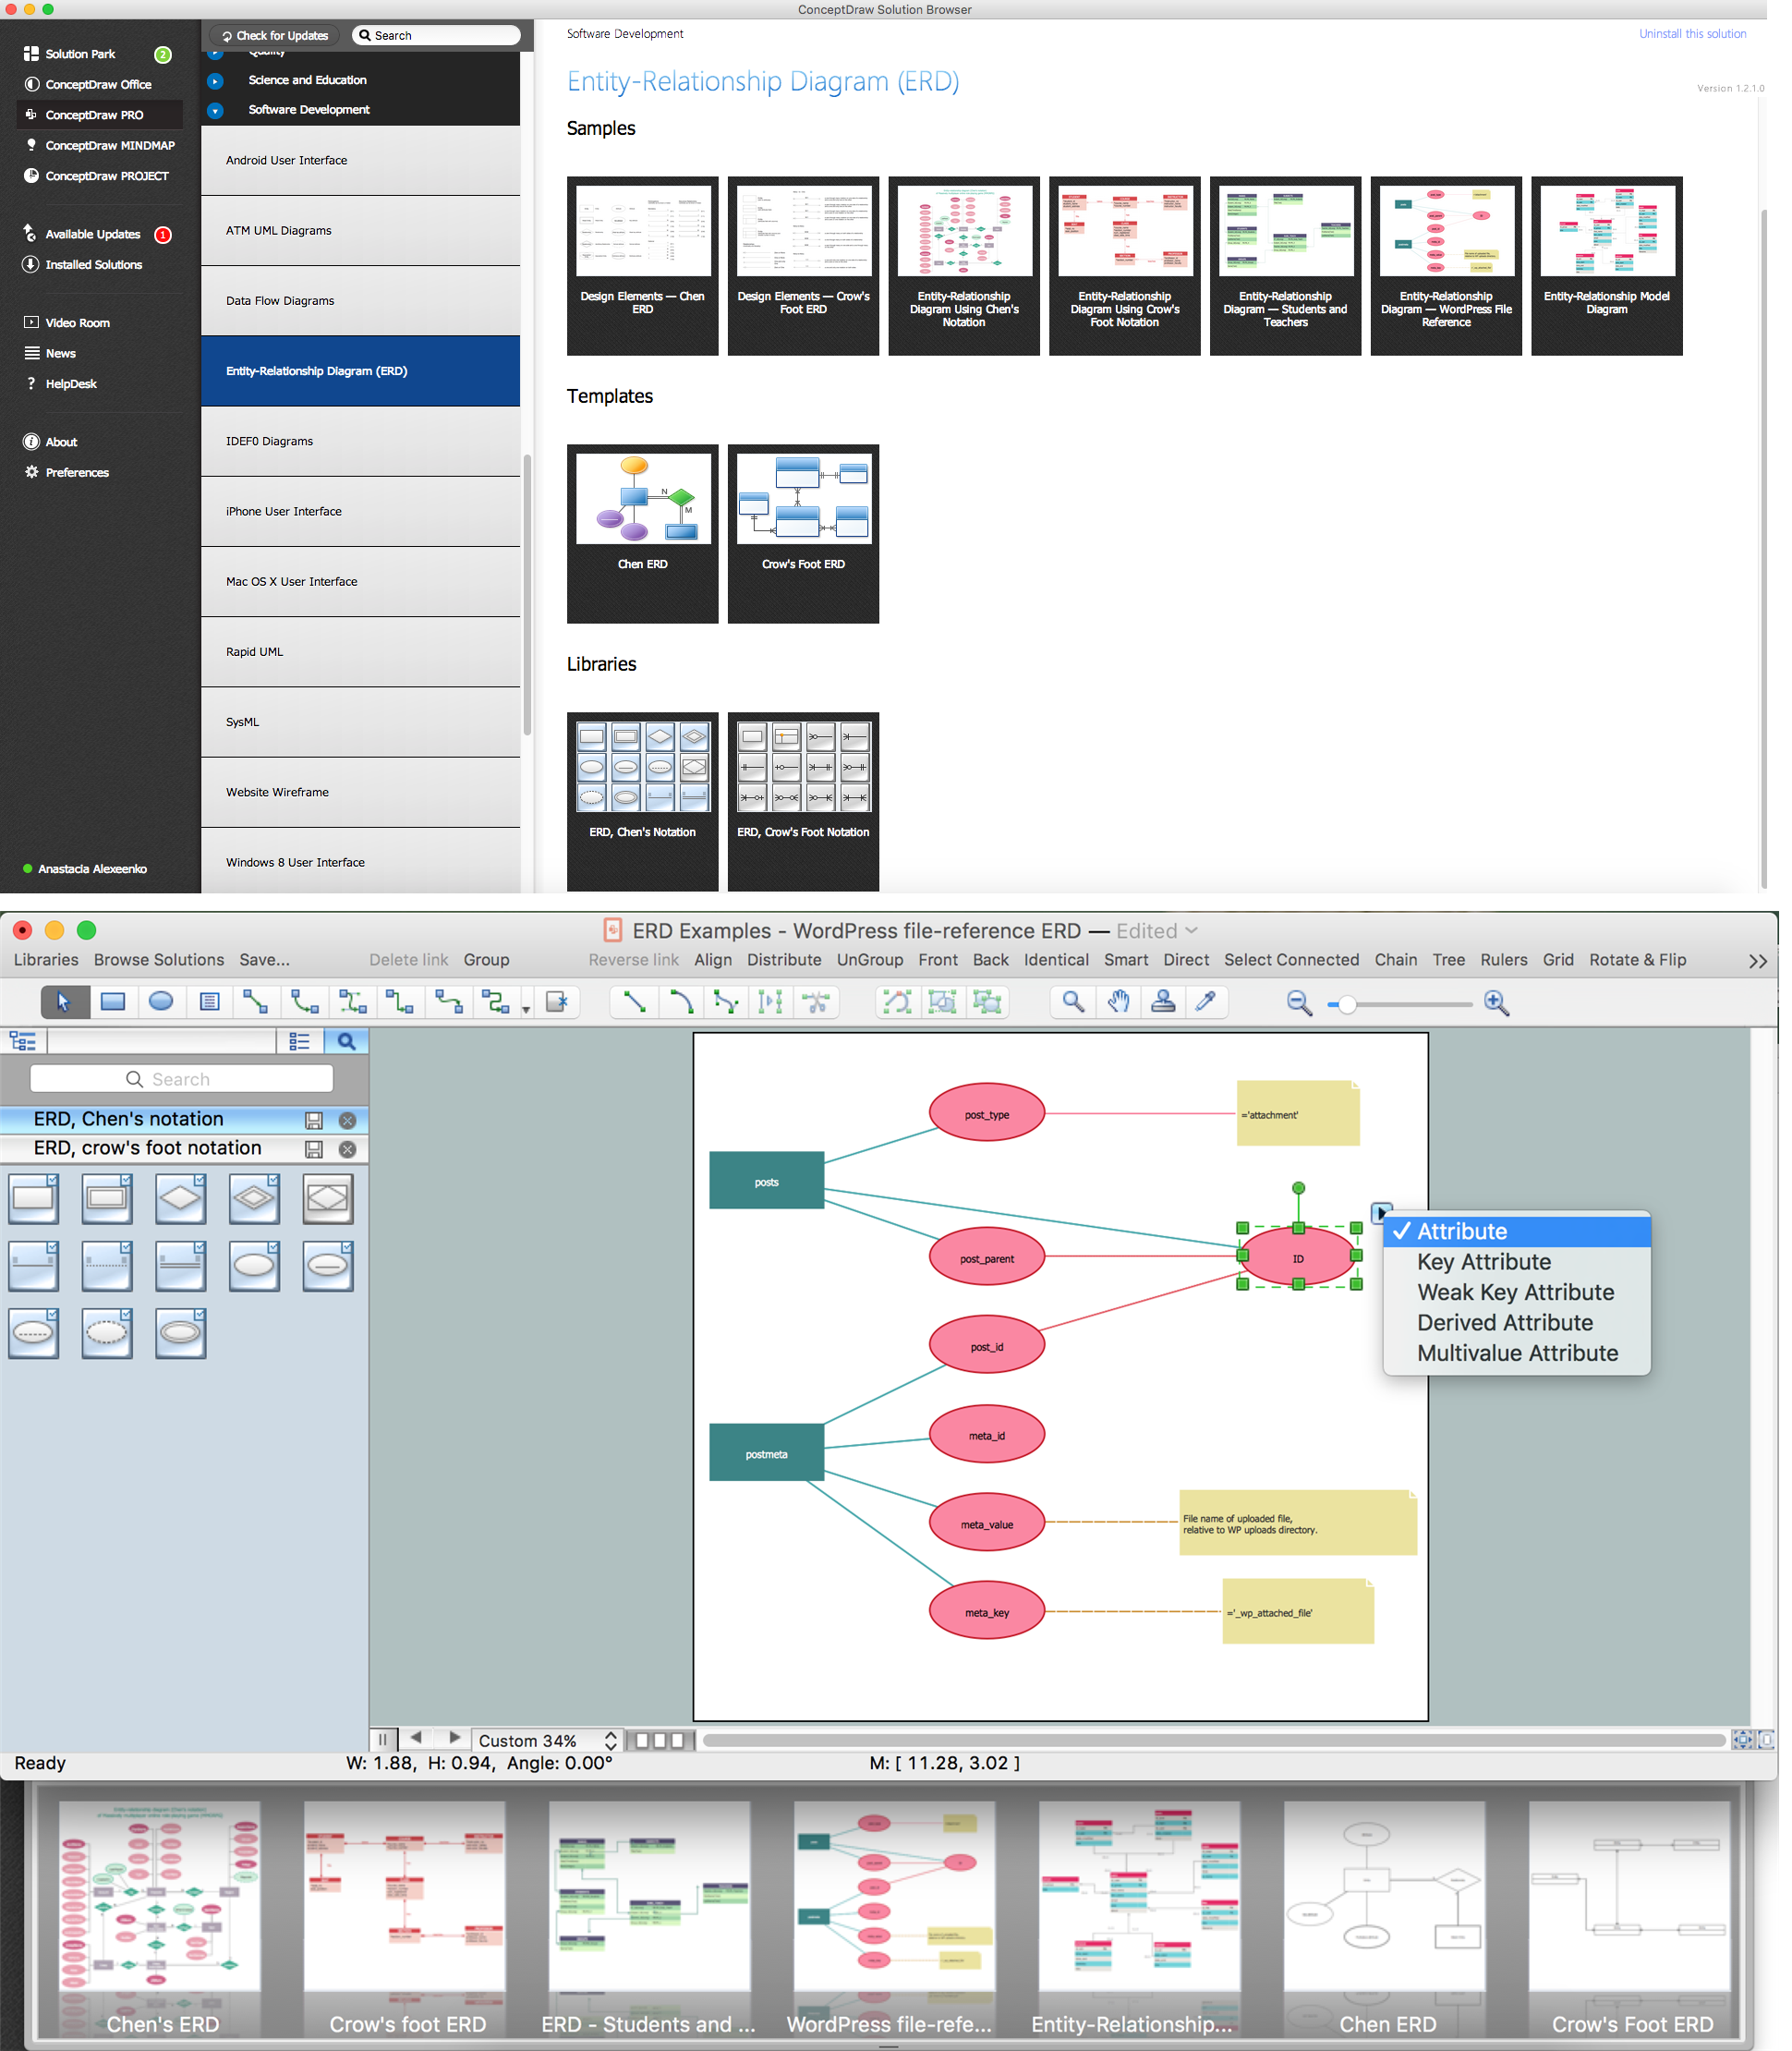
ConceptDraw DIAGRAM compatible Mac OS X software extended with powerful Entity-Relationship Diagram (ERD) Solution from the Software Development Area for ConceptDraw Solution Park is one of the famous ER Diagram Programs for Mac. It gives the perfect ability to draw ER diagrams for visually describing databases with Chen's and Crow's Foot notation icons.

Example 1. ER Diagram Programs for Mac - ConceptDraw DIAGRAM
Entity-Relationship model describes a database by abstract way where the data in database tables can be the point to data in other tables - for instance.
Entity-Relationship Diagram (ERD) solution from ConceptDraw Solution Park extends ConceptDraw DIAGRAM ector graphics and diagramming software with the ability to describe a database using the Entity-Relationship model.

Example 2. ER Diagram symbols - Chen's and Crow's Foots notation
Entity-Relationship Diagram (ERD) solution provides 2 libraries with ready-to-use 45 ERD vector objects and collection of Entity Relationship Diagram templates, examples and samples created using the Chen′s notation and also Crow′s Foot notation.
, Chen's notation")
Example 3. Entity Relationship Diagram (ERD), Chen's notation
Use all this variety to draw your own Entity Relationship Diagrams using Chen's or Crow's foot notations on your Mac and also PC computers.
Example 4. ER Diagram Programs for Mac
The samples you see on this page were created in ConceptDraw DIAGRAM diagramming and vector drawing software using the Entity-Relationship Diagram (ERD) solution. Each of these ER Diagrams is professionally looking and successfully demonstrates solution's capabilities and professional results you can achieve using it.
Use the predesigned objects, templates and samples of the Entity-Relationship Diagram (ERD) solution for ConceptDraw DIAGRAM to create your own professional-looking ERD for Mac quick, easy and effective.
All source documents are vector graphic documents. They are available for reviewing, modifying, or converting to a variety of formats (PDF file, MS PowerPoint, MS Visio, and many other graphic formats) from the ConceptDraw STORE. The Entity-Relationship Diagram (ERD) Solution is available for all ConceptDraw DIAGRAM or later users.
TEN RELATED HOW TO's:
When trying to figure out the nature of the problems occurring within a project, there are many ways to develop such understanding. One of the most common ways to document processes for further improvement is to draw a process flowchart, which depicts the activities of the process arranged in sequential order — this is business process management. ConceptDraw DIAGRAM is business process mapping software with impressive range of productivity features for business process management and classic project management. This business process management software is helpful for many purposes from different payment processes, or manufacturing processes to chemical processes. Business process mapping flowcharts helps clarify the actual workflow of different people engaged in the same process. This samples were made with ConceptDraw DIAGRAM — business process mapping software for flowcharting and used as classic visio alternative because its briefly named "visio for mac" and for windows, this sort of software named the business process management tools.
This flowchart diagram shows a process flow of project management. The diagram that is presented here depicts the project life cycle that is basic for the most of project management methods. Breaking a project into phases allows to track it in the proper manner. Through separation on phases, the total workflow of a project is divided into some foreseeable components, thus making it easier to follow the project status. A project life cycle commonly includes: initiation, definition, design, development and implementation phases. Distinguished method to show parallel and interdependent processes, as well as project life cycle relationships. A flowchart diagram is often used as visual guide to project. For instance, it used by marketing project management software for visualizing stages of marketing activities or as project management workflow tools. Created with ConceptDraw DIAGRAM — business process mapping software which is flowcharting visio alternative or shortly its visio for mac, this sort of software platform often named the business process management tools.
Picture: Process Flowchart: A Step-by-Step Comprehensive Guide
Related Solution:
UML Timing Diagram as special form of a sequence diagram are used to explore the behaviors of objects throughout a given period of time.
Picture: Diagramming Software for Design UML Timing Diagrams
Microsoft Azure is widely used cloud platform which was created by Microsoft and now is managed by Microsoft datacenters in 19 regions of the world, and has a wide set of benefits and features.
ConceptDraw DIAGRAM diagramming and vector drawing software extended with Azure Architecture Solution from the Computer and Networks area of ConceptDraw Solution Park is the best for designing various pictorial infographics, illustrations and materials showing the possibilities and work of Microsoft Azure Cloud System and Azure services.
Picture: Microsoft Azure
Related Solution:
Structured-systems analysis and design method uses data flow diagrams to represent the process of data flowing through a system. Talking about this might be useless without a proper example of DFD for online store (Data Flow Diagram). This DFD example shows all the distinctness that a diagram can bring into a scattered data structure.
Data flow diagrams are used to show how data is processed within some business processes. Making DFD is a common practice for business process modeling and analysis. This diagram represents the online store business flow. It describes inputs and outputs within online selling process and depicts the interactions between its participants. This DF diagram can be used by system analysts to create an overview of a business, to study and discover its inherent strengths and weak points.
Picture: Example of DFD for Online Store (Data Flow Diagram)
Related Solution:
Database model is a graphic representation need at the beginning of project development. You won't have any problems with drawing ER diagrams on a Mac anymore with ConceptDraw DIAGRAM application. Special libraries that contain all the symbols of both Chen's and Crow’s foot notation allow you to start database modeling within a few minutes.
Creating entity-relationship diagrams on Mac is fun and effortless when you use a software designed for professional ERD drawing tailored to specific characteristics of Apple OS X. ConceptDraw DIAGRAM is a business diagramming software for those using OS X.
The Entity-Relationship Diagrams solution for ConceptDraw has 2 libraries containing about 50 vector icons, depicting ERD symbols of the most popular Chen's and Crow’s Foot Notations. The other valuable component of the solution is a collection of ERDs samples and templates that can be opened on Macs and PCs.
Picture: Drawing ER diagrams on a Mac
Related Solution:
ConceptDraw DIAGRAM is new software for business and technical drawing. Powerful business drawing tools, extensive libraries with pre-drawn shapes, free samples of business drawings, technical drawings and flowcharts, support of many graphic formats enable users to visually develop their business drawings charts and diagrams in any combination of drawings, diagrams and flow charts.
Picture: ConceptDraw DIAGRAM The best Business Drawing Software
Related Solution:
The Baseball solution for ConceptDraw DIAGRAM contains a set of samples depicts helpful baseball diagrams examples. Using embedded presentation tools you are able to share your baseball knowledge with wide audience.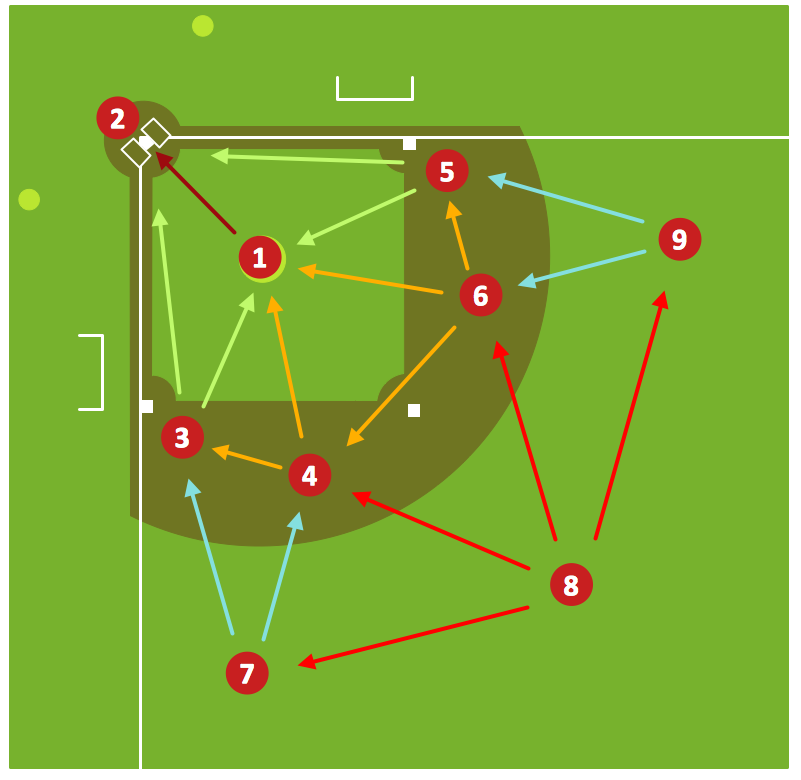
Picture: Baseball Diagram – Defensive Fly Ball
Related Solution:
Visual information is easier to perceive. You can teach even a child to make diagrams with a good flowchart example that would be interesting for it. Flowcharts can be fun, it’s not about business processes or programming algorithms.
This flowchart shows step by step process of manufacturing of Nixtamal The product which is obtained by processing maize with calcium hydroxide. We must assume that the Aztecs were very fond of this product, if the recipe of its production came to our times. This flow chart was designed using ConceptDraw DIAGRAM with its solution for designing flowcharts of various types, sizes and purposes. ConceptDraw Flowcharts solution consists from the library of flowchart symbols, containing the set vector objects. Also there are a lot of diverse templates and samples of flow charts.
Picture: Flowchart Examples and Templates
Related Solution:
ER diagram is the most popular database design tool which lets create graphical representations of database tables, their columns and also relationships. As for the Mac users, they are very interested in powerful database diagramming tools and ER diagram tool for OS X to design professional looking E-R Diagrams and ERD drawings. ConceptDraw DIAGRAM software on Mac OS X gives the ability to easy draw ERDs.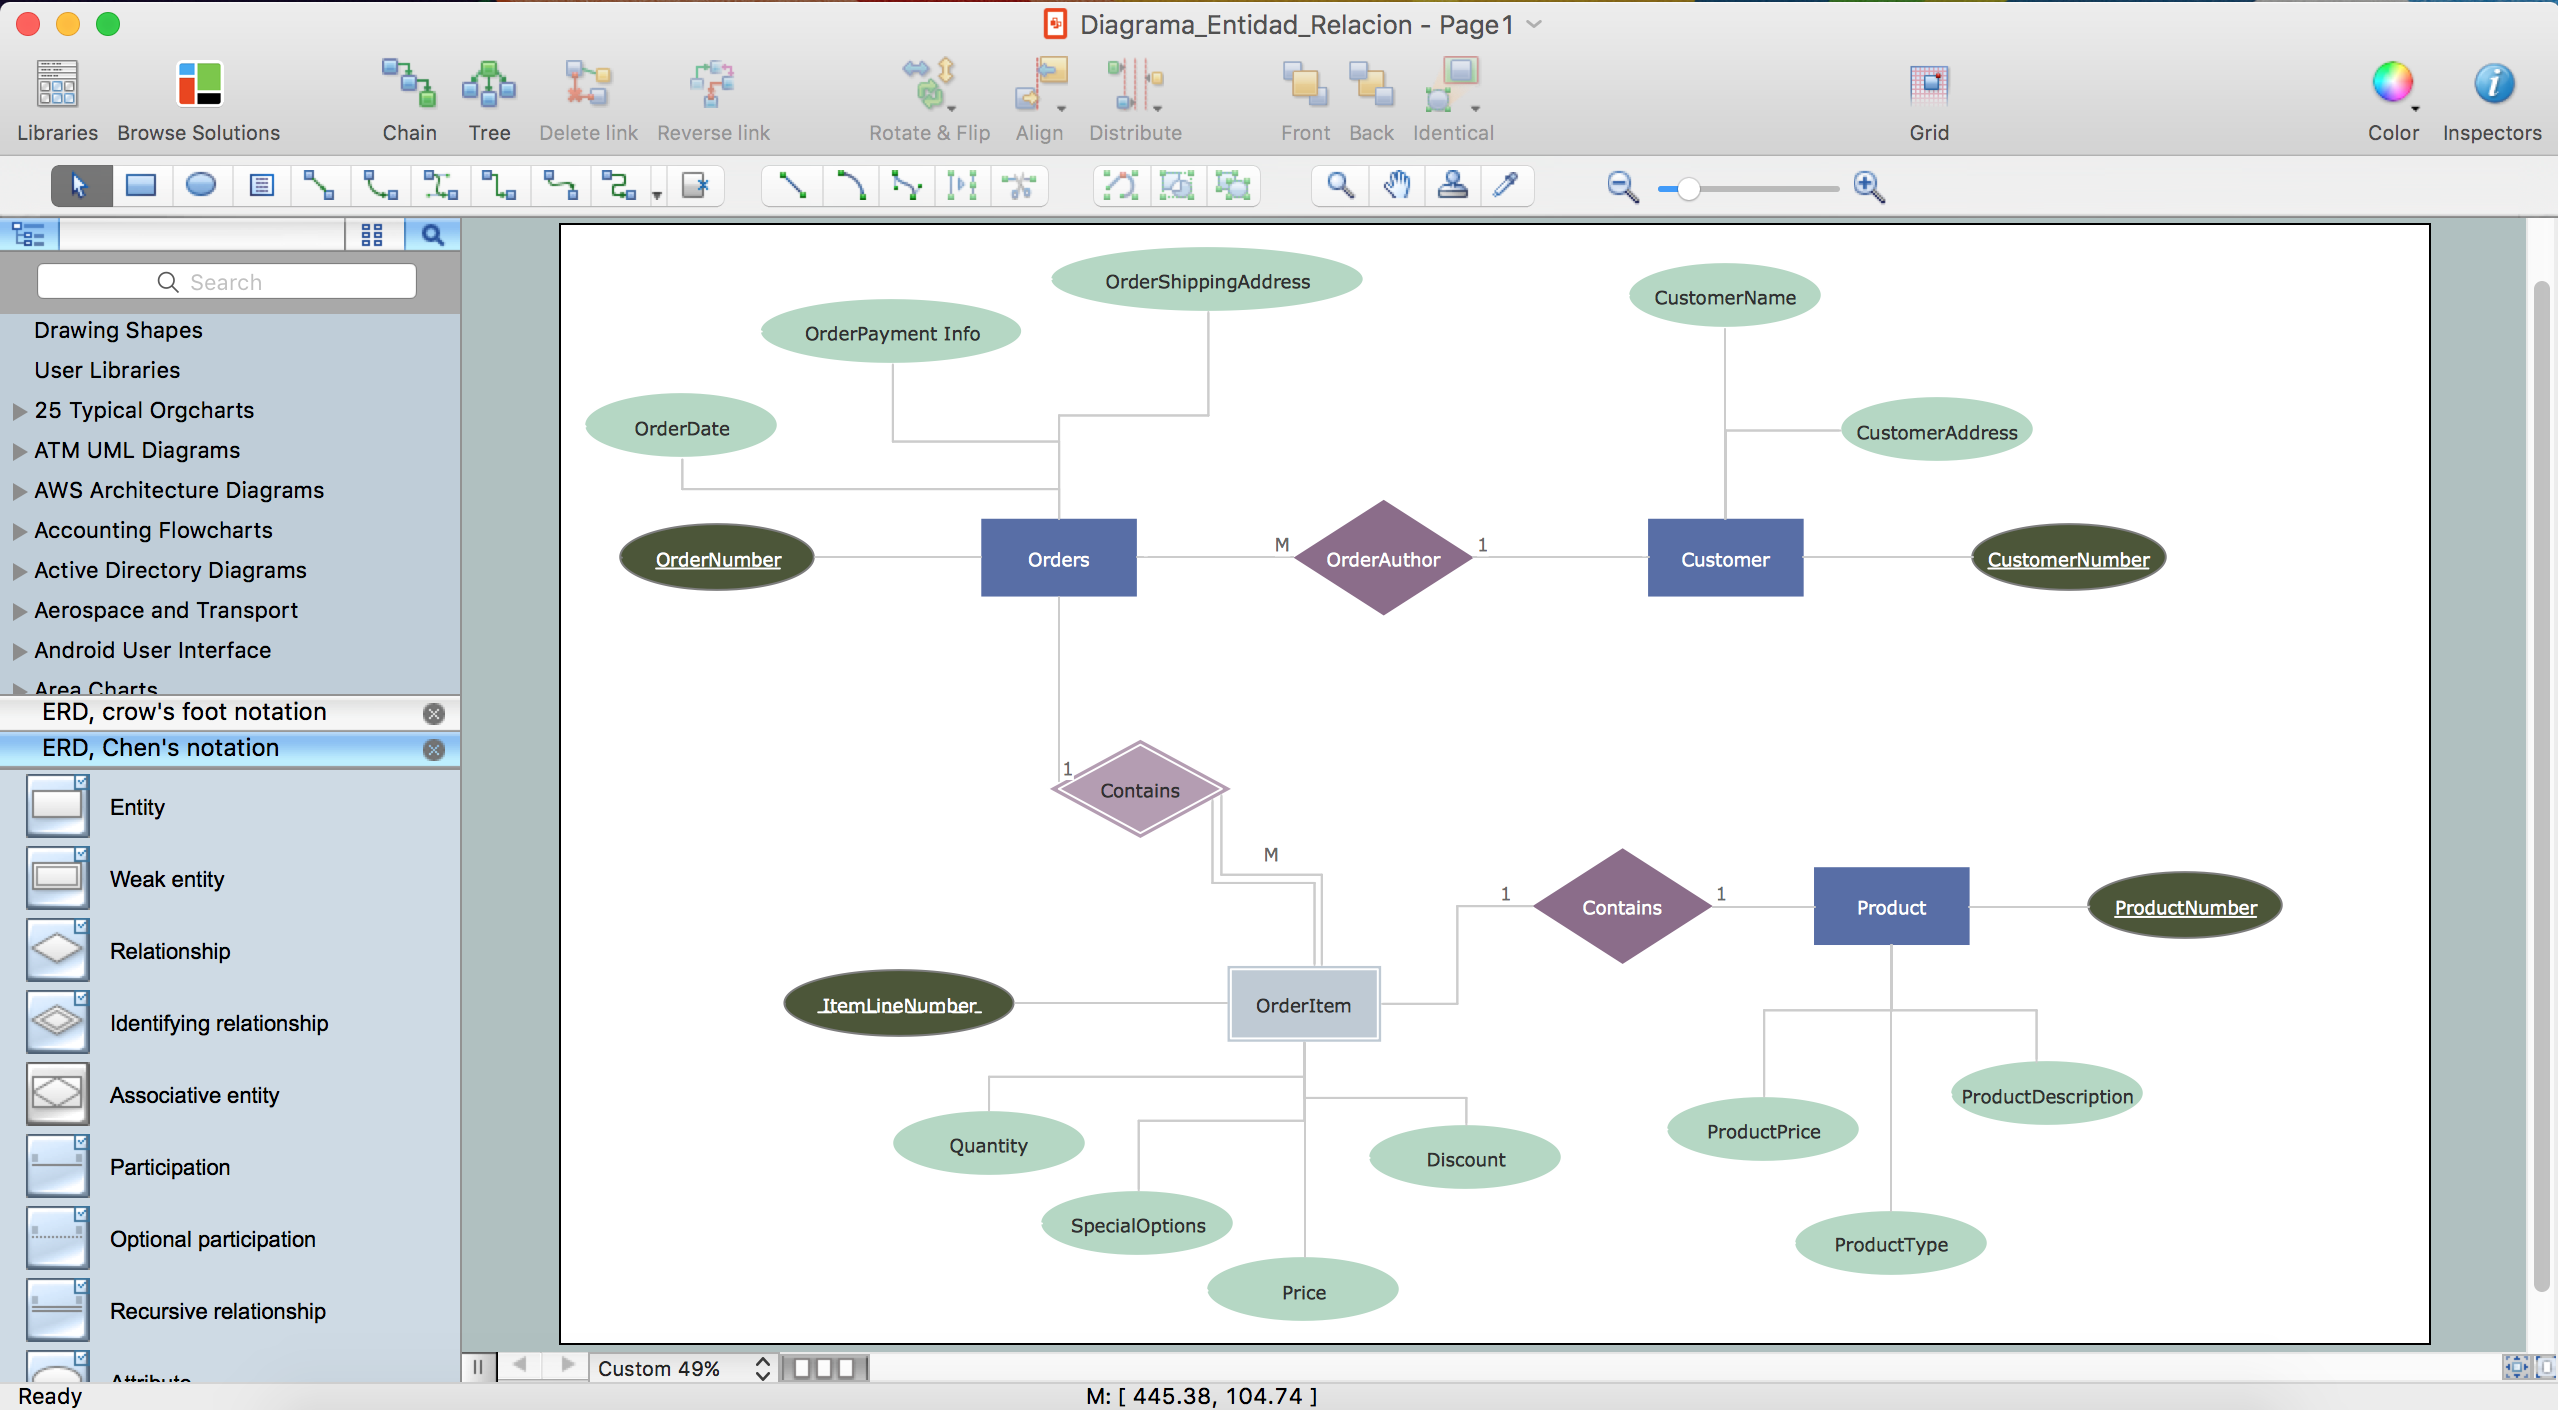
Picture: ER diagram tool for OS X
Related Solution:
The vector stencils library from the solution Information Model Diagrams contains specific data type symbols of the EXPRESS-G notation such as entity data type symbols, simple data type symbols, enumeration data type symbols, defined data type symbols, select data type symbols and specific attribute symbols for ConceptDraw DIAGRAM diagramming and vector drawing software. The Information Model Diagrams solution is contained in the Software Development area of ConceptDraw Solution Park.
Picture: Express-G Diagram


, Chen's notation")