UML Object Diagram. Design Elements
UML Object Diagram is a type of Structure Diagrams that shows the objects of the system and attributes, and relations between the objects at a certain moment of time.
UML Object Diagram represents a specific instance of a Class Diagram at a moment of time.
A correlated group of the Object Diagrams shows how the system will develop over the time.
Objects and links on the UML Object Diagram are represented by Instance Specification that use the slots to show the object classifier, instance name, attributes and other structural characteristics. One attribute or feature has the one corresponded slot. Links between instances are named as links. You can also use the associations of aggregation (represents as empty diamond) or composition (represents as filled diamond), and other UML entities on the UML Object Diagram.
The Rapid UML Solution for ConceptDraw DIAGRAM contains 13 vector stencils libraries with 393 interactive shapes that you can use to design your UML diagrams.
Pic.1. Rapid UML in ConceptDraw STORE
To design an Object Diagram use the UML Object Diagram library.
UML Object Diagram library contains 26 shapes:
- Object
- Class
- Instance specification
- Collection of objects
- Self association
- Multi object
- Association One-to-Many
- Association Many-to-Many
- Association
- Aggregation
- Composition
- Dependency
- Generalization
- Realization
- Link
- Symbol { }
- Note
- Package
- Package (advanced)
- System
- Subsystem
- Object 2
- Smart connector
- Class interface
- Line connector
- Callout
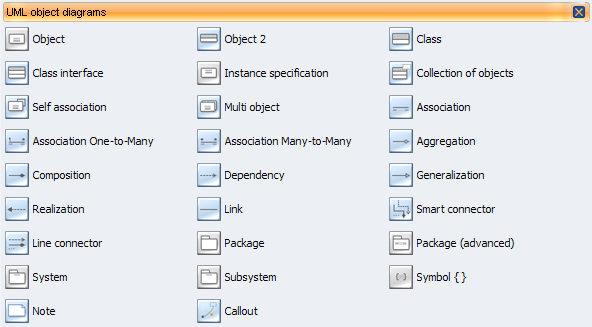
Pic.2. UML Object Diagram Library
ConceptDraw Rapid UML solution provides UML Object Diagram library of vector stencils for drawing the object diagrams using object blocks and assembly connectors.
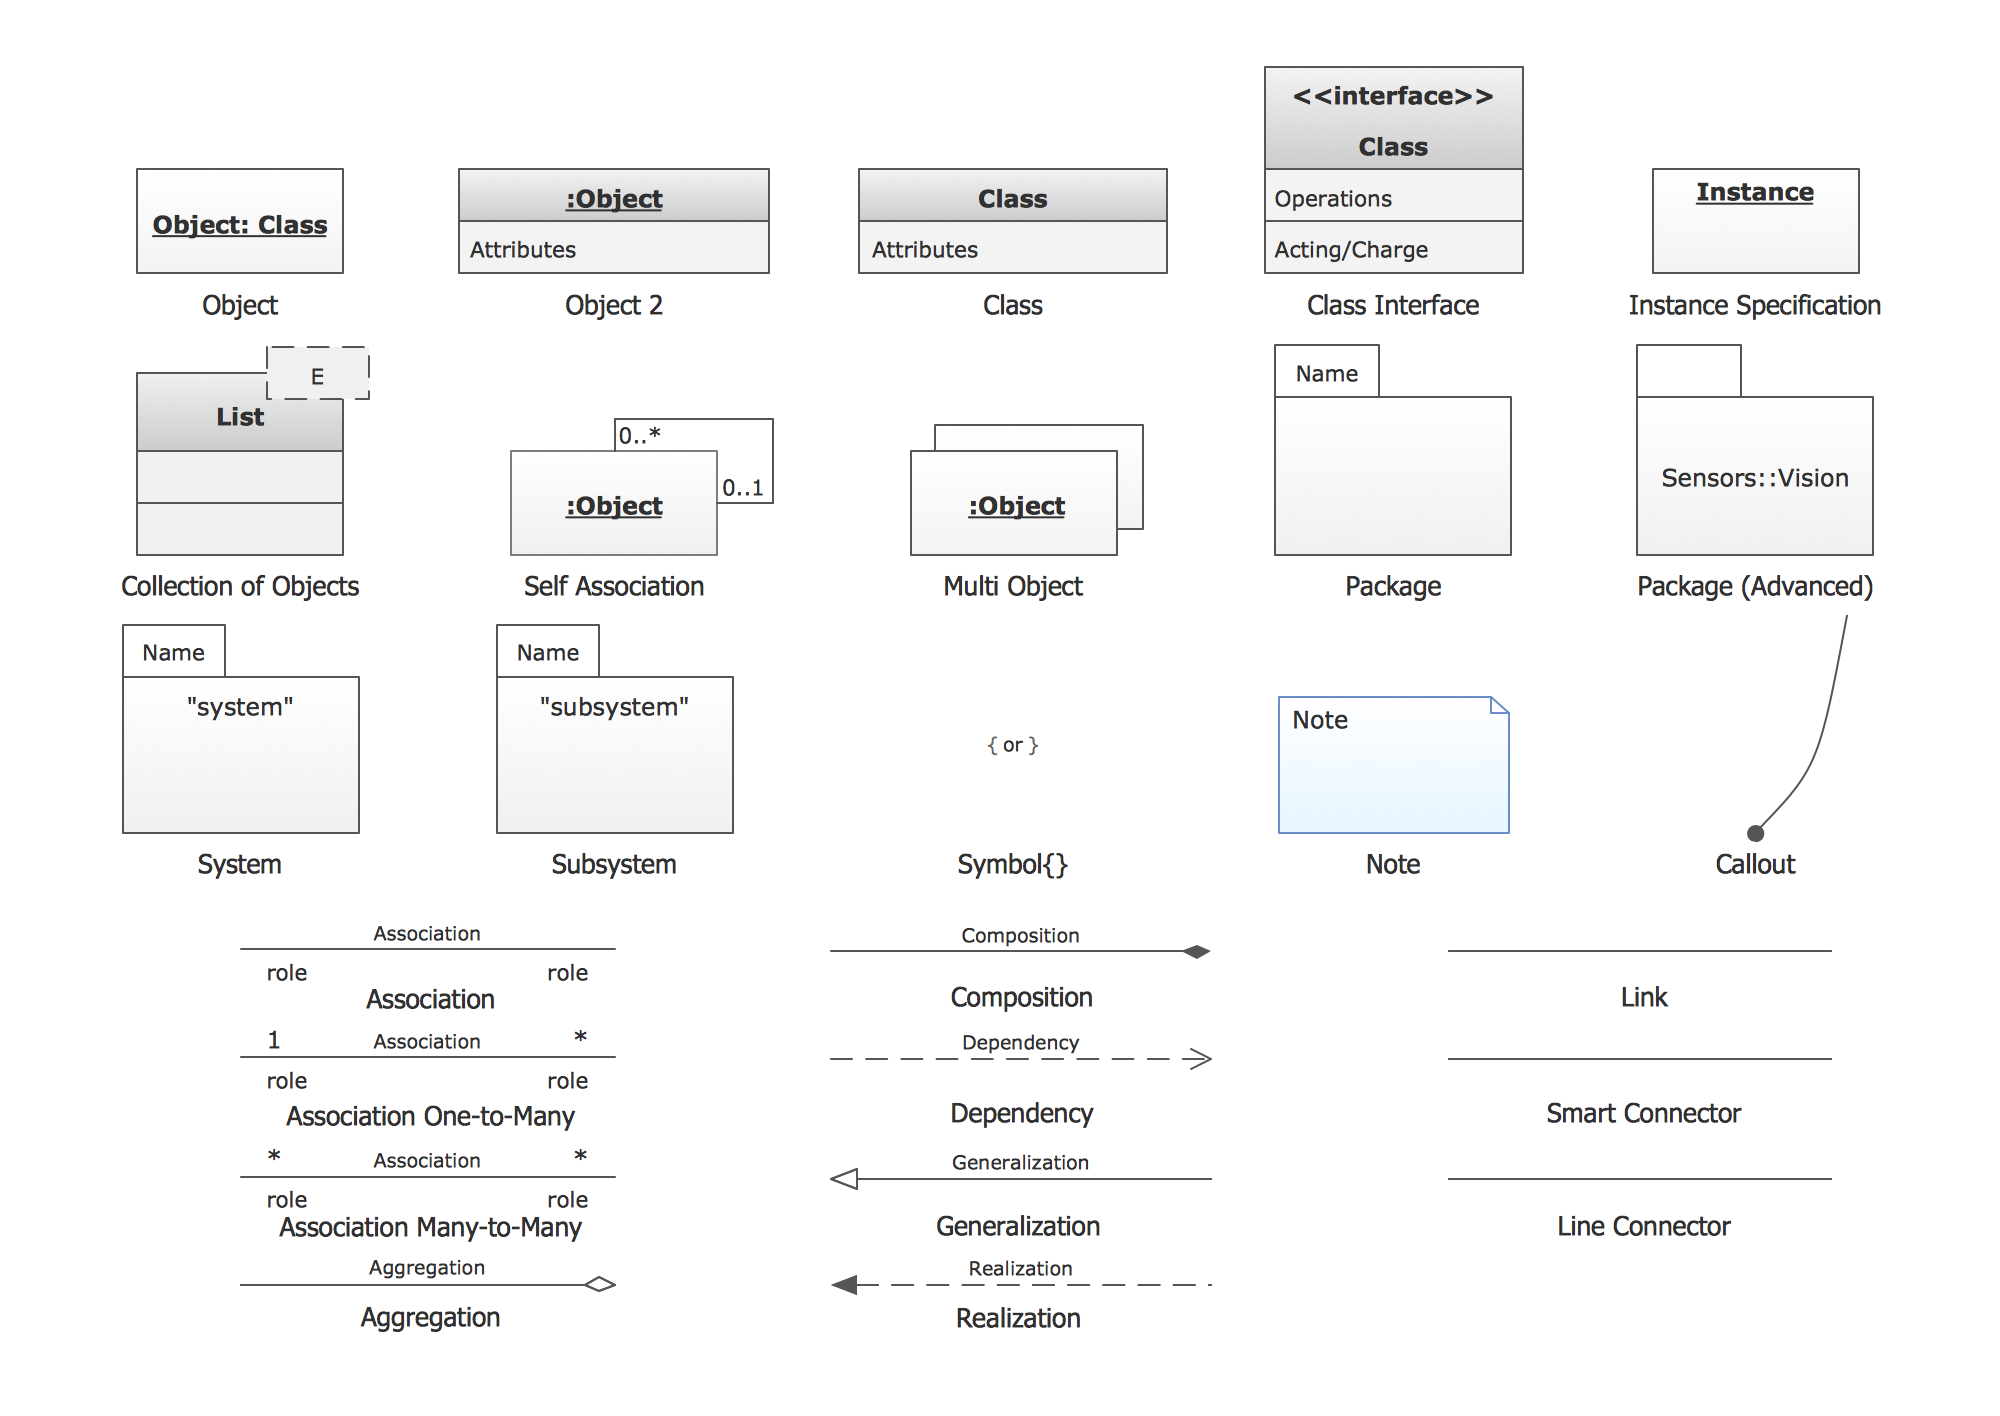
Pic.3. UML Object Diagram Library Elements
Use design element from the UML Object Diagram library to draw your own UML object diagrams of complex systems and software applications.
NINE RELATED HOW TO's:
While designing a conceptual data model, you should use appropriate software. For instance, ConceptDraw DIAGRAM is a user-friendly ER diagram tool that has a lot of samples and templates to facilitate your work. A clear entity-relationship diagram helps to define the relations between system’s components.
Software engineering is the section of a computer science engaged to design, realization, and support of complex software products. An ERD is a data modeling method that is widely applied in the software engineering practice. Commonly it is used for developing a structure of a a relational database. An entity relationship diagram is helpful for structuring and organizing databases that can be modeled using a relational structure. An entity relationship diagram is designed to depicts the interrelationships within the sets of entities which are accumulated in the database. Each entity represents a particular component of a data. Thus, ER diagrams depicts the logical structure of databases. ConceptDraw ER Diagrams solution provides software engineers with the professional tool for making entity-relationship diagrams.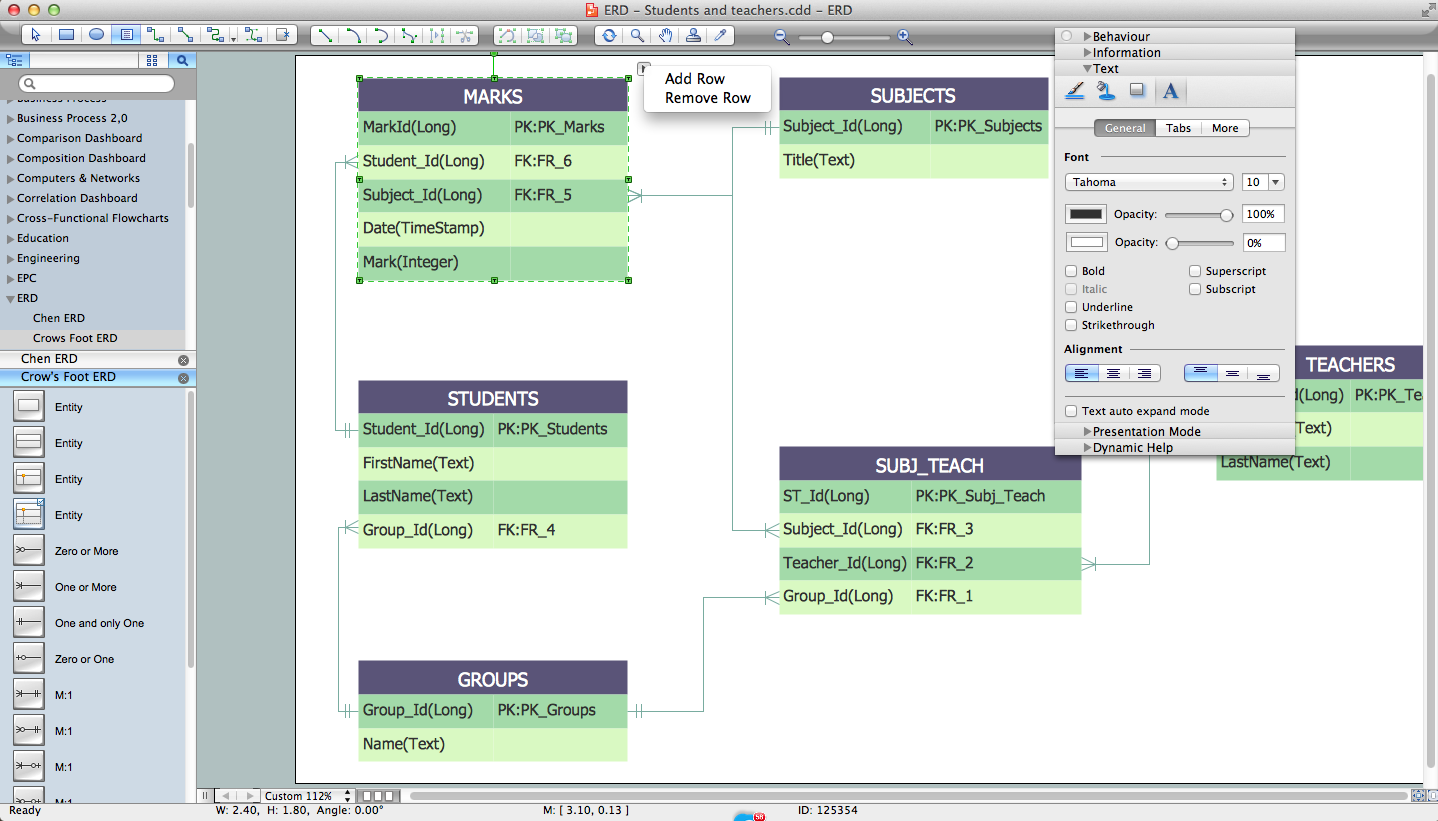
Picture: Entity Relationship Diagram Software Engineering
Related Solution:
This sample shows the UML Class Diagram of Learning Object Metadata (LOM) base schema. The classes represented as boxes with attributes and are connected with associations. You can see the composition associations on this diagram. The associations are indicated with the multiplicities 0..1, 0..*. This sample can be used in electrical and electronics engineering.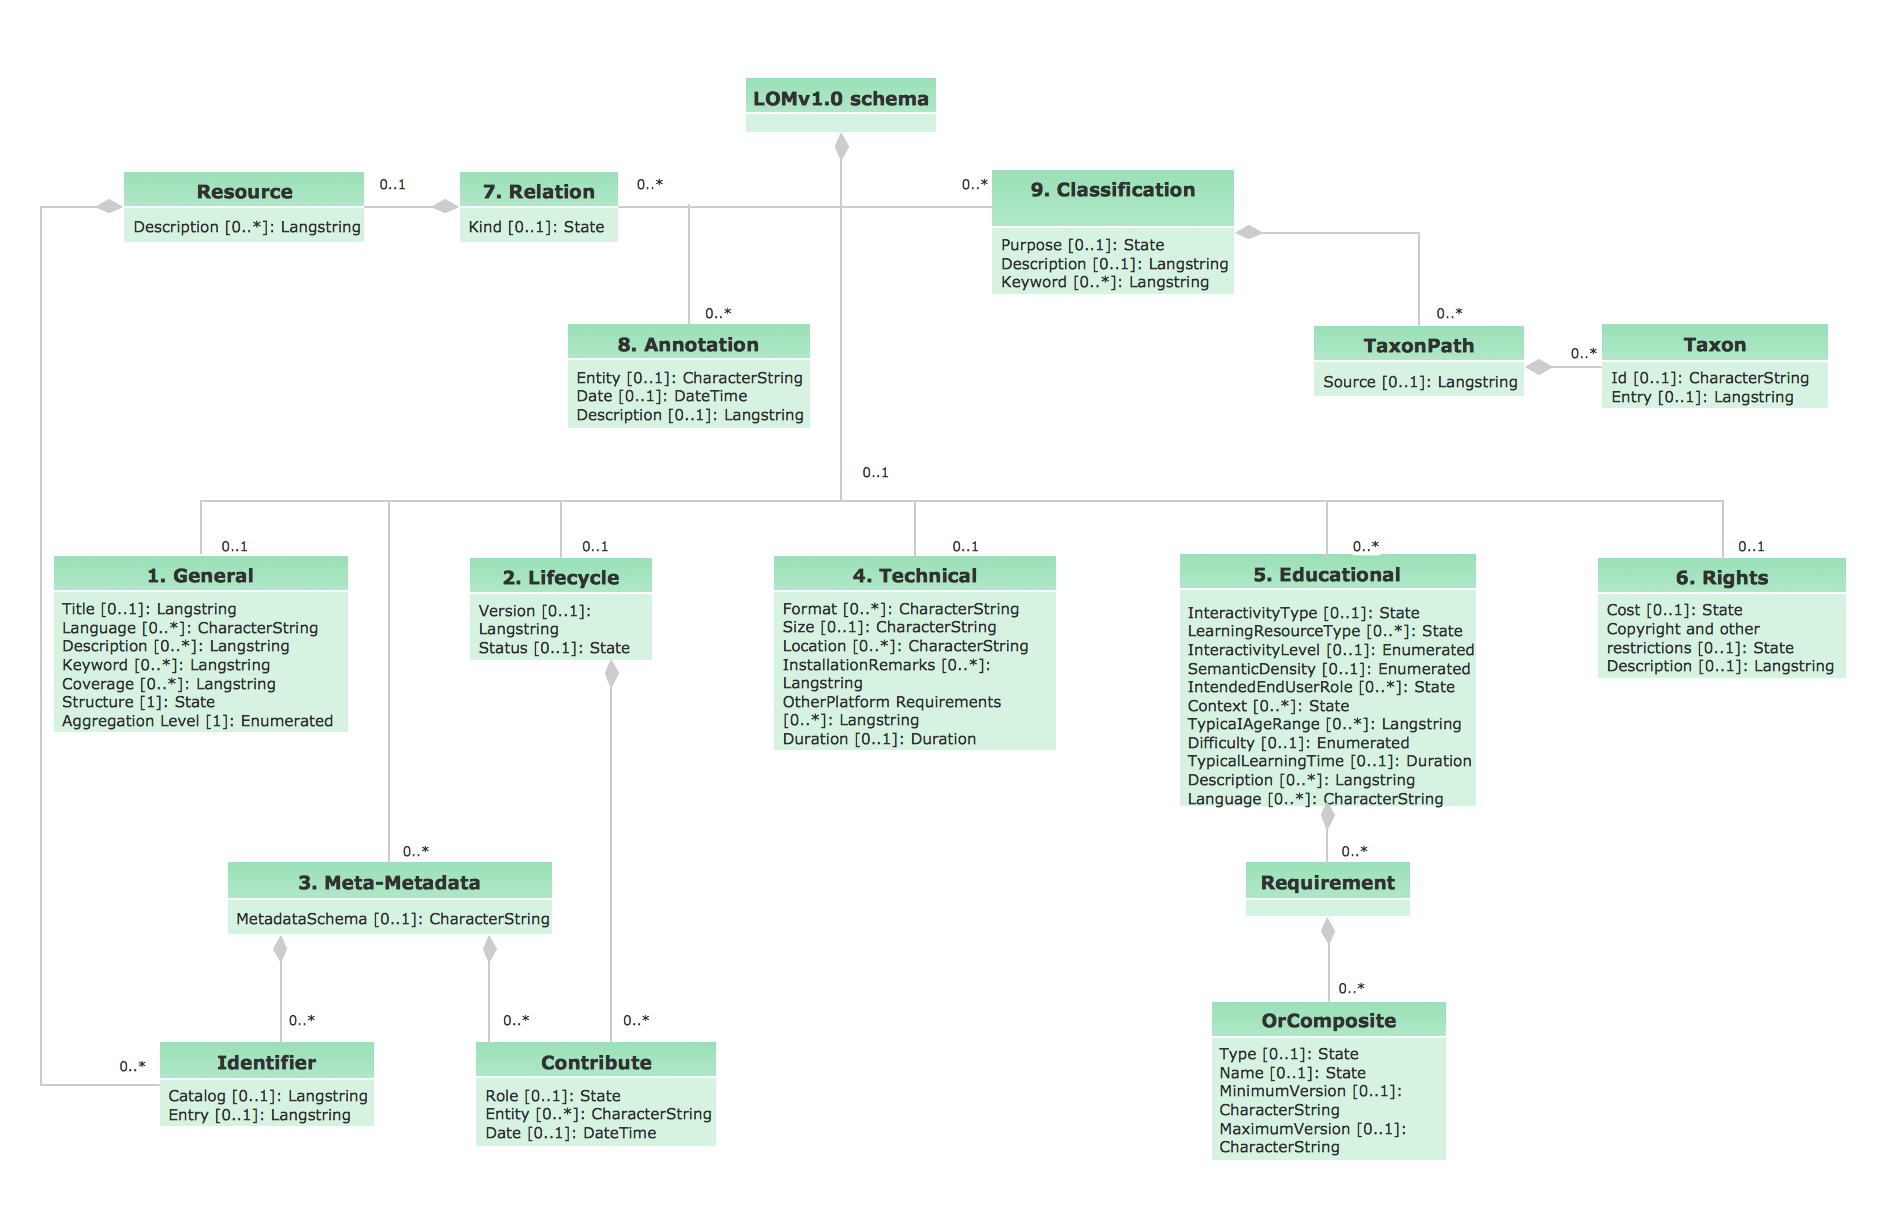
Picture: UML Diagram Editor
Related Solution:
UML Communication Diagram depicts the interactions between objects or parts in terms of sequenced messages and describes both the static structure and dynamic behavior of a system.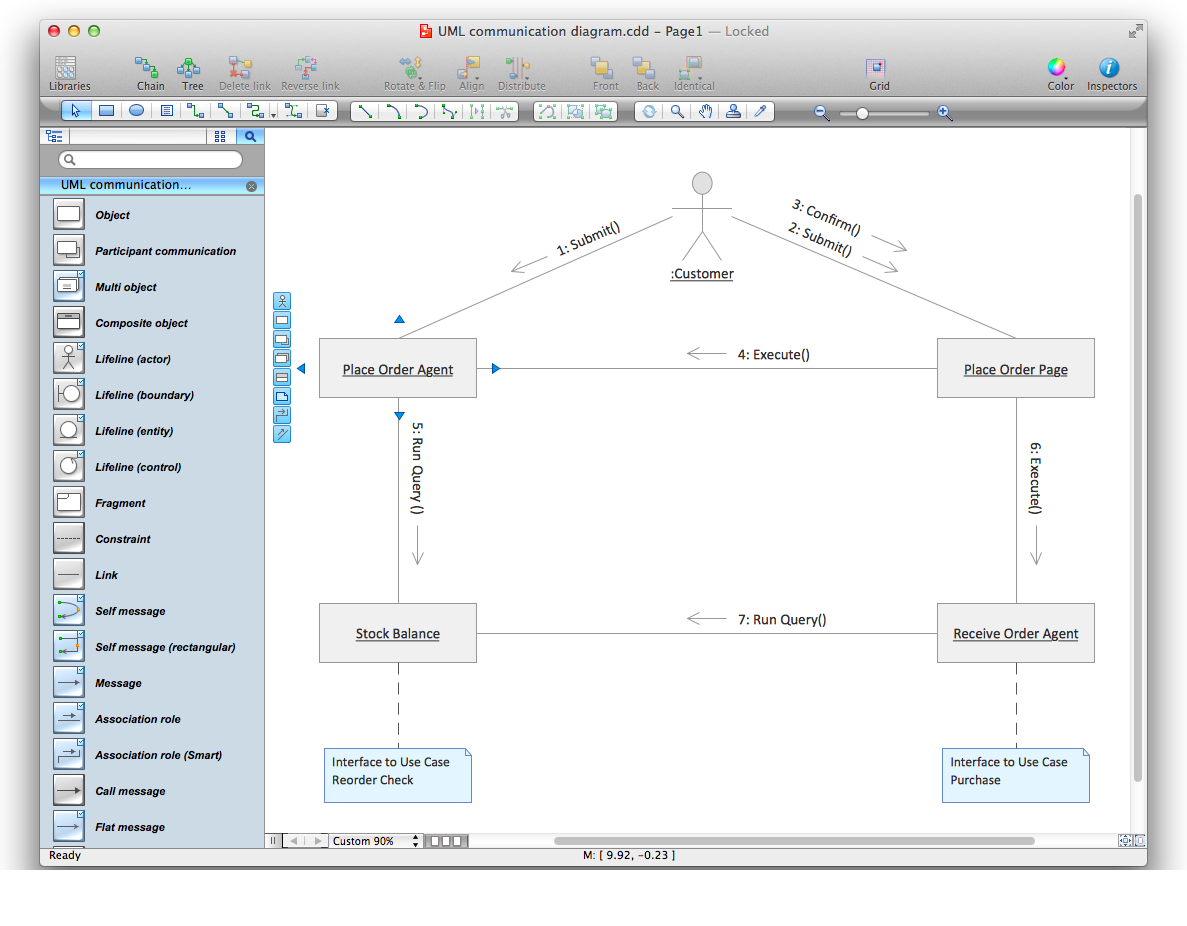
Picture: Diagramming Software for Design UML Communication Diagrams
This sample was created in ConceptDraw DIAGRAM diagramming and vector drawing software using the UML Class Diagram library of the Rapid UML Solution from the Software Development area of ConceptDraw Solution Park.
This sample shows the structure of the building and can be used by building companies, real estate agencies, at the buying / selling of the realty.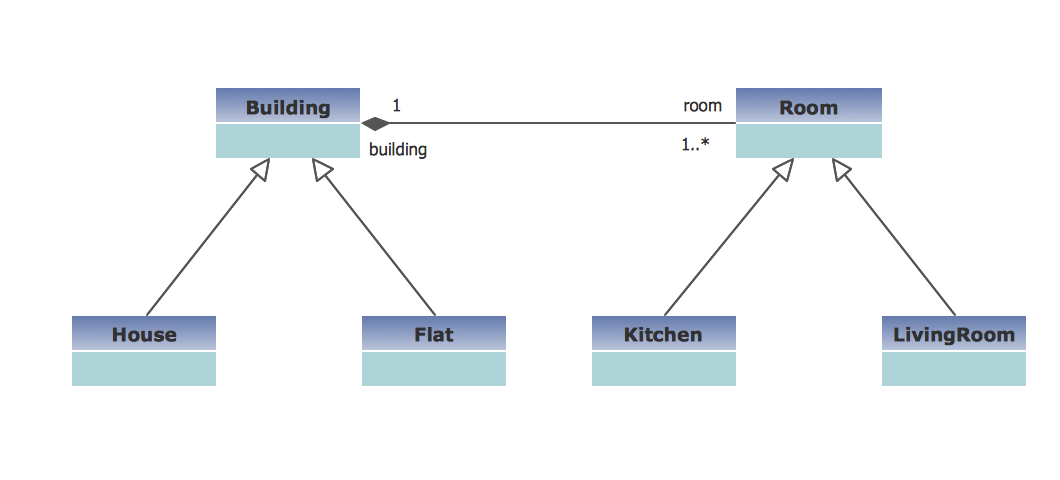
Picture: UML Class Diagram Example - Buildings and Rooms
Related Solution:
Venn diagrams are illustrations used in the branch of mathematics known as set theory.
Create your Venn diagrams for logic problem solving using the ConceptDraw DIAGRAM software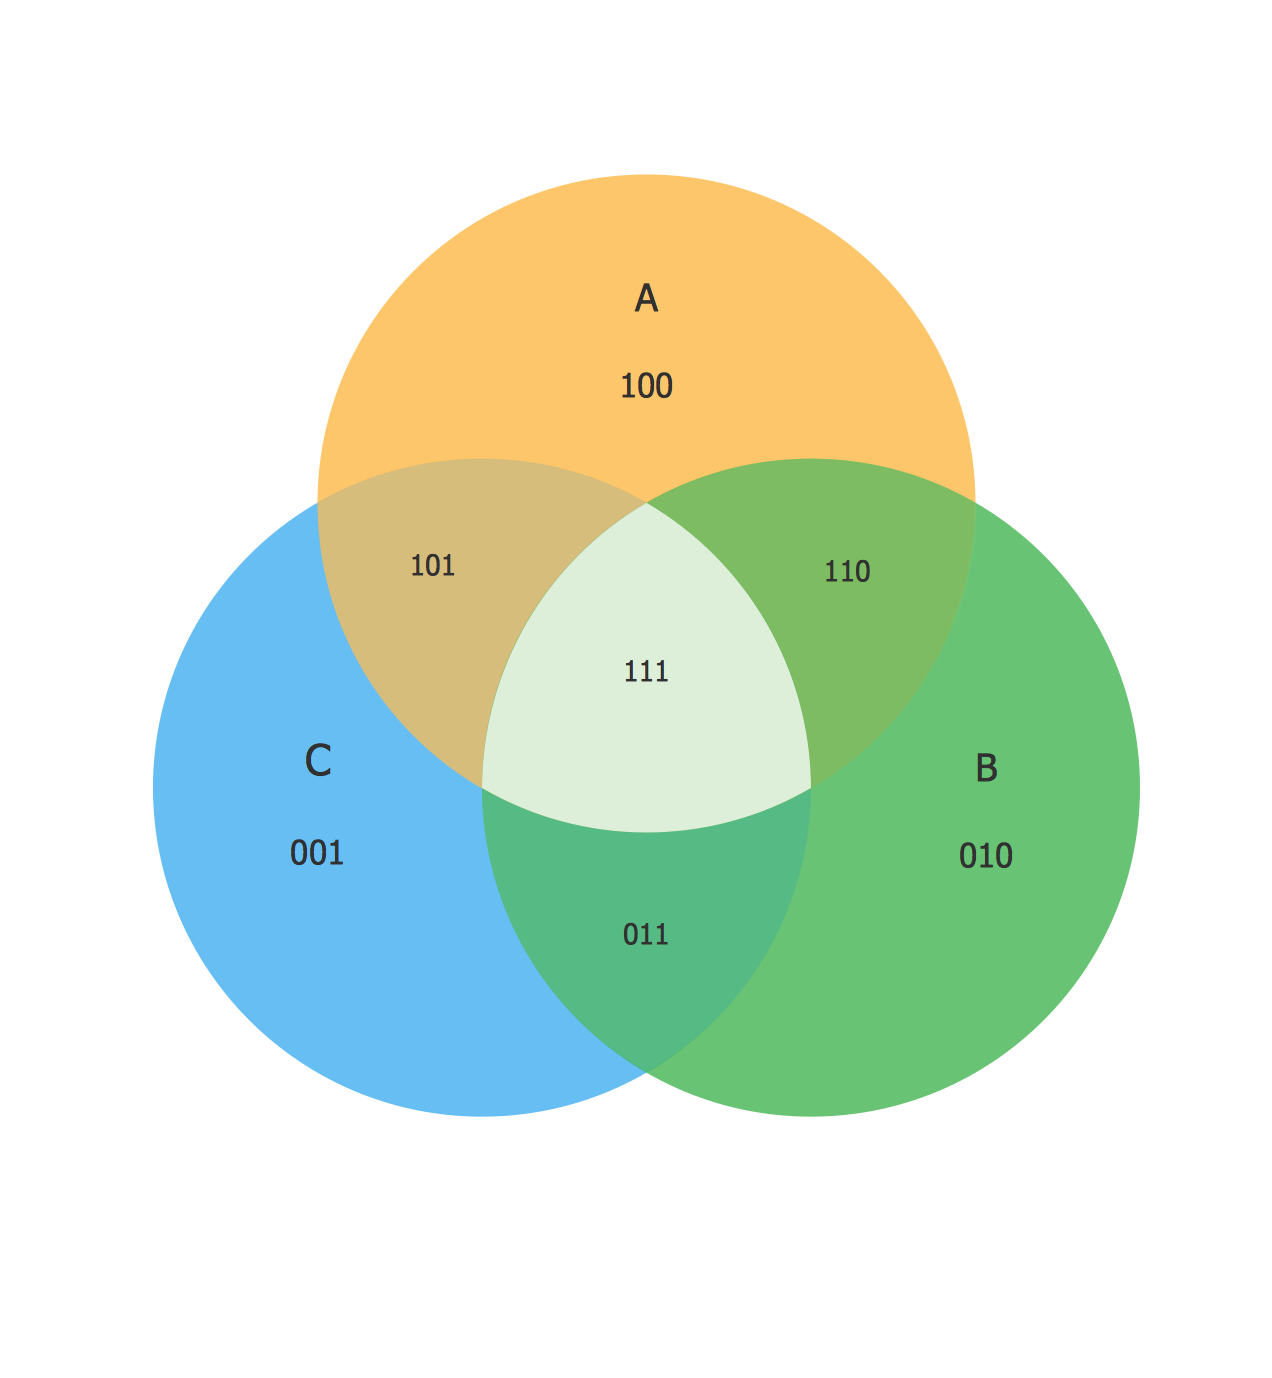
Picture:
Venn Diagram Examples for Problem Solving
Venn Diagram as a Truth Table
Related Solution:
A concept map is a way of representing relationships between ideas, images, or words.
How to draw a Concept Map quick, easy and effective? ConceptDraw DIAGRAM offers the unique Concept Maps Solution from the Diagrams Area that will help you!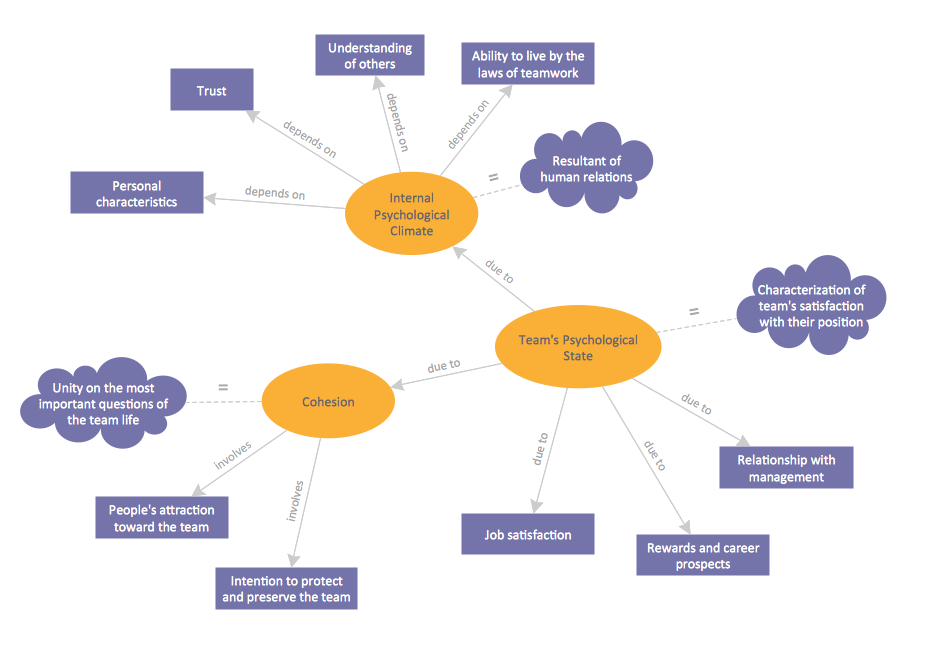
Picture: Concept Map
Related Solution:
This sample was created in ConceptDraw DIAGRAM diagramming and vector drawing software using the UML State Mashine Diagram library of the Rapid UML Solution from the Software Development area of ConceptDraw Solution Park.
This sample shows the work of the online store and can be used for the understanding of the online shopping processes, for projection and creating of the online store.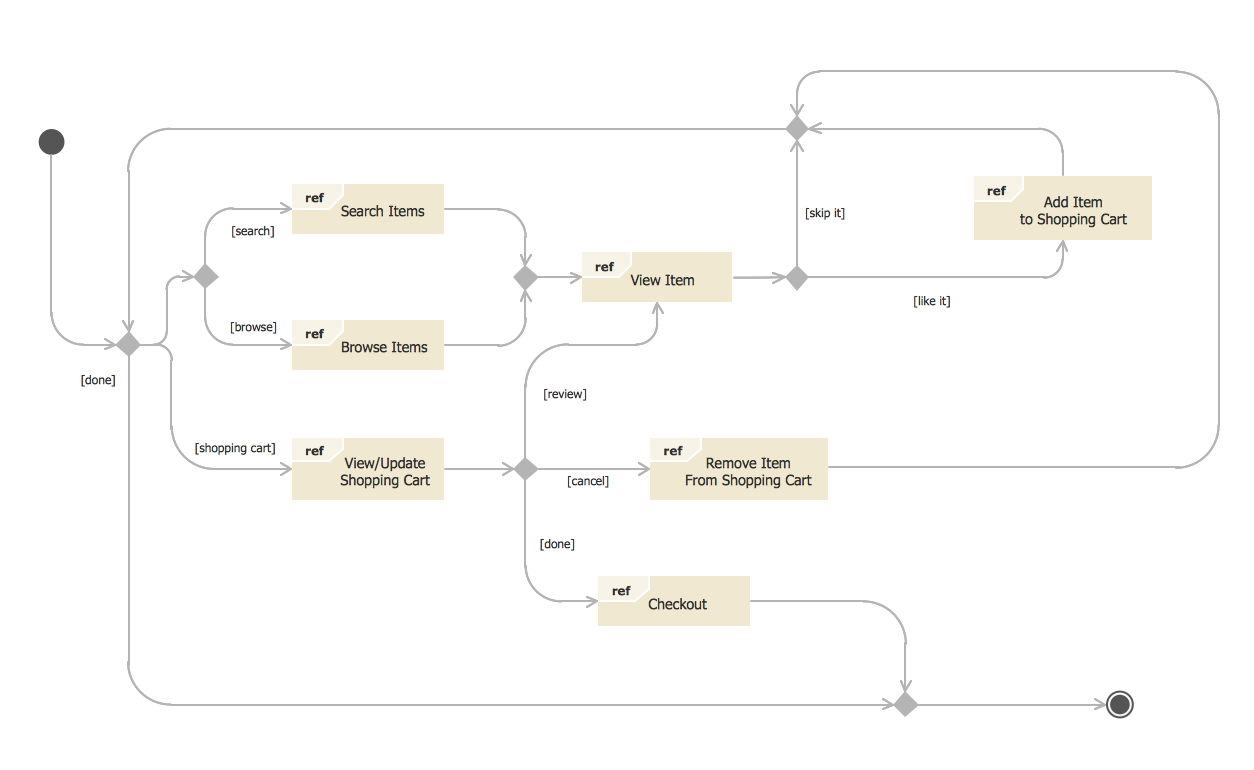
Picture: State Diagram Example — Online Store
Related Solution:
This sample shows the UML Activity Diagram that describes the flow of controls in the system. This is preparation to see how the system will work when executed. Black circle indicates the start of the workflow, encircled black circle indicates the end of the workflow. This sample shows the decision of the problem and can be used when you need to solve some set of problems.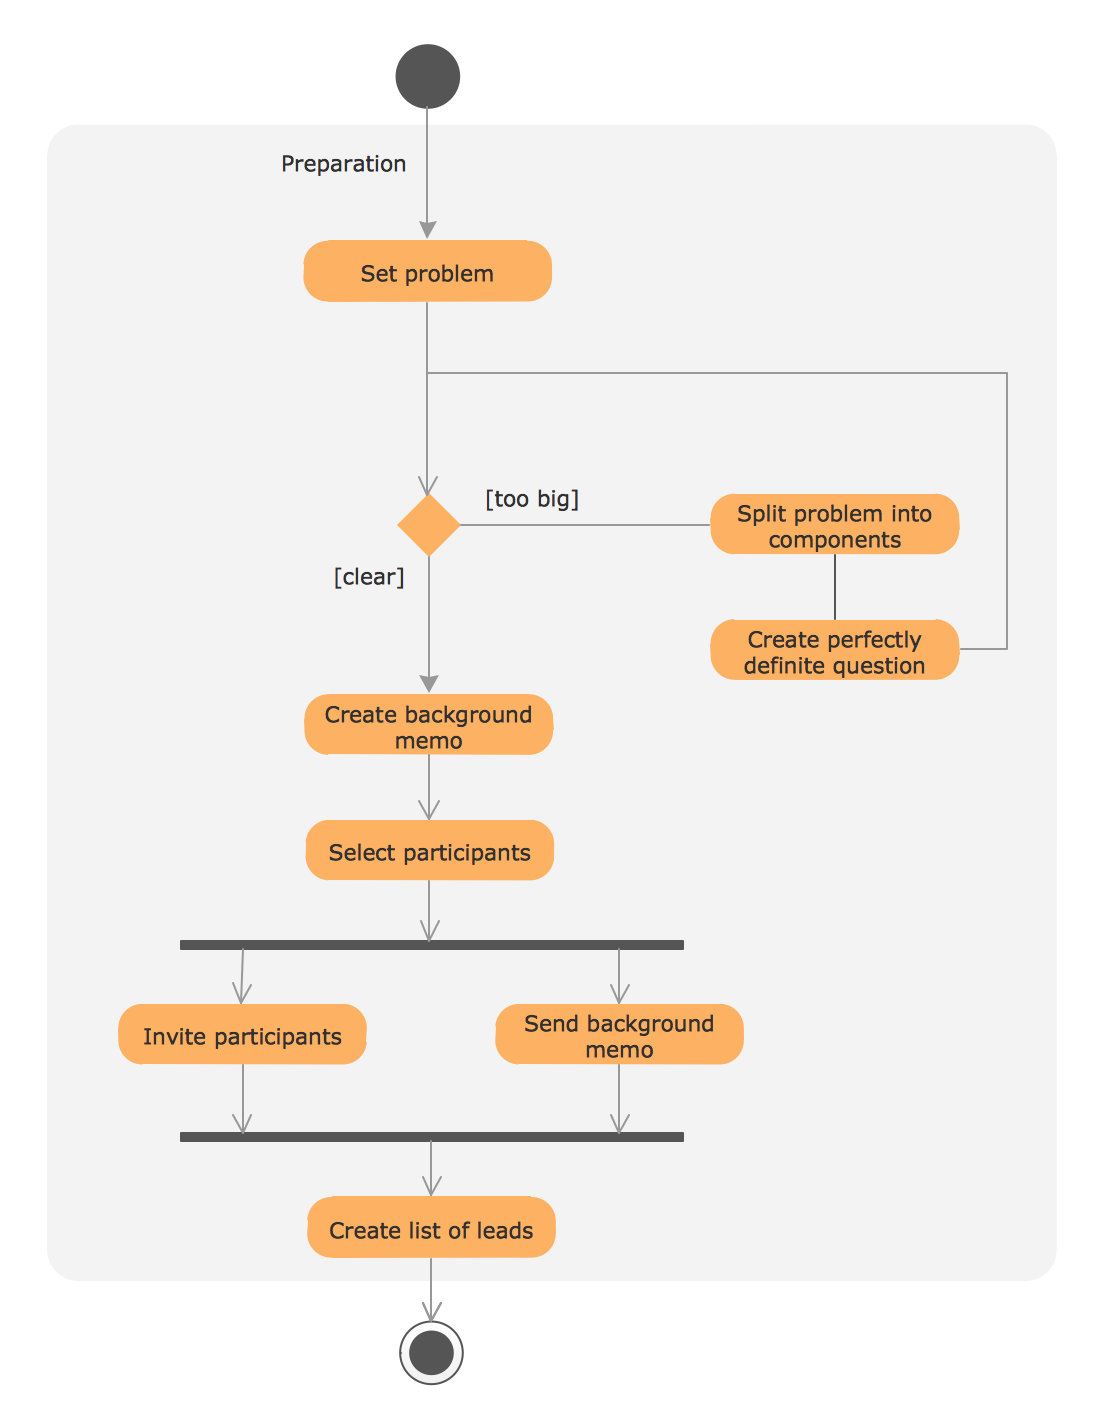
Picture: UML Process Diagram Example
Related Solution:
You can use many tools to create a representation of a system behavior or a scheme of objects relationships. Some of them are quite abstract and useless, and some, like UML tools help clarifying both the structure and the behavior of a system. There are various types of uml diagrams and tons of examples explaining the difference between them.
UML 2.2 specification has many kinds of diagrams. They are divided into two groups( structure and behavior diagrams). This class diagram shows the hierarchical structure of UML 2.2 specification. Class diagram - the most suitable tool for this task because it is designed to describe basic structure of a system. This diagram can be use as a visual aid for learning UML.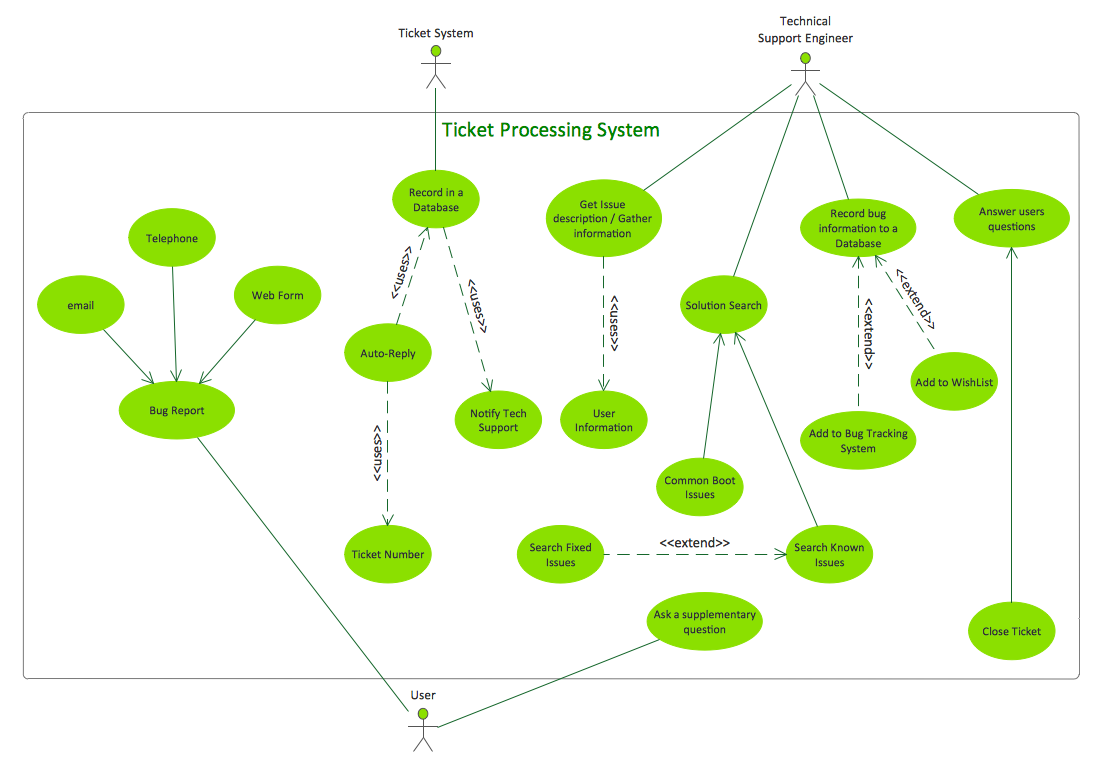
Picture: UML Tool & UML Diagram Examples
Related Solution:
