UML Use Case Diagram. Design Elements
UML Use Case Diagram is a type of Behavior Diagrams that displays the dependencies between the actors and use cases.
UML Use Case Diagram displays the system on the conceptual level.
The purpose of a UML Use Case Diagram is to demonstrate the various types of users of a system and the different ways of their interacting with this system. Use Case Diagrams are often used together with the textual use cases and other types of diagrams.
The notation for a Use Case Diagram involves the following types of symbols:
- Use cases are represented as the horizontally shaped ovals and display the different uses.
- Actors are the people that employ the use cases and are represented on the diagram as figures of persons. Actors cannot be related each to other (except relations of generalization/inheritance).
- Associations are shown as lines between actors and use cases.
- System boundary – the box with the name and ovals (use cases) inside that sets a system scope to use cases.
- Packages that allow you to add the elements in groups.
The Rapid UML Solution for ConceptDraw DIAGRAM contains 13 vector stencils libraries with 393 interactive shapes that you can use to design your UML diagrams.
To design a Use Case Diagram use the UML Use Case Diagram library.
UML Use Case Diagram library contains 26 shapes:
- Include relationship
- Use case
- Communicates relationship
- Actor 1
- Uses relationship
- Extend relationship
- Generalization relationship
- Multiplicity: mandatory
- Package
- Multiplicity: many (zero or more)
- Communication line
- Use case set 2.0
- Divider
- Actor 2
- System boundary
- Frame, fragment
- Note
- Symbol << >>
- Association Many-to-Many
- Association One-to-Many
- Smart connector (with options)
- Interface
- Smart connector
- Line connector
- Note connector
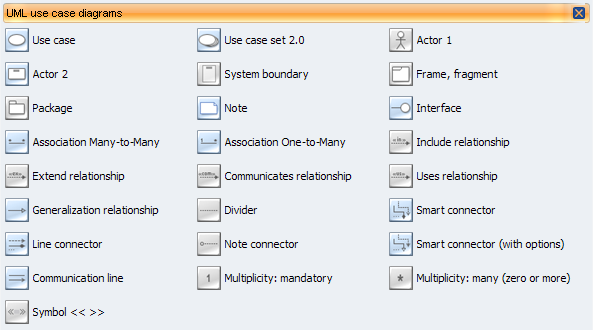
Pic.1. UML Use Case Diagram Library
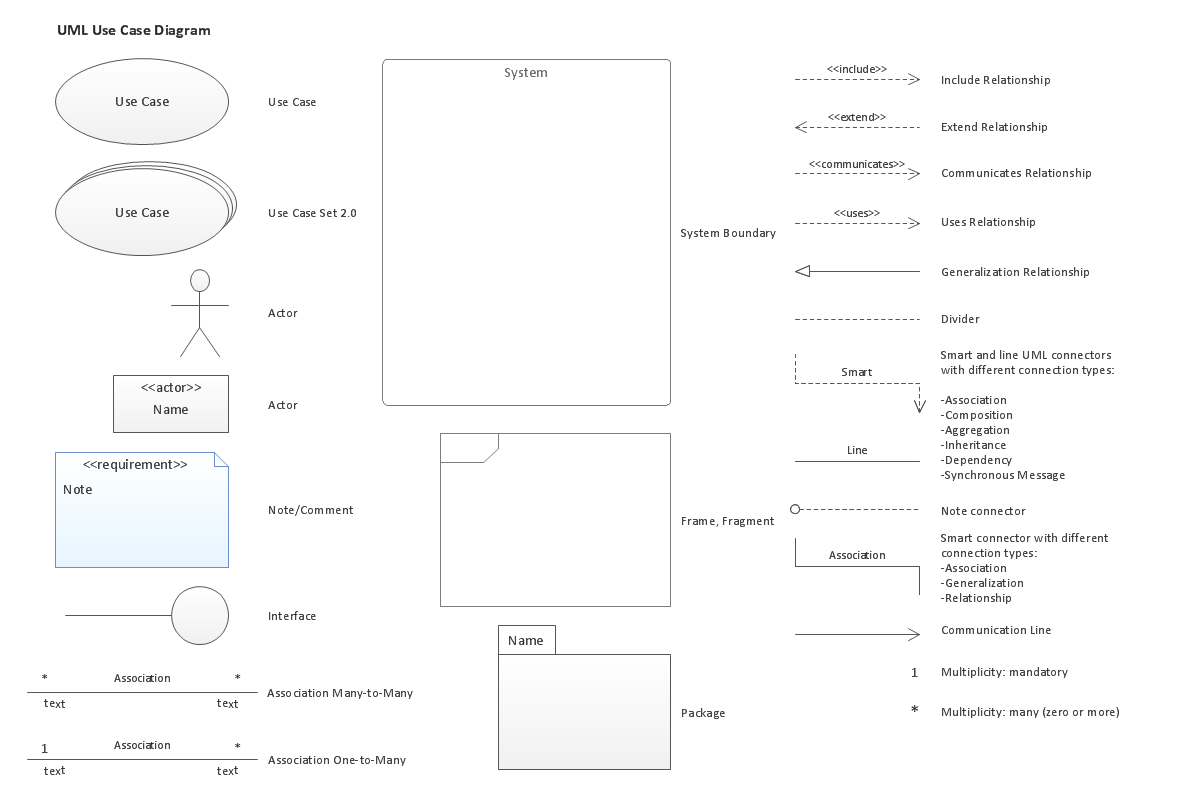
Pic.2. UML Use Case Diagram Library Elements
ConceptDraw Rapid UML solution provide UML Use Case Diagram library of vector stencils for use case diagram elements like actors, use cases, connectors, etc.
Use the library UML Use Case Diagram to draw your own UML use case diagrams that show interactions between a roles (actors) and a system, to achieve a goal.
TEN RELATED HOW TO's:
Still doubting about the number of tables in your cafe? You should create a cafe floor plan that will answer all your questions and reflect all the details of your cafe interior. Get started in several minutes and unlock your creativity with dozens of ConceptDraw DIAGRAM templates and examples!
Dealing with interiors plans for HoReCa business, for example, developing a plan for cafe you will meet with both creative and architectural challenges. First of all , the layout of cafe should be beautiful and convenient for visitors. Being developed sagely a plan of your cafe leads to successful sales and good benefits. Designing a cafe floor plan includes various elements that can be picked out using ConceptDraw Cafe and Restaurant Floor Plan solution. The vector objects library supplied with Cafe and Restaurant solution provides a number of graphic objects for displaying different layouts and styles of catering establishments.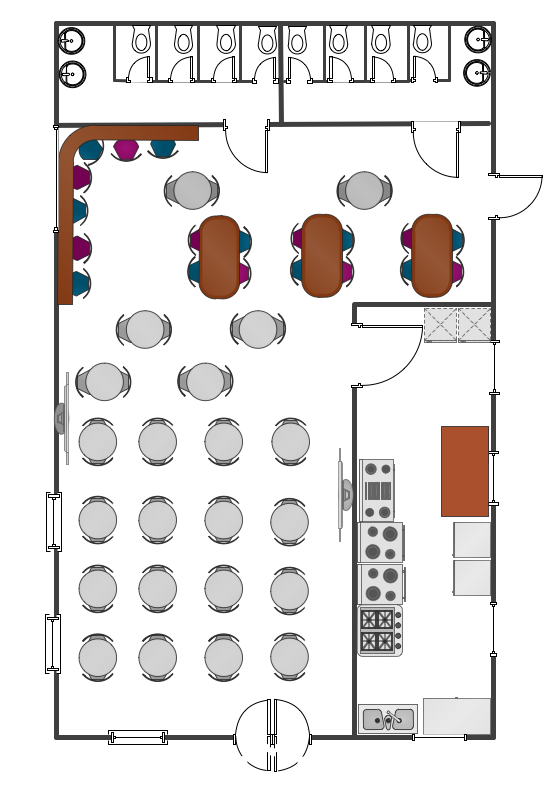
Picture: Cafe Floor Plan. Cafe Floor Plan Examples
Related Solution:
UML Sequence Diagram can be created using ConceptDraw DIAGRAM diagramming software contains rich examples and template. ConceptDraw is perfect for software designers and software developers who need to draw UML Sequence Diagrams.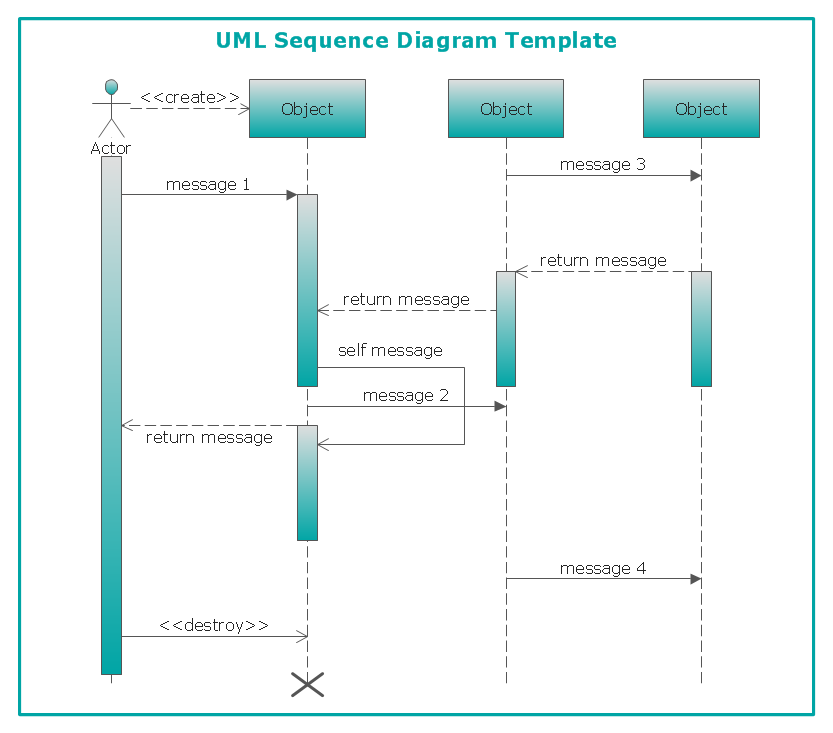
Picture: UML Sequence Diagram
While developing software, it is very important to have a visual model, because it helps to represent the logic and the architecture of an application. Experienced engineers use UML diagrams to denote relationships between classes and their instances. UML is a general language for a set of diagrams like deployment diagrams, object diagrams or use case diagrams.
This diagram represents UML class diagram used for a software system development using an object-oriented method. Class diagrams are categorized as static structure diagrams that depict the physical structure of a system. Class diagram divides a software system's structure into "classes". Classes are defined by the methods and variables of objects. UML Class diagram is used to depict relationships and source code dependencies between objects.
Picture: UML Diagram
Related Solution:
Developing a software project supposes architecture first. To make it proper, you can use data flow diagram model in your current project.
The data flow diagram represents the Model of small traditional production enterprise that is made using Yourdon and Coad notation. It shows how the data is transfered through a process. According to the notation of Yourdon and Coad a process is represented by circles and data stores are drawn using parallel lines. This DFD was created using the ConceptDraw Data Flow Diagrams solution. Using this solution one can visualize data flow accordingly to the rules of two basic notations used for data flow modeling.
Picture: Data Flow Diagram Model
Related Solution:
What is organizational charts and why your business need them? How to use business process diagram software? Explore how advanced organization chart software transforms the way companies ✔️ visualize, ✔️ communicate, and ✔️ streamline their organizational hierarchies
Picture:
What is an Organizational Chart and how it works?
Organization Chart Software
Related Solution:
UML Deployment Diagram depicts the physical deployment of artifacts on nodes (nodes are the existing hardware components, artifacts are the software components running on each node); and how the different pieces are connected.
Use ConceptDraw DIAGRAM with UML deployment diagram templates, samples and stencil library from Rapid UML solution to model the physical deployment of artifacts on nodes of your software system.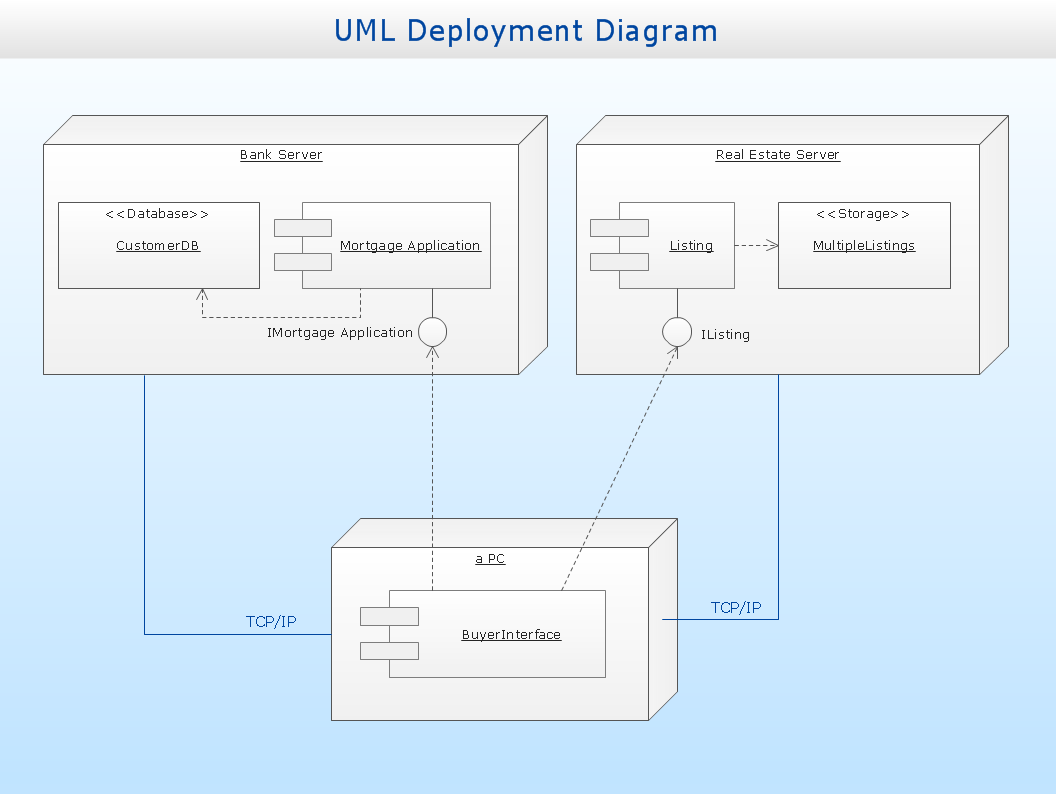
Picture: UML Deployment Diagram
Related Solution:
These libraries of vector objects depict the Site Accessories and Parking and Roads elements. They are needed to draw architectural and landscape plans that show the architectural elements around buildings: parking spaces, hiking and biking trails, drainage systems, lights, and vehicle access control elements. These libraries are included into ConcepDraw solution for Site Planning. Site Accessories and Parking, Roads libraries contain near 40 vector images that will help depict an a surrounding territory at building plans.
These libraries of vector objects depict the Site Accessories and Parking and Roads elements. They are needed to draw architectural and landscape plans that show the architectural elements around buildings: parking spaces, hiking and biking trails, drainage systems, lights, and vehicle access control elements. These libraries are included into ConcepDraw solution for Site Planning. Site Accessories and Parking, Roads libraries contain near 40 vector images that will help depict an a surrounding territory at building plans.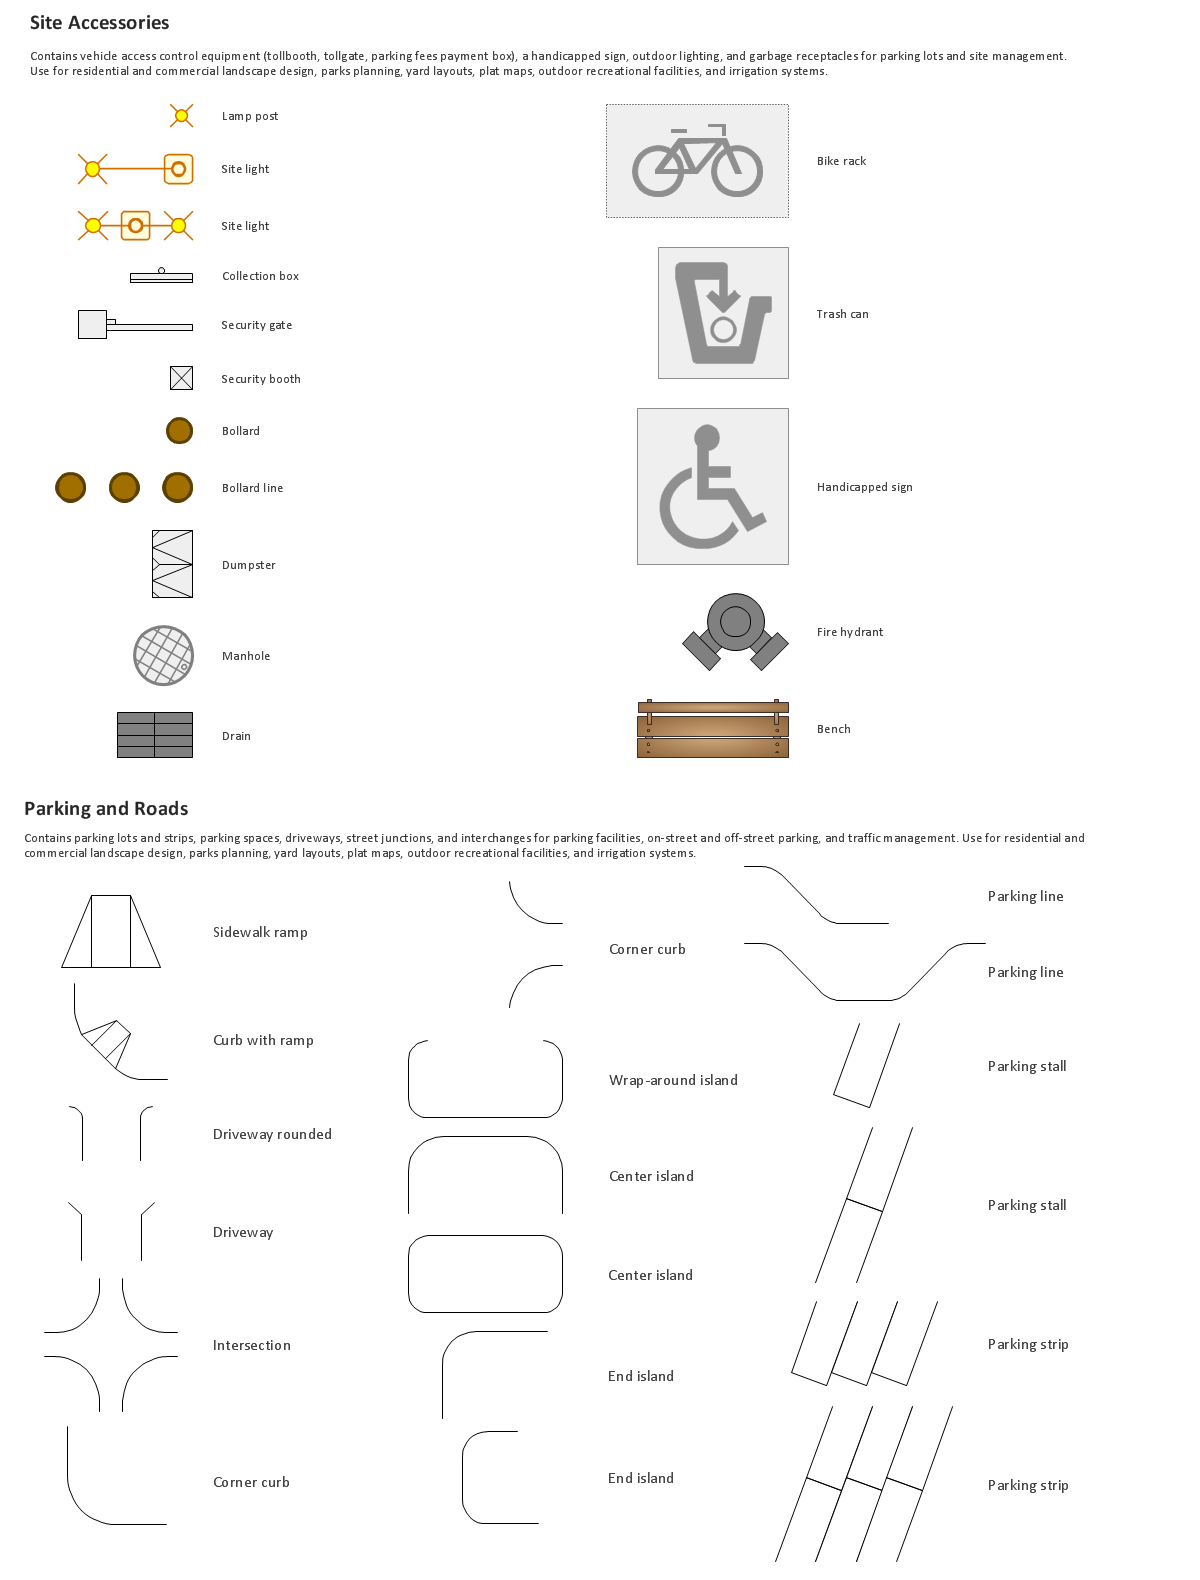
Picture: Building Drawing. Design Element Site Plan
Related Solution:
How to draw pictorial chart quick, easy and effective? ConceptDraw DIAGRAM offers the unique Pictorial Infographics Solution that will help you!
Pictorial Infographics solution contains large number of libraries with variety of predesigned vector pictograms that allows you design infographics in minutes. There are available 10 libraries with 197 vector pictograms.
Picture: How to Draw Pictorial Chart. How to Use Infograms
Related Solution:
Every engineering project starts from a terms of reference document. The next stage of developing is a technical drawing, which requires using appropriate software. However, revisions and discussions about requirements are possible at any stage of development.
This technical drawing demonstrates a schematic flow diagram of pulp reclaiming. This diagram of magnetite pulp reclaiming is created using ConceptDraw Chemical and Process engineering solution, The solution delivers more than 460 vector graphic icons and connectors. Generally, it is intended for designing process and instrumentation diagrams (P&ID) for chemical and process engineering. block flow diagrams (BFD), process flow diagrams (PFD) for chemical industry.
Picture: Technical Drawing Software
Related Solution:
UML Use Case Diagram Taxi Service - This sample was created in ConceptDraw DIAGRAM diagramming and vector drawing software using the UML Use Case Diagram library of the Rapid UML Solution from the Software Development area of ConceptDraw Solution Park.
This sample shows the work of the taxi service and is used by taxi stations, by airports, in the tourism field and delivery service.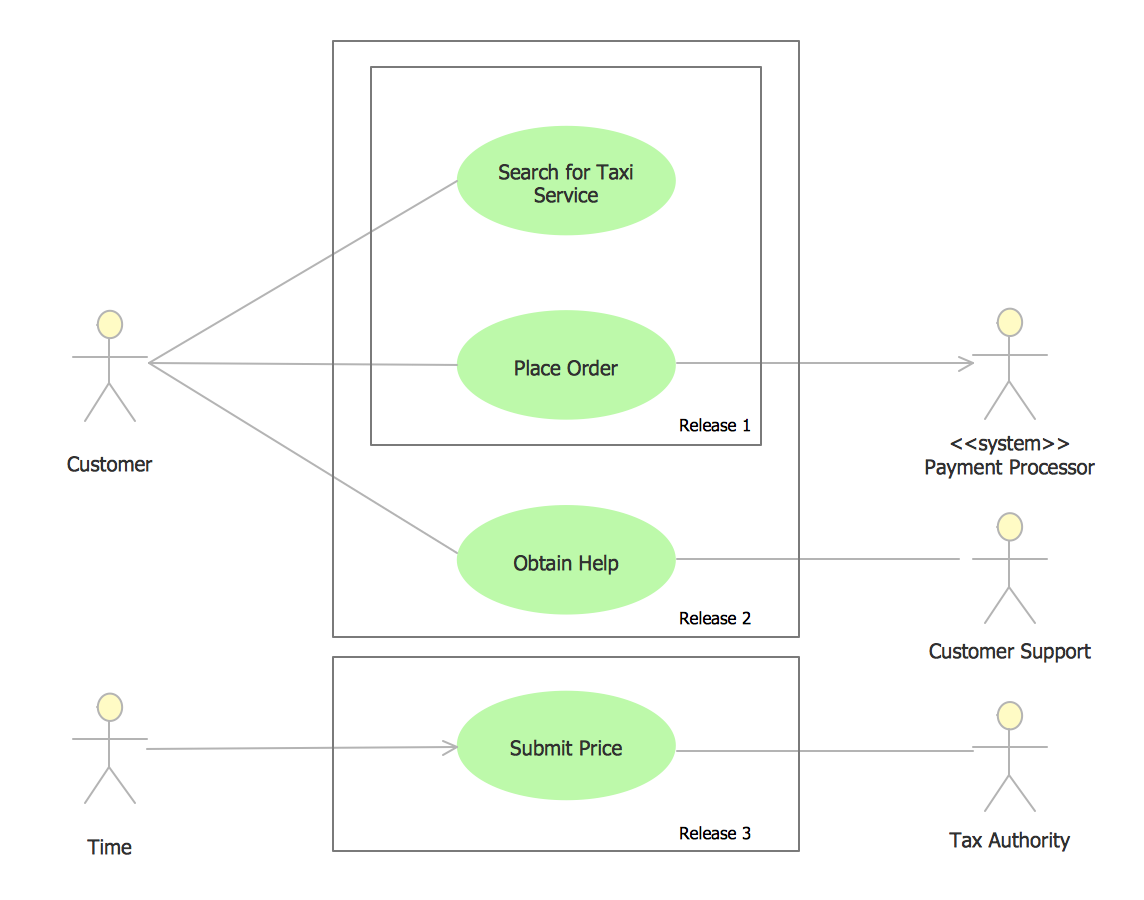
Picture: UML Use Case Diagram Example - Taxi Service
Related Solution: