Made with
ConceptDraw
DIAGRAM 18

Cloud Computing Architecture Diagrams

Cloud Computing


According to the definition of the National Institute of Standards and Technology (NIST): "the Cloud Computing is a model for enabling ubiquitous, convenient, on-demand network access to a shared pool of configurable computing resources (e.g., networks, servers, storage, applications, and services) that can be rapidly provisioned and released with minimal management effort or service provider interaction."

The Cloud computing lets users to have access to the resources, software, and information using any device with access to Internet, at this users pay only for the consumed resources. A cloud model provides three types of services:

  • Infrastructure-as-a-Service (IaaS) that provides processing storage, networks, and other computing resources where the consumer can deploy and run different software;
  • Platform-as-a-Service (PaaS) that offers platform layer resources to build, deploy and deliver applications into the cloud;
  • Software-as-a-Service (SaaS) that provides end-user applications that are running on a cloud infrastructure.

A Cloud can have one of four types of access:

  • Public Cloud - allows systems and services to be easily accessible to the general public;
  • Private Cloud - allows systems and services to be accessible within an organization;
  • Community Cloud - allows systems and services to be accessible by group of organizations;
  • Hybrid Cloud - is combination of public, private and community cloud.
Cloud Computing Architecture Diagrams *

Example 1. Cloud Computing


Cloud Computing Architecture


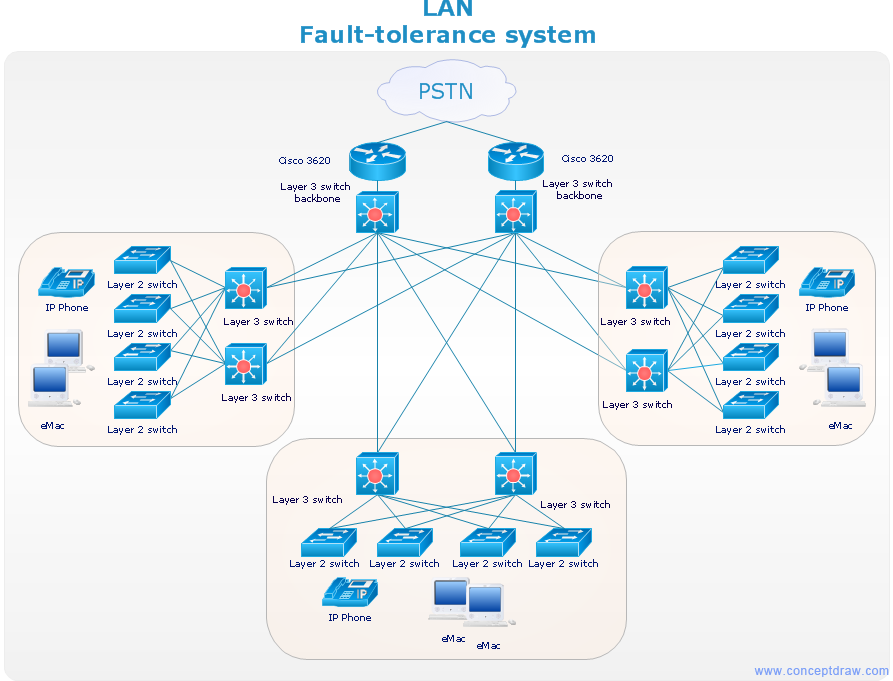
The Cloud Computing Architecture is the configuration of the system that involves local and cloud resources, services, middleware and software, cloud clients and cloud storages, networks, geo-location. Note that the Cloud Computing Architecture is based on the needs of the end-user - the cloud consumer and describes how all these components are arranged and related.

Cloud Computing Architecture

Example 2. Cloud Computing Architecture


Cloud Computing Architecture Diagram


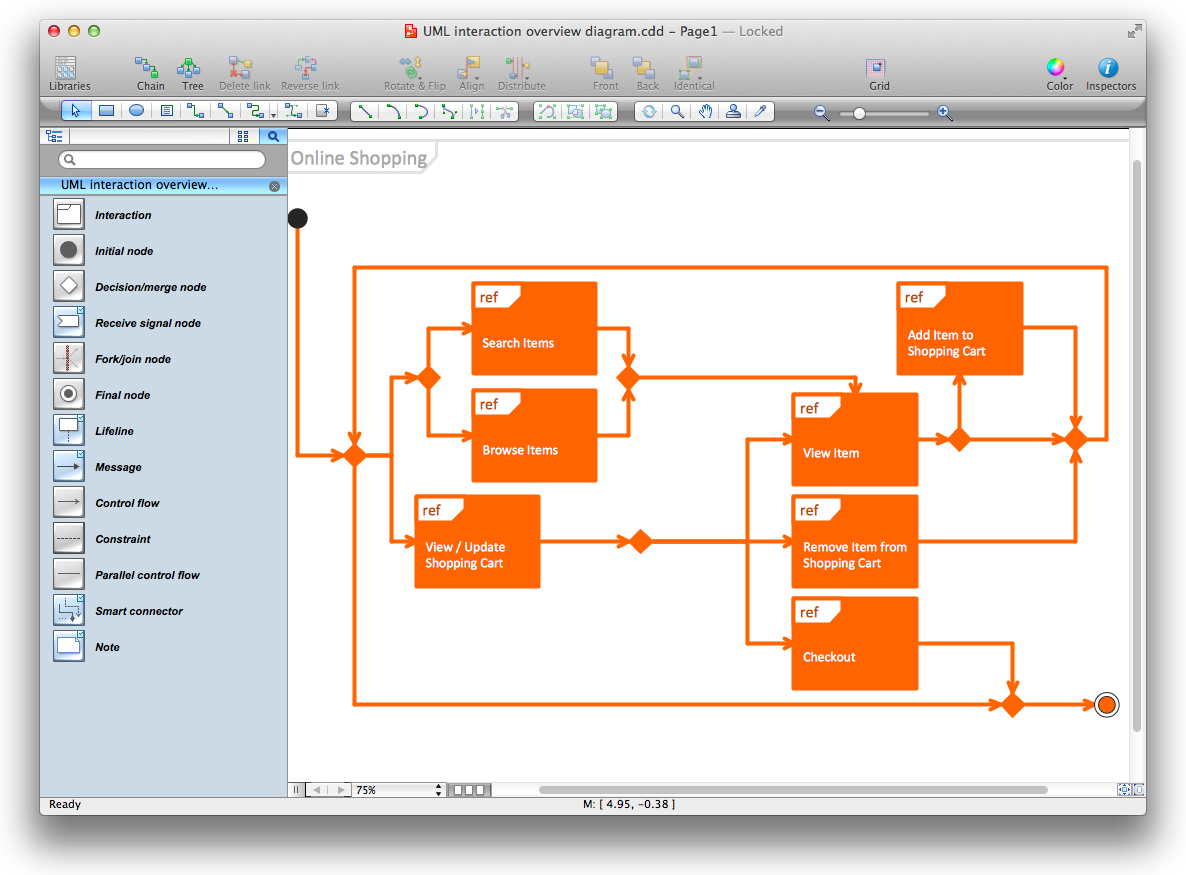
For documenting the Cloud Computing Architecture with a goal to facilitate the communication between stakeholders are successfully used the Cloud Computing Architecture diagrams. Each Cloud Computing Architecture diagram visually depict the cloud components and relationships between them.

It is convenient and easy to draw various Cloud Computing Architecture diagrams in ConceptDraw DIAGRAM software with help of tools of the Cloud Computing Diagrams Solution from the Computer and Networks Area of ConceptDraw Solution Park.

Cloud Computing Architecture Diagram

Example 3. Cloud Computing Architecture Diagram


Exporting Cloud Computing Architecture Diagrams


The ConceptDraw DIAGRAM software provides powerful export capabilities - you can export your diagrams to a number of useful and popular file formats. Thus you can export the diagrams to Microsoft PowerPoint (PPT), Adobe Acrobat (PDF), Microsoft Visio (VDX, VSDX), and many other formats.

Cloud Computing Architecture Diagram PPT

Example 4. Cloud Computing Architecture Diagram PPT

All exporting commands are available at ConceptDraw DIAGRAM from the File menu. You can immediately apply them when your diagram is ready.

Cloud Computing Architecture PDF

Example 5. Cloud Computing Architecture PDF

The possibility of exporting diagrams to various formats gives to ConceptDraw DIAGRAM users a flexibility when working with other people, because now it's not a problem to collaborate and exchange documents with those who don't have ConceptDraw DIAGRAM software.

Cloud Computing Architecture Visio

Example 6. Cloud Computing Architecture Visio


Benefits of ConceptDraw DIAGRAM Cloud Computing Diagrams software


The following features make ConceptDraw DIAGRAM the best Cloud Computing Diagrams software:

  1. You don't need to be an artist to draw professional looking diagrams in a few minutes.
  2. Large quantity of ready-to-use vector objects makes drawing your diagrams quick and easy.
  3. Extensive collection of pre-designed templates and samples give you a great start for your own diagrams.
  4. ConceptDraw DIAGRAM provides you with the possibility to use the grid, rules and guides. You can easily rotate, group, align, and arrange objects, and use different fonts and colors to make your diagram stand out.
  5. All ConceptDraw DIAGRAM documents are vector graphic files and are available for reviewing, modifying, and converting to a variety of formats: image, HTML, PDF file, MS PowerPoint Presentation, Adobe Flash, MS Visio.
  6. Using ConceptDraw STORE you can navigate through ConceptDraw Solution Park, managing downloads and updates. You can access libraries, templates and samples directly from ConceptDraw STORE.
  7. If you have any questions, our support is free of charge and always ready to come to your aid.


TEN RELATED HOW TO's:
Rack Diagrams visualize the rack mounting of computer and network equipment as the drawing of frontal view of the rack with equipment installed. They are used for choosing the equipment or racks to buy, and help to organize equipment on the racks virtually, without the real installation. Network Diagramming Software - ConceptDraw DIAGRAM is perfect for software designers and software developers who need to draw Rack Diagrams.Network Diagramming Software for Design<br>Rack Diagrams *
Picture: Network Diagramming Software for DesignRack Diagrams
Related Solution:
Data flow diagrams are the graphical tool, used in the visualization of data flow of some data processing systems. It is the valuable process modeling tool. Also designing DFD is the important component of the initial part of any information system development project. The standard symbols are used to represent the interaction of a system components and how various kinds of components influence on data flow. The ConceptDraw Data Flow Diagrams solution is design to assist professional software engineers in making DFDs according to Gane and Sarson, and Yourdon and Coad notations. Do you imagine yourself as a successful IT specialist? To your mind, they all use data flow diagram examples to learn and to get inspired. Aren’t you still with us?Data Flow Diagram Examples *
Picture: Data Flow Diagram Examples
Related Solution:
The Venn diagram example below shows sustainable development at the confluence of three constituent parts. Create your Venn diagrams for problem solving in environmental social science using the ConceptDraw DIAGRAM software.Venn Diagram Examples for Problem Solving - Human Sustainability Confluence
Picture:
Venn Diagram Examples for Problem Solving
Environmental Social Science
Human Sustainability Confluence
Related Solution:
Want to create Diagrams for Amazon Web Services architecture? ConceptDraw Solution Park with AWS architecture Solution will help you!How To create Diagrams for Amazon Web Services architecture *
Picture: How To create Diagrams for Amazon Web Services architecture
Electrical plan is a document that is developed during the first stage of the building design. This scheme is composed of conventional images or symbols of components that operate by means of electric energy. To simplify the creation of these schemes you can use house electrical plan software, which will not require a long additional training to understand how to use it. You only need to install the necessary software ant it’s libraries and you’ll have one less problem during the building projection. Any building contains a number of electrical systems, including switches, fixtures, outlets and other lightening equipment. All these should be depicted in a building electrical plans and included to general building documentation. This home electrical plan displays electrical and telecommunication devices placed to a home floor plan. On the plan, each electrical device is referenced with the proper symbol. Electrical symbols are used for universal recognition of the building plan by different persons who will be working on the construction. Not all possible electric symbols used on a certain plan, so the symbols used in the current home plan are included to a legend. The electrical home plan may be added as a separate document to a complete set of building plans.House Electrical Plan Software
Picture: How To use House Electrical Plan Software
Related Solution:
What is a computer network? This is a set of devices and systems that are connected to each other (logically or physically) and communicate with each other. This could include servers, computers, phones, routers, and so on. The size of this network can reach the size of the Internet, and can consist of only two devices connected by a cable. This sample shows the connection scheme of the home WLAN equipment to the Internet.Diagram of a Basic Computer Network
Picture: Diagram of a Basic Computer Network. Computer Network Diagram Example
Related Solution:
This sample was created in ConceptDraw DIAGRAM software using the Flowcharts solution.Copying Service Process Flowchart. Flowchart Examples
Picture:
Copying Service Process Flowchart.
Flowchart Examples
Related Solution:
Creating CCTV system diagrams is quick and easy with ConceptDraw DIAGRAM diagramming software enhanced with Audio, Video, Media solution from ConceptDraw Solution Park. It contains library of vector cliparts of video and TV devices and different digital gadgets for drawing this kind of diagrams.CCTV Surveillance System Diagram. CCTV Network Diagram Example *
Picture: CCTV Surveillance System Diagram. CCTV Network Diagram Example
Related Solutions:
This sample was created in ConceptDraw DIAGRAM diagramming and vector drawing software using the Basic Diagramming Solution from the Universal Diagramming area of ConceptDraw Solution Park. This sample shows the household moving checklist. It's very important to make the checklist of the things when you move from one house to another. When you have the checklist your moving will be easy and simple, and you will not forget anything.Household Moving Checklist *
Picture: Household Moving Checklist
Related Solution:
When used in different areas, flowcharts use specific symbols to depict different elements. ConceptDraw DIAGRAM offers libraries of symbols for many areas. One of such libraries is flowchart symbols accounting, which provides symbols for accounting diagrams. Activity-based costing calculates the costs of all products and services based on activities in an organization. A type of accounting flowchart that shows how costs are assigned to products with resources and activities is called Activity-based costing (ABC) flowchart. It can be designed in a digital drawing software such as ConceptDraw DIAGRAM. Here is an accounting flowchart template and symbols. These flowchart symbols are applied for making accounting flow charts in ConceptDraw DIAGRAM and with its Accounting Flowcharts solution. An accounting flowchart is a specific type of a flow diagram. Practically a number of flowchart-type diagrams commonly utilized to clarify many parts of an accounting department working process. Accounting flowchart assists a process of preparing accounting documentation. It shows who responsible for implementation of each step in the workflow of accounting department.Flowchart Symbols Accounting. Activity-based costing (ABC) flowchart
Picture:
Flowchart Symbols Accounting
Activity-based costing (ABC) flowchart
Related Solution:
ConceptDraw
DIAGRAM 18