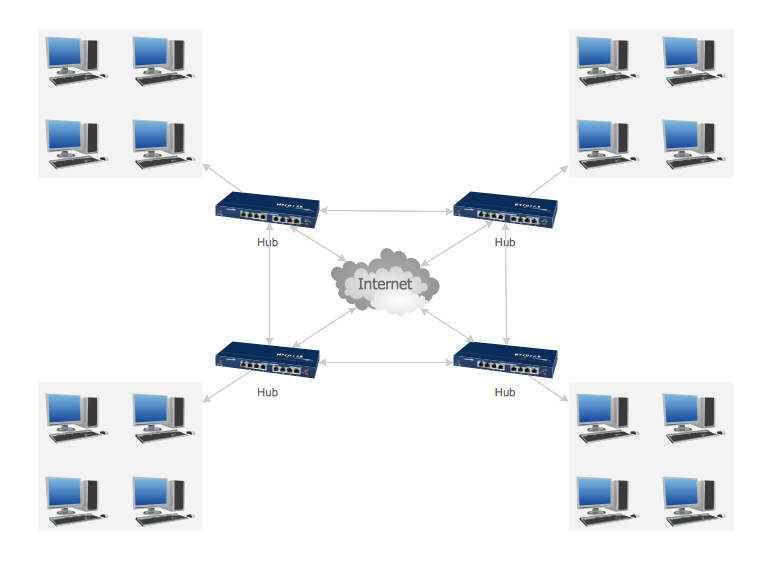
Example 1. Grid Network Topology
On this sample is represented the grid network topology.
The grid network topology is a type of the network topology in which the each node of the network is connected with two neighboring nodes along one or more dimensions. If the chain of nodes has the circular form and the network is one-dimensional, the topology is named the Ring. The topology with n-dimensional grid network with circularly connection of the nodes is named the Torus.
Using the Computer and Networks Solution for ConceptDraw DIAGRAM you can create your own professional Computer Network Diagrams quick and easy.
The Computer Network Diagrams produced with ConceptDraw DIAGRAM are vector graphic documents and are available for reviewing, modifying, and converting to a variety of formats (image, HTML, PDF file, MS PowerPoint Presentation, Adobe Flash or MS Visio).
See also Samples:
SEVEN RELATED HOW TO's:
Using the predesigned objects, templates and samples of the Computer and Networks Solution for ConceptDraw DIAGRAM you can create your own professional Computer Network Diagrams quick and easy.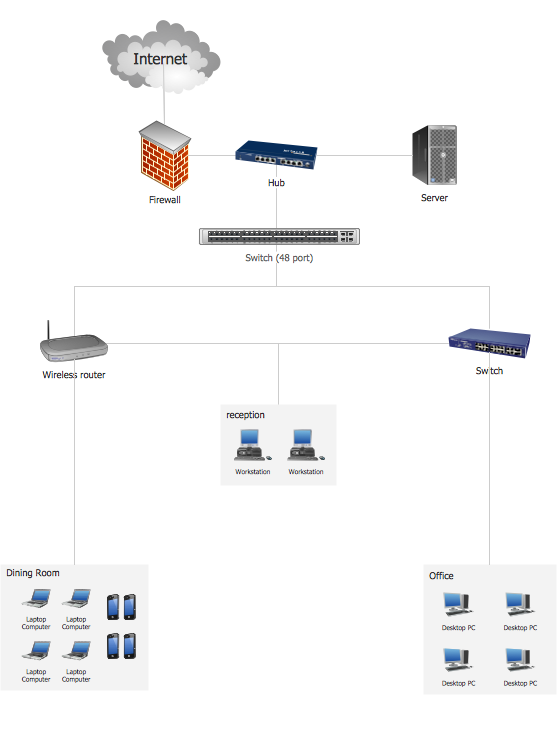
Picture: Hotel Network Topology
Related Solution:
Near field communication (NFC) is a wireless communication technology that allows smartphones and other similar devices to establish the radio communication with each other on the short distance around 10 centimeters (4 inches).
This example was created in ConceptDraw DIAGRAM using the Computer and Networks Area of ConceptDraw Solution Park and shows the Near field communication (NFC) network.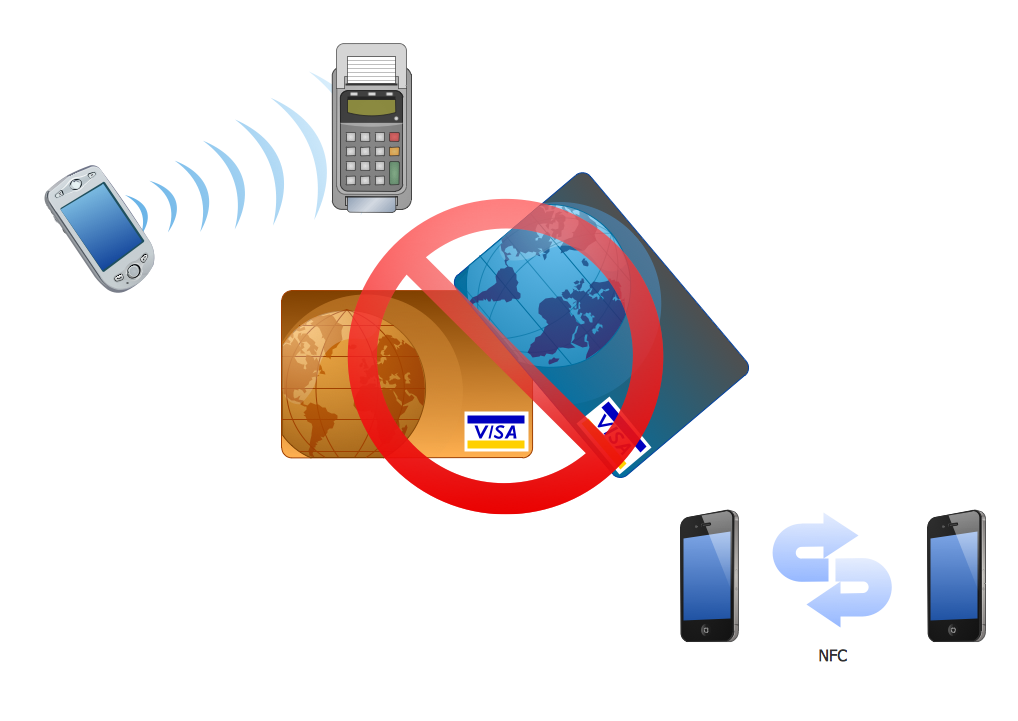
Picture: Near field communication (NFC). Computer and Network Examples
Related Solution:
Computer networks nowadays are spread all across the world. The large number of parameters, such as geographic scale or communication protocols, can divide networks. One of the most common types of networks is called local area network (LAN). It convenient to represent network examples by means of diagrams.
This local area network (LAN) diagram provides an easy way to see the way the devices in a local network are interacted. The diagram uses a library containing specific symbols to represent network equipment , media and the end-user devices such as computers (PC, mac, laptop) , network printer, hubs, server and finally a modem. There are two types of network topologies: physical and logical. The current diagram represents precisely a physical type of LAN topology because it refers to the physical layout of a local network equipment.
Picture:
What is a Local Area Network?
Examples of LAN Diagrams
Related Solution:
A Virtual network is a computer network that consists of virtual network links, i.e. between the computing devices there isn't a physical connection.
Well known forms of network virtualization are virtual networks based on the virtual devices (for example the network based on the virtual devices inside a hypervisor), protocol-based virtual networks (VLAN, VPN, VPLS, Virtual Wireless network, etc.) and their combinations.
This example was created in ConceptDraw DIAGRAM using the Computer and Networks Area of ConceptDraw Solution Park and shows the Virtual network.
Picture: Virtual networks. Computer and Network Examples
Related Solution:
Mind map that can be useful for organizing a daily schedule.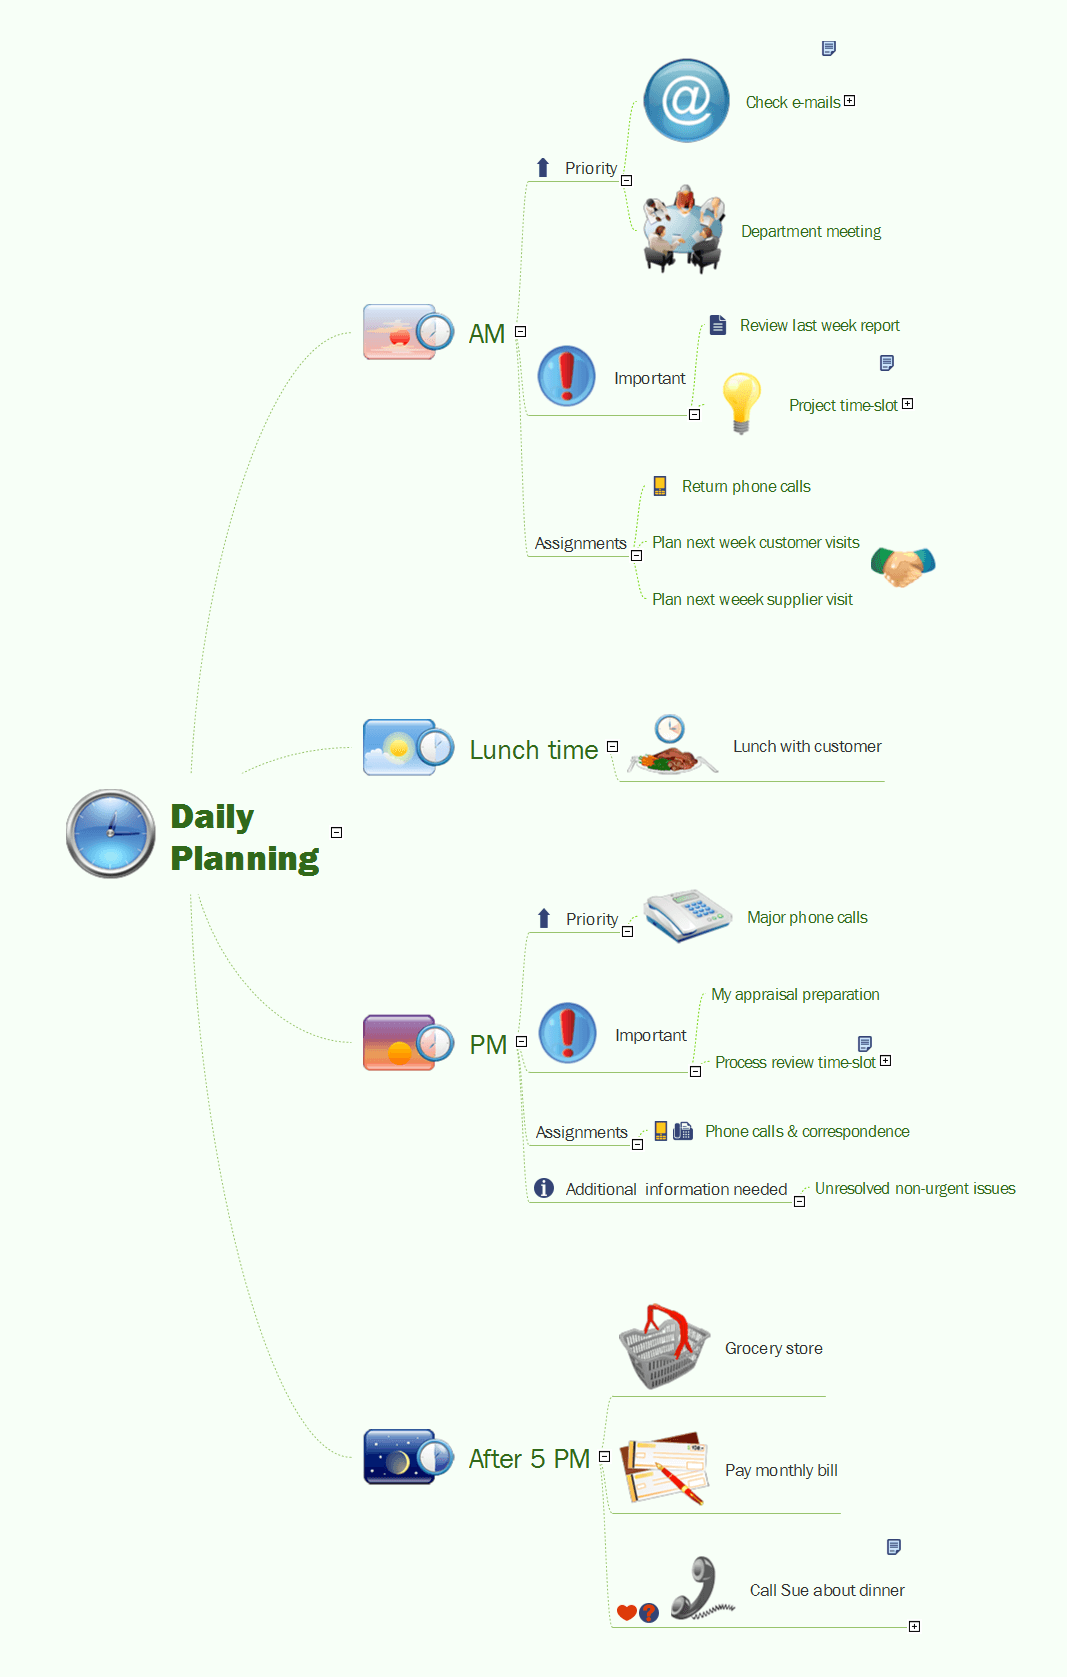
Picture: Daily Planning
Related Solution:
While creating flowcharts and process flow diagrams, you should use special objects to define different statements, so anyone aware of flowcharts can get your scheme right. There is a short and an extended list of basic flowchart symbols and their meaning. Basic flowchart symbols include terminator objects, rectangles for describing steps of a process, diamonds representing appearing conditions and questions and parallelograms to show incoming data.
This diagram gives a general review of the standard symbols that are used when creating flowcharts and process flow diagrams. The practice of using a set of standard flowchart symbols was admitted in order to make flowcharts and other process flow diagrams created by any person properly understandable by other people. The flowchart symbols depict different kinds of actions and phases in a process. The sequence of the actions, and the relationships between them are shown by special lines and arrows. There are a large number of flowchart symbols. Which of them can be used in the particular diagram depends on its type. For instance, some symbols used in data flow diagrams usually are not used in the process flowcharts. Business process system use exactly these flowchart symbols.
Picture: Flowchart Symbols: Meaning and Examples
Related Solution:
Creating CCTV system diagrams is quick and easy with ConceptDraw DIAGRAM diagramming software enhanced with Audio, Video, Media solution from ConceptDraw Solution Park. It contains library of vector cliparts of video and TV devices and different digital gadgets for drawing this kind of diagrams.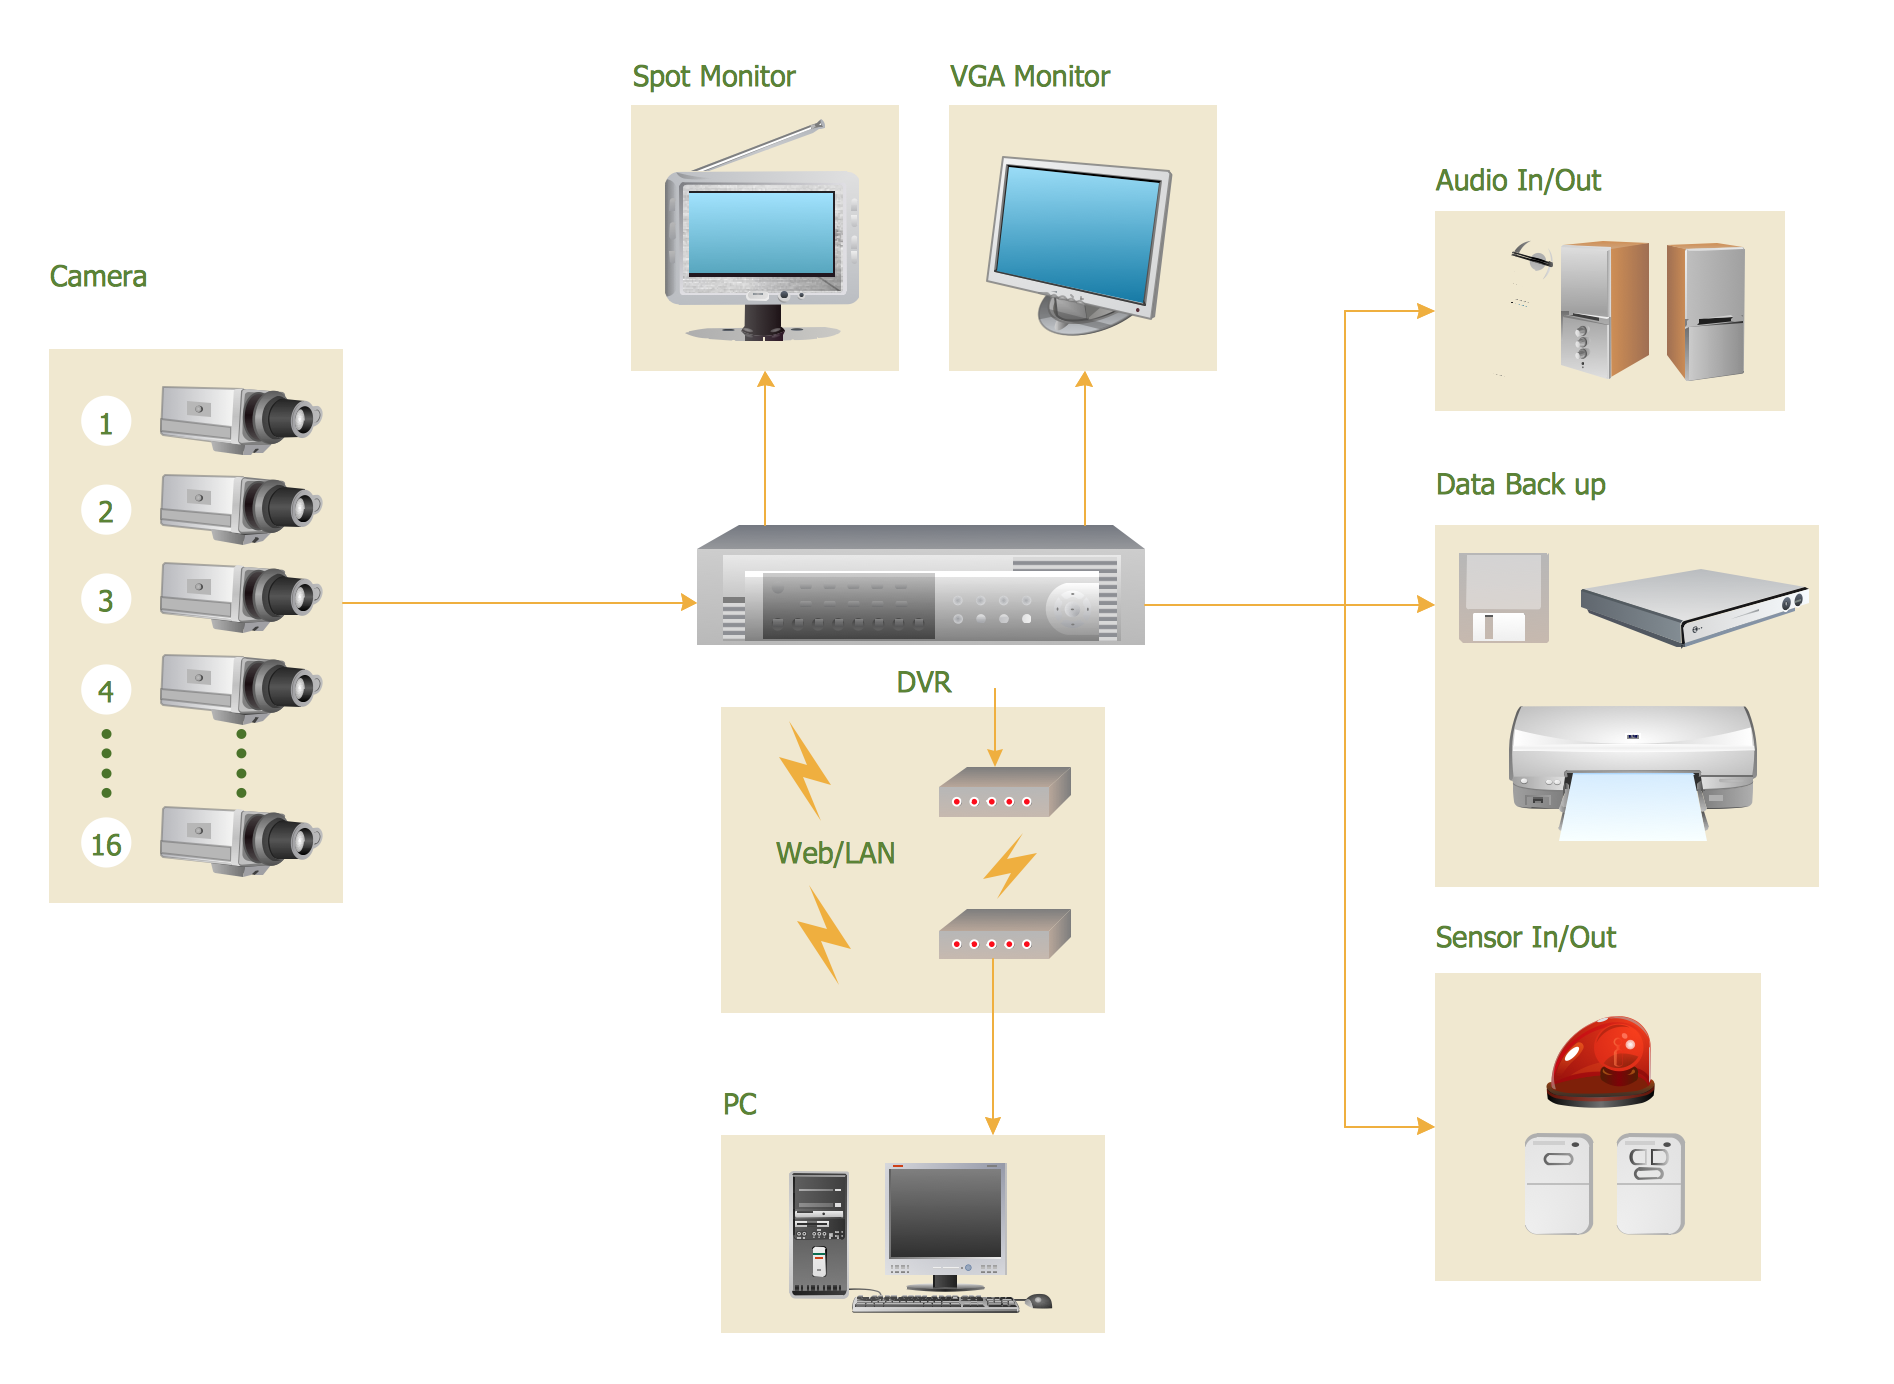
Picture: CCTV Surveillance System Diagram. CCTV Network Diagram Example
Related Solutions: