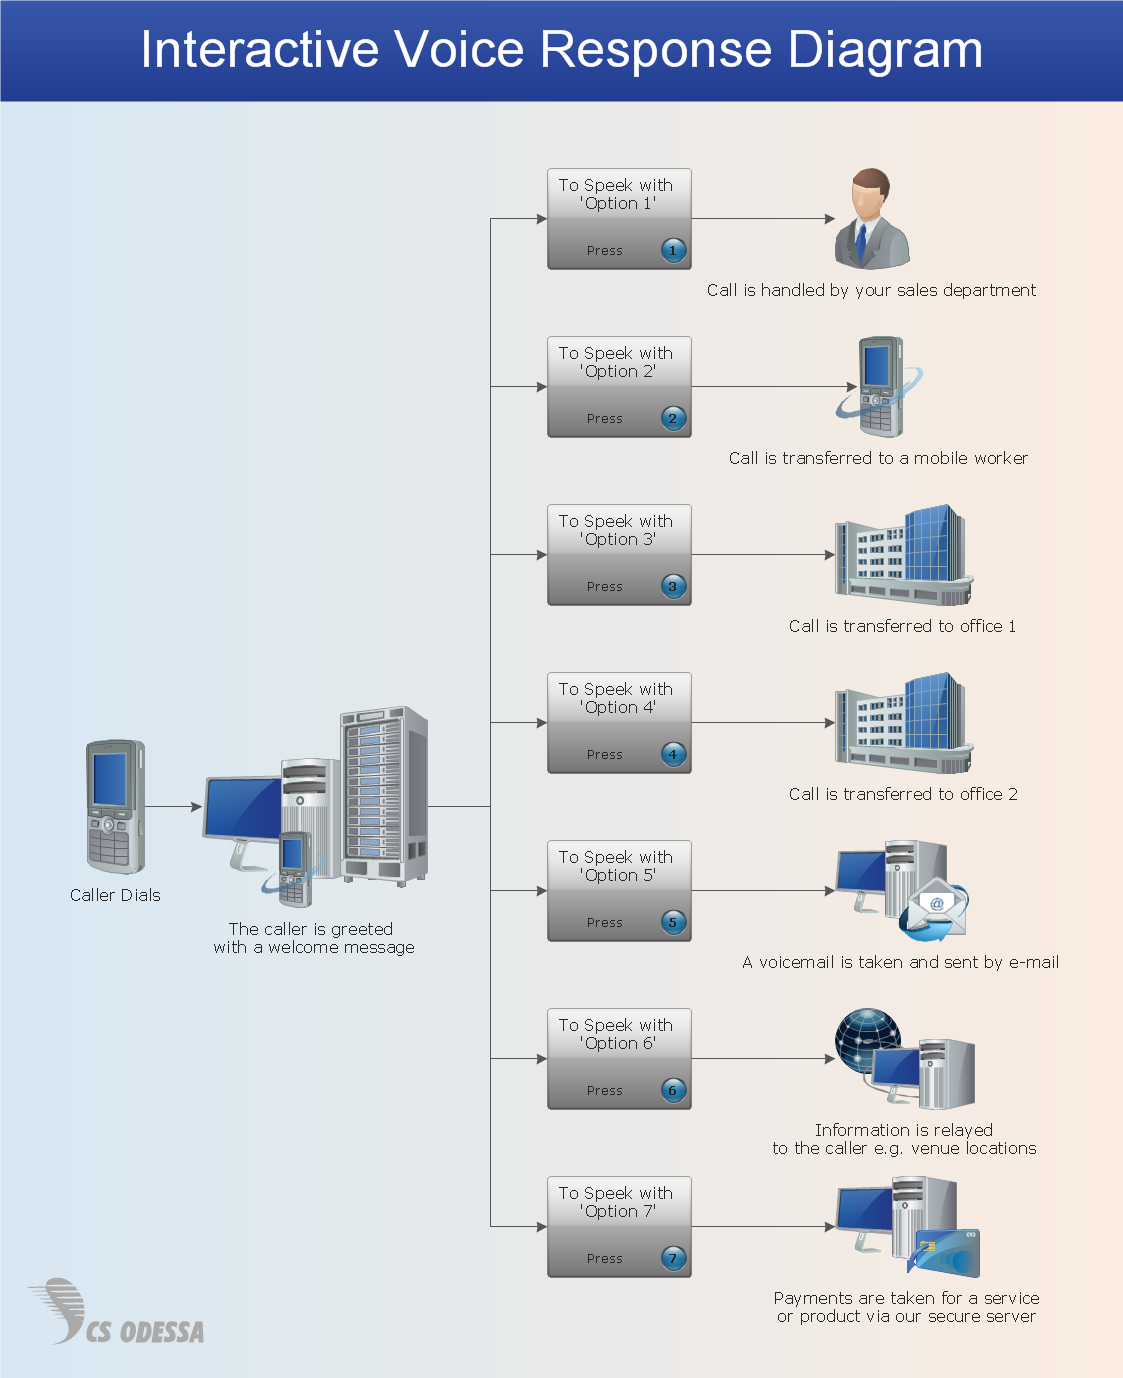
Pic.1. IVR services network diagram.
ConceptDraw solution Computer and Networks provides Interactive Voice Response samples, templates and library of 35 vector stencils for drawing the IVR network diagrams.
Use ConceptDraw DIAGRAM diagramming and vector drawing software enhanced with solution Computer and Networks to visualize the logical and physical structure of IVR systems for inbound and outbound call centers and voice mail systems.
NINE RELATED HOW TO's:
Mind Map Food - This sample was created with ConceptDraw MINDMAP mind mapping software.
This sample shows the mind map about the such fast food as Hamburger. This sample narrates about the hamburger’s history, ingredients and preparation. You can use this sample at the cooking, in the fast food cafes, on the factories of the fast preparation products.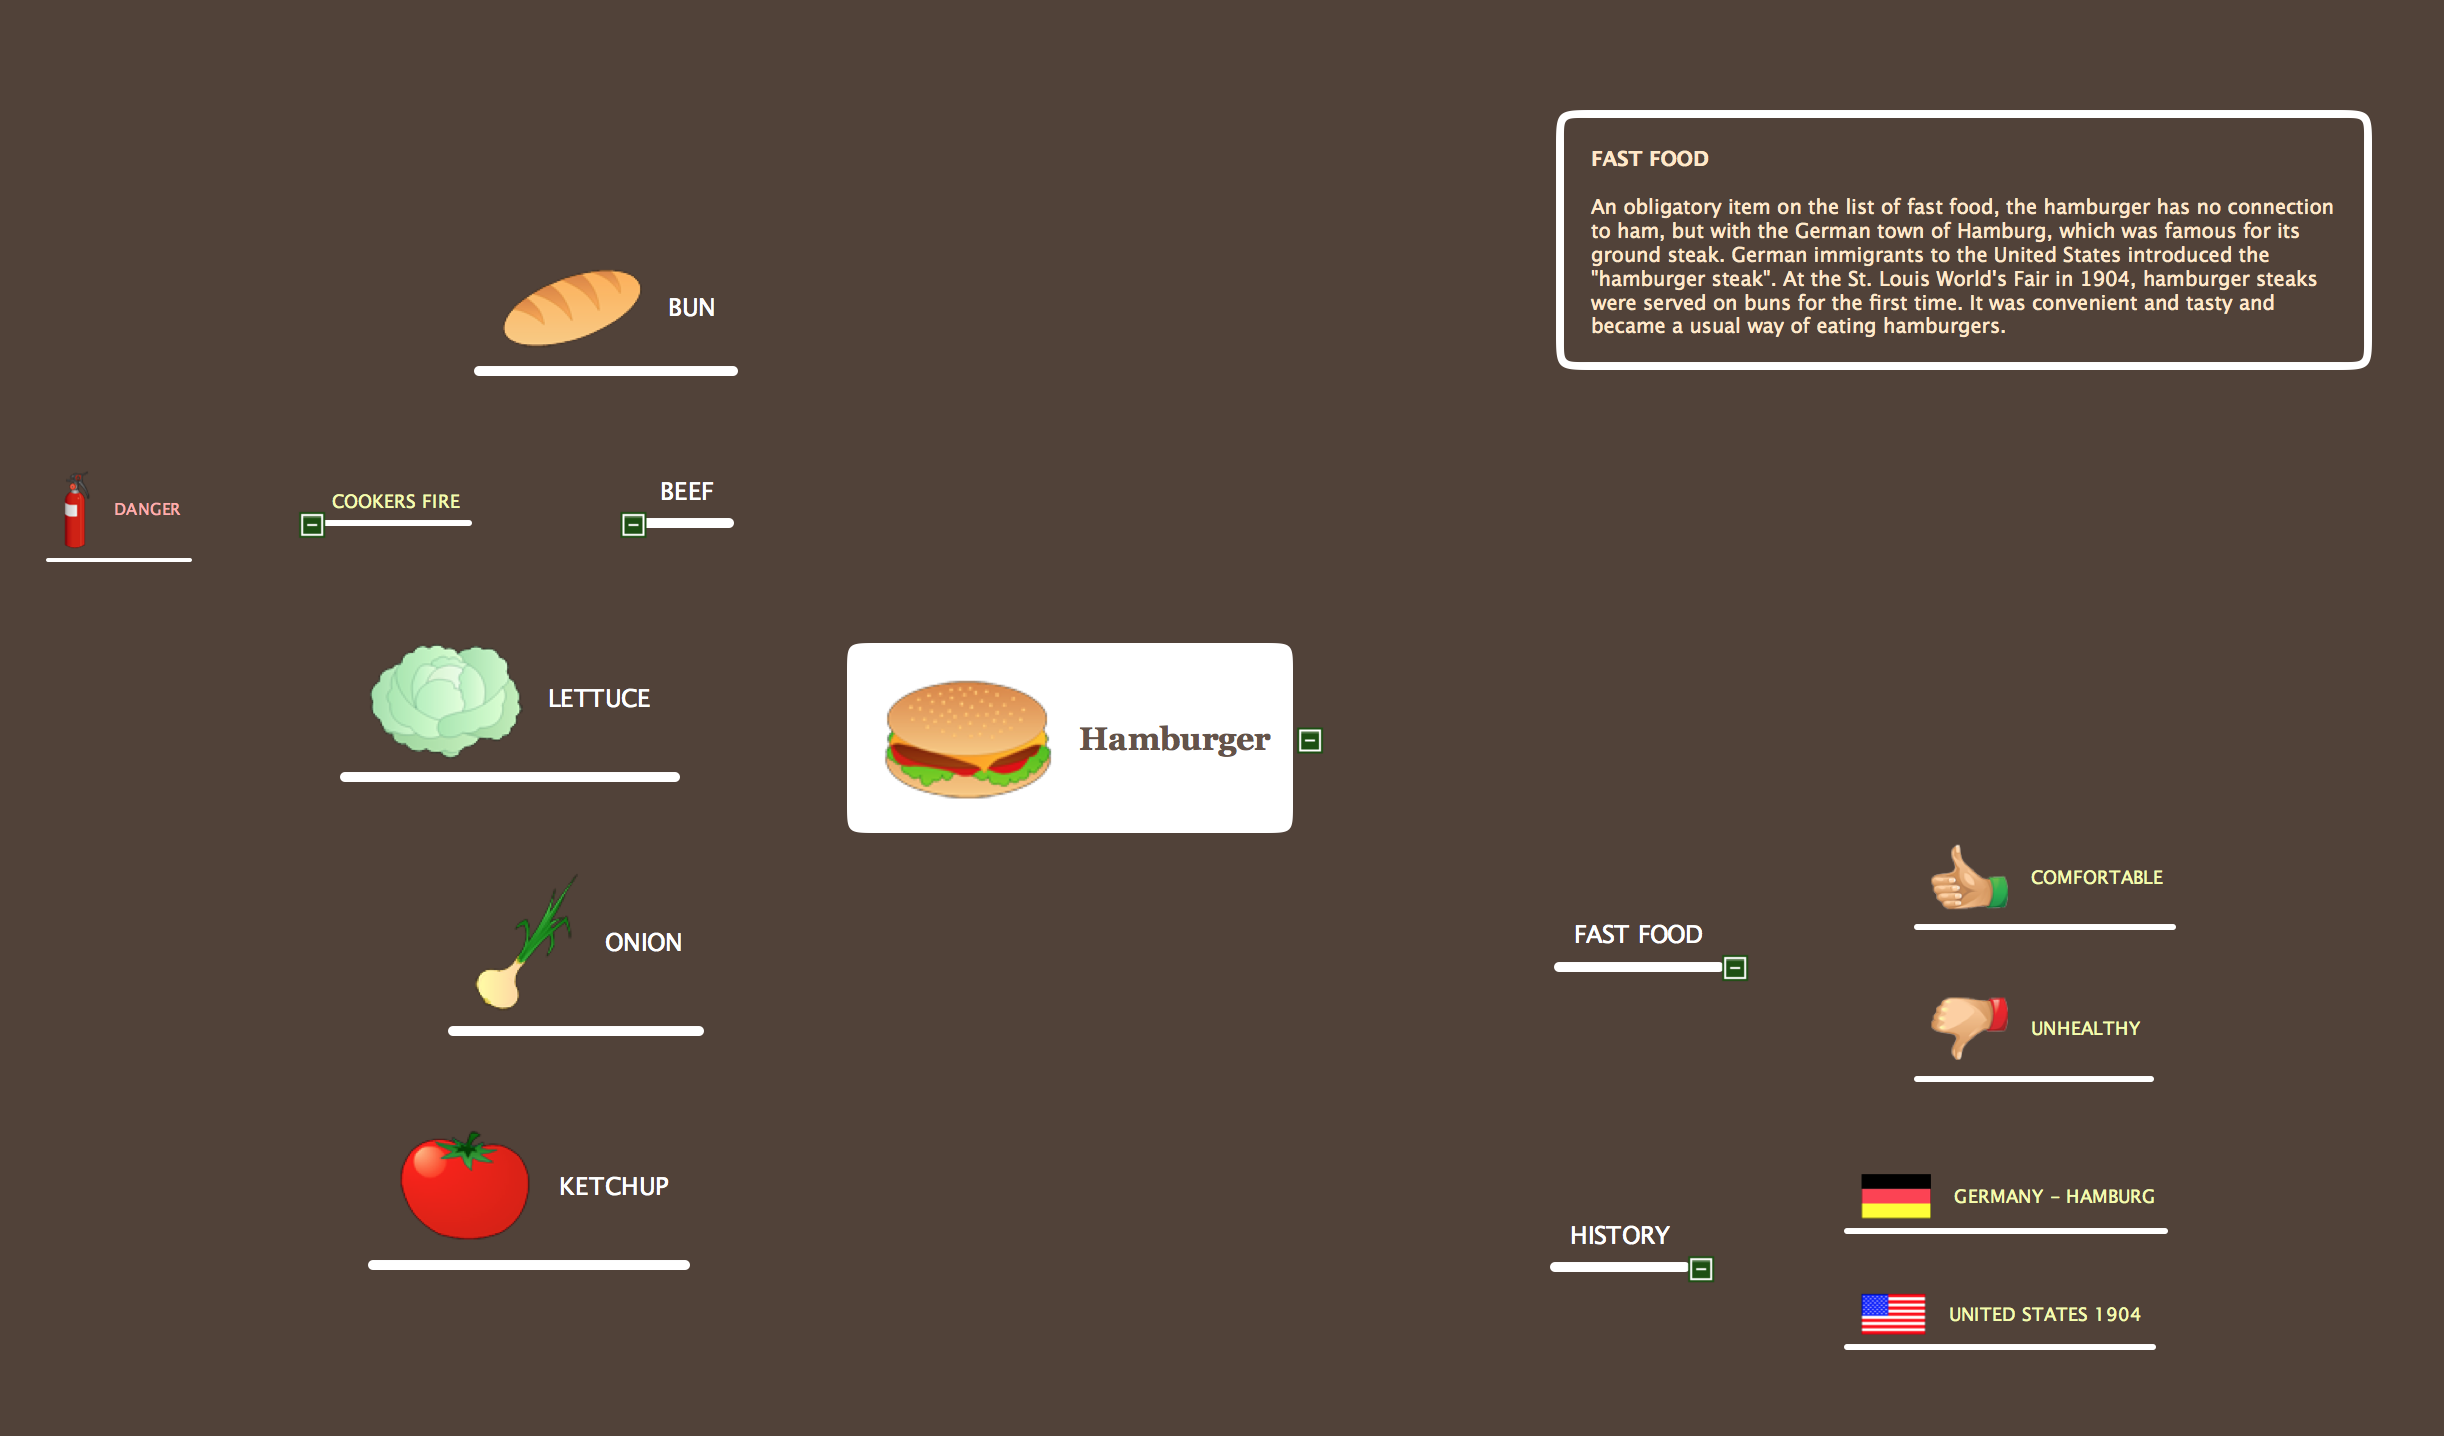
Picture: Mind Map Food
Related Solution:
No need for any special drawing skills to create professional looking diagrams outside of your knowledge base. ConceptDraw DIAGRAM takes care of the technical details, allowing you to focus on your job, not the drawing.
ConceptDraw DIAGRAM delivers full-functioned alternative to MS Visio. ConceptDraw DIAGRAM supports import of Visio files. ConceptDraw DIAGRAM supports flowcharting, swimlane, orgchart, project chart, mind map, decision tree, cause and effect, charts and graphs, and many other diagram types.
Picture: MS Visio Look a Like Diagrams
Software-Defined Networking (SDN) is a new powerful concept for decision these problems. SDN proposes to disaggregate the traditional networking stacks that are vertically integrated to customize the network operations for specialized environments and improve network service velocity.
On this example you can see the Software-Defined Networking (SDN) diagram that was created in ConceptDraw DIAGRAM using the Computer and Networks Area of ConceptDraw Solution Park.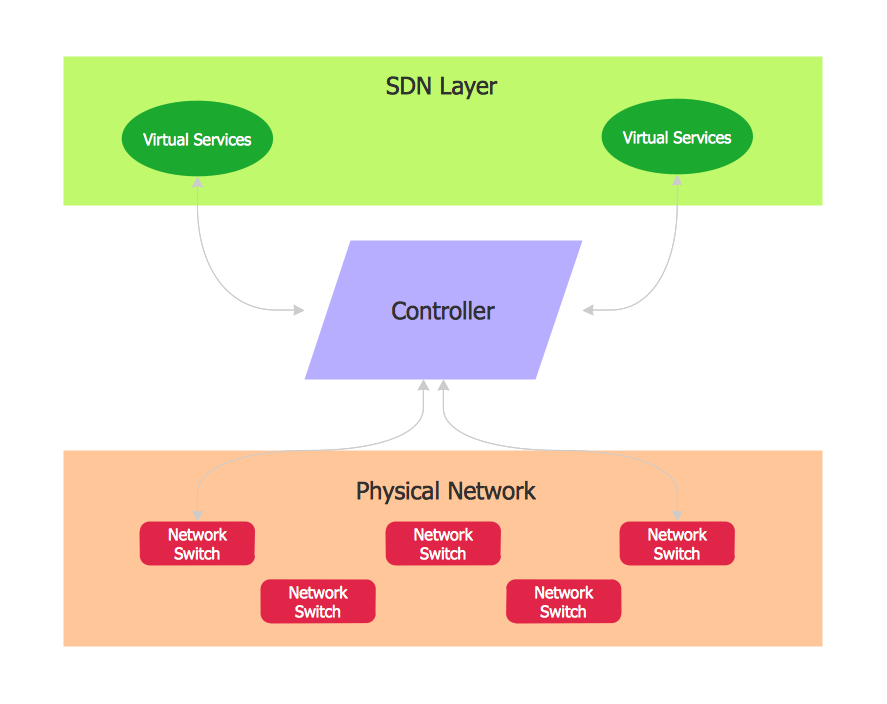
Picture: Software Defined Networking System Overview
Related Solution:
A network diagram is used to depict the topology of a computer network or, talking more broadly, any telecommunications network in general. In order for a computer network diagram to be understandable, clearly identifiable icons must be used for each network appliance. Cisco network templates, also called Network Topology Icons, is a brand of symbols developed and used by Cisco. Since Cisco Systems is the largest networking company in the world, it's list of networking symbols is widely recognized and exhaustive.
The diagram of the ISG network topology diagram illustrates the Cisco Intelligent Services Gateway. Since Cicso company offers service providers a possibility to provide control of state and resources in a broadband network, network architects and engineers need some facilities to create ISG topology diagrams.This Cisco ISG network diagram was created in ConceptDraw DIAGRAM using its solution for Cisco network diagrams. The vector library of this solution comprises over 500 icons of Cisco hardware and accessories. They can be used to design LAN, WAN, ISG and other Cisco equipped network diagrams.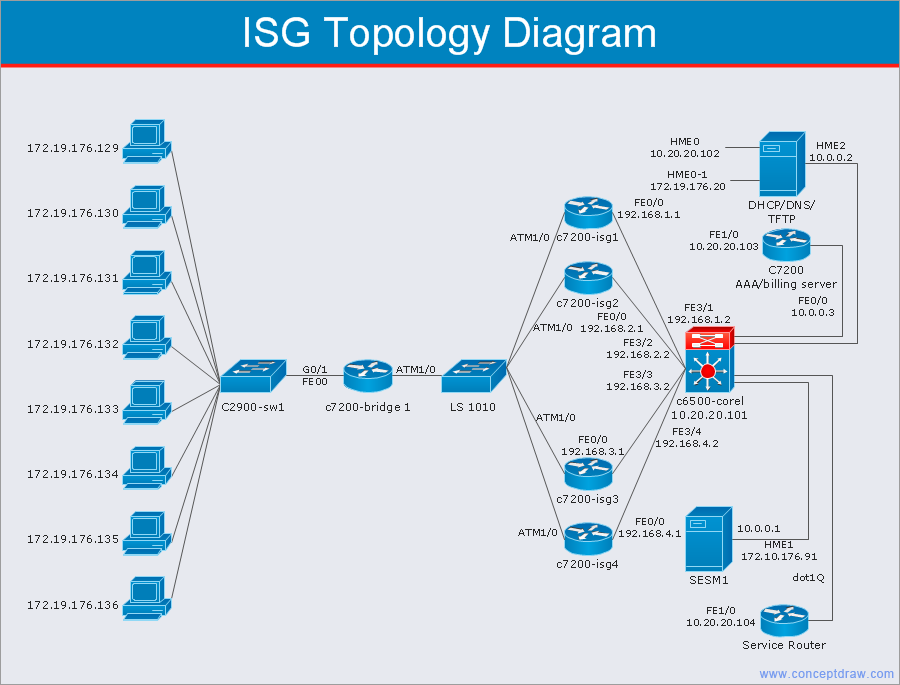
Picture: Cisco Network Templates
Related Solution:
Professional software: visualize general system architecture, AWS diagrams are part of architecturing tools provided with ConceptDraw Solution Park.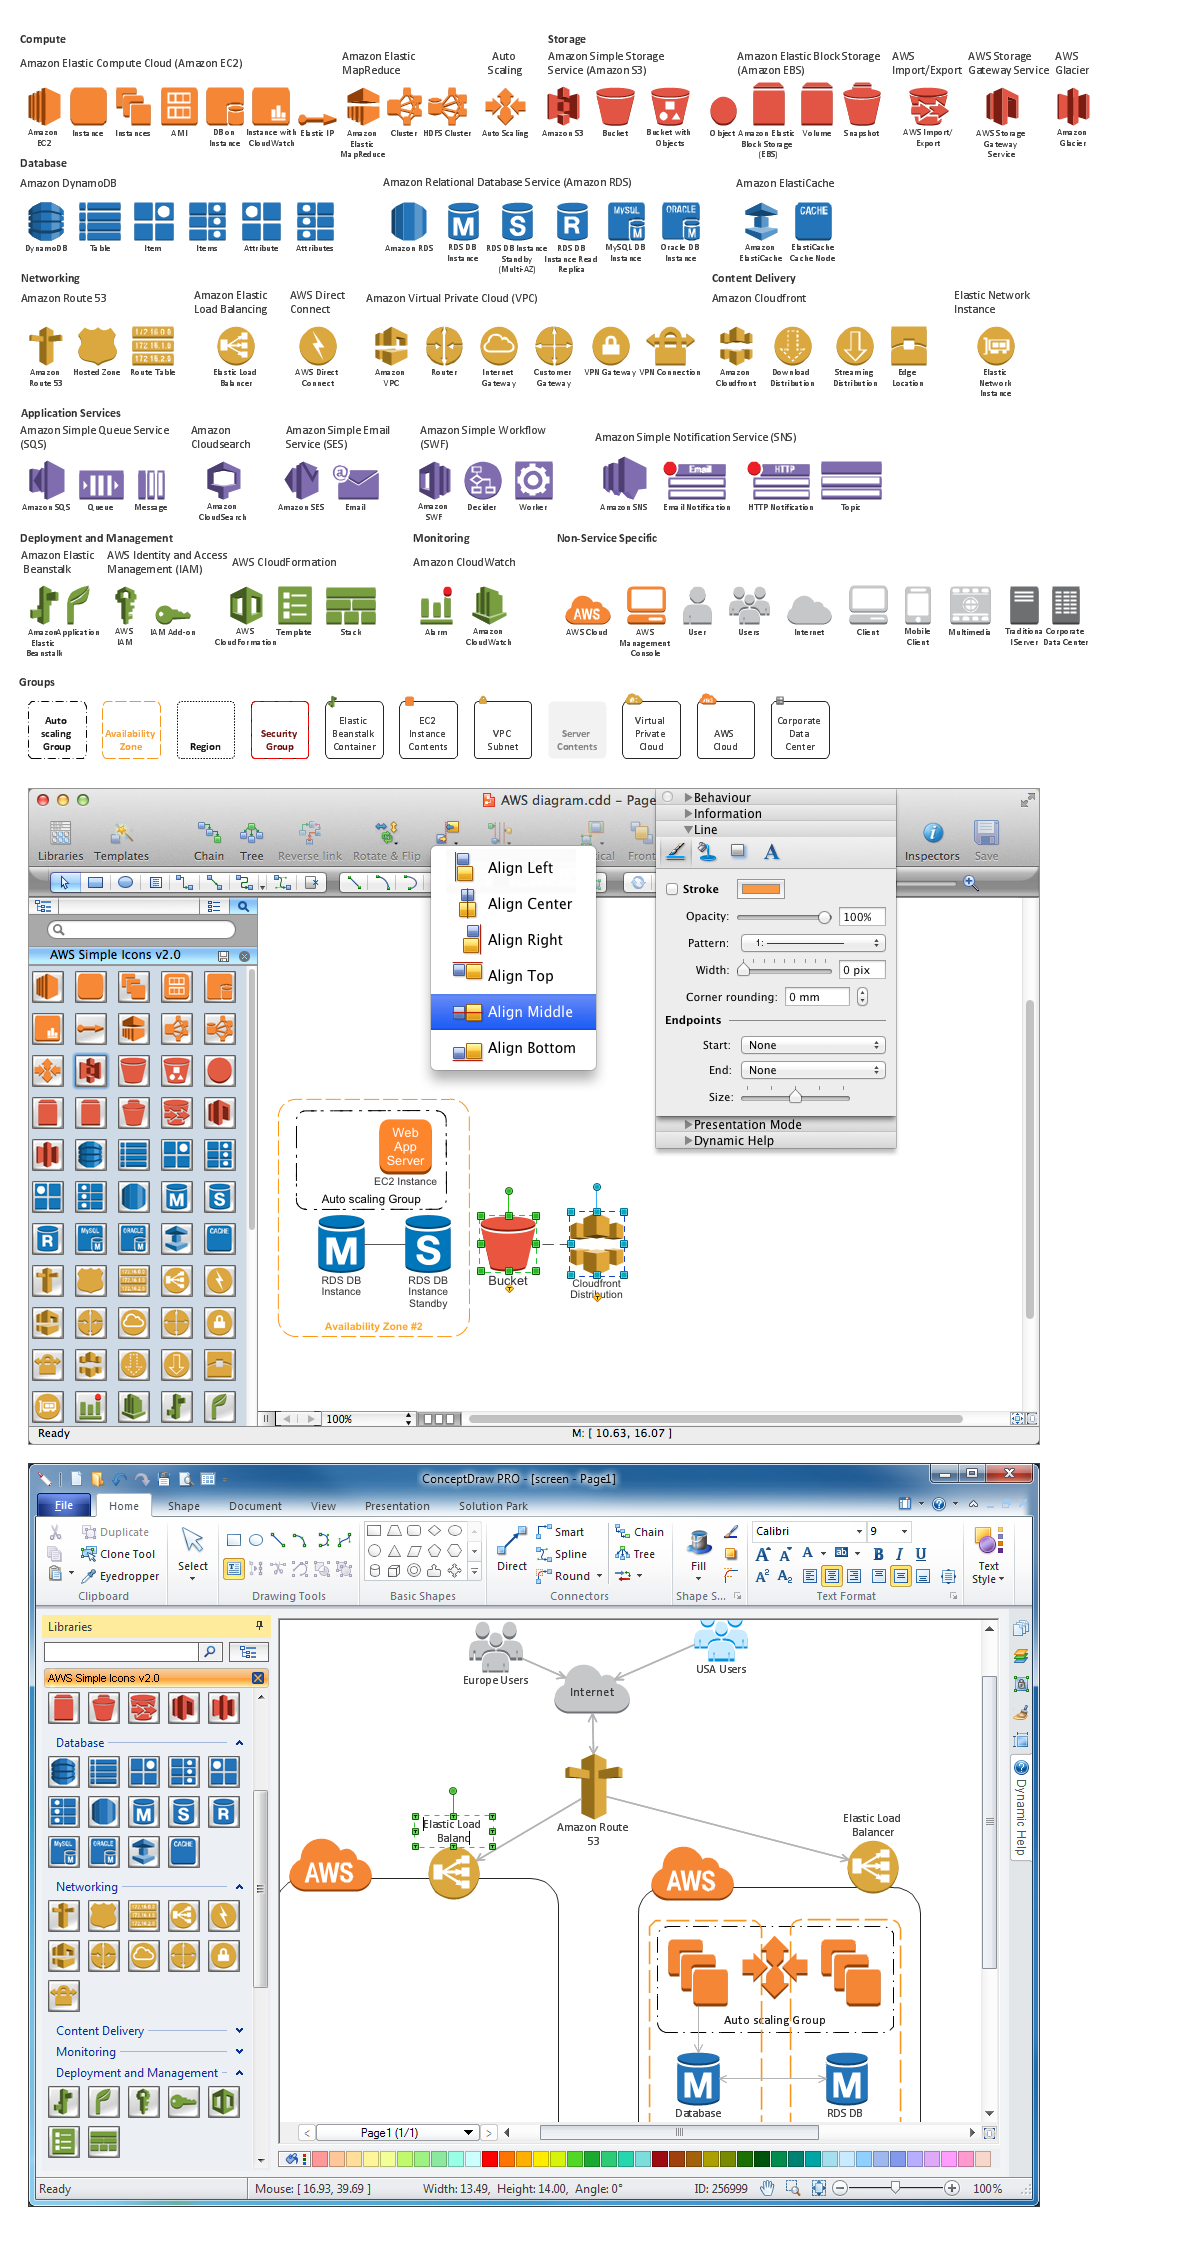
Picture: Diagramming software for Amazon Web Service diagrams, charts and schemes
When studying a business process or system involving the transfer of data, it is common to use a Data Flow Diagram (DFD) to visualize how data are processed. Being initially used exclusively in regards to the flow of data through a computer system, now DFDs are employed as the business modeling tools. They are applied to describe the business events and interactions, or physical systems involving data storage and transfer. ConceptDraw DIAGRAM is a powerful Data Flow Diagram software thanks to the Data Flow Diagrams solution from the Software Development area of ConceptDraw Solution Park.
Picture: Data Flow Diagram Software
Related Solution:
Physical network represents the computer network topology that includes the computer devices, location and cable installation. Physical network includes the actual nodes, segments and hosts.
This example was created in ConceptDraw DIAGRAM using the Computer and Networks Area of ConceptDraw Solution Park and shows the Physical star network.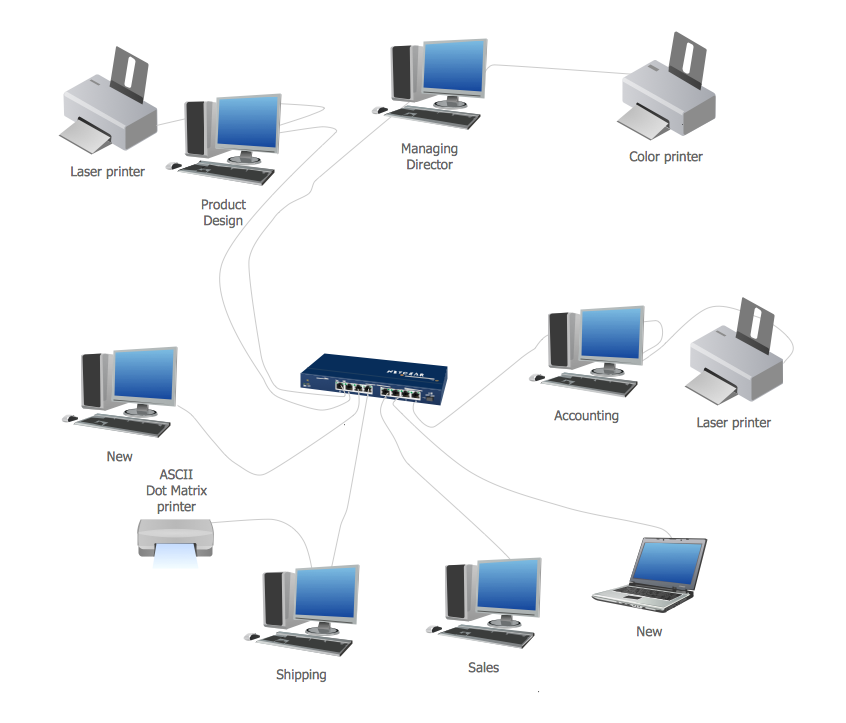
Picture: Physical network. Computer and Network Examples
Related Solution:
When describing any computer network, we imagine a set of devices and nodes, arranged in some way. Talking about network structures, we should distinguish physical and logical network topologies, as physical topology is about devices location and logical topology illustrates data flow. In the same time, they do not have to match, and some devices, such as repeaters, may have a physical star layout, but a bus logical topology.
There are two main types of computer network topologies: Physical topology that show the physical organization of a network - equipment and types of connections. Star network topology involves a set of devices that is connected to a single hub (router). Ring network topology means that, devices connected according this topology have two connections, connecting with nearby devices to make a loop. Bus network topology is the topology presented at the current diagram. It is similar to a ring topology. The difference is that data moves up and down a linear connection, copying itself where network equipment works as bus-stations along the way. This network topology can be used for small network, or when adding an extra device into a network.
Picture: Network Topologies
Related Solution:
If we divide computer networks by scale, we get several main categories. The smallest network is PAN, as it connects personal devices themselves, and as the number of users grows, a local area network can be recognized, and campus area networks (CAN) connects several local networks located within some area like a university or a corporation. Computers connected to CAN share public educational materials and list of CAN network examples includes such prestigious universities like Stanford and Carnegie Mellon.
This is an example of a computer network diagram created for a campus area network. It was created using using ConceptDraw solution for the Computer and Network diagramming. The specific of this sample campus network is its distribution. It is rather broad to embrace a big campus territory. This diagram can be applied as a template for designing custom area network topology diagram for a particular educational institution.
Picture: Campus Area Networks (CAN). Computer and Network Examples
Related Solution: