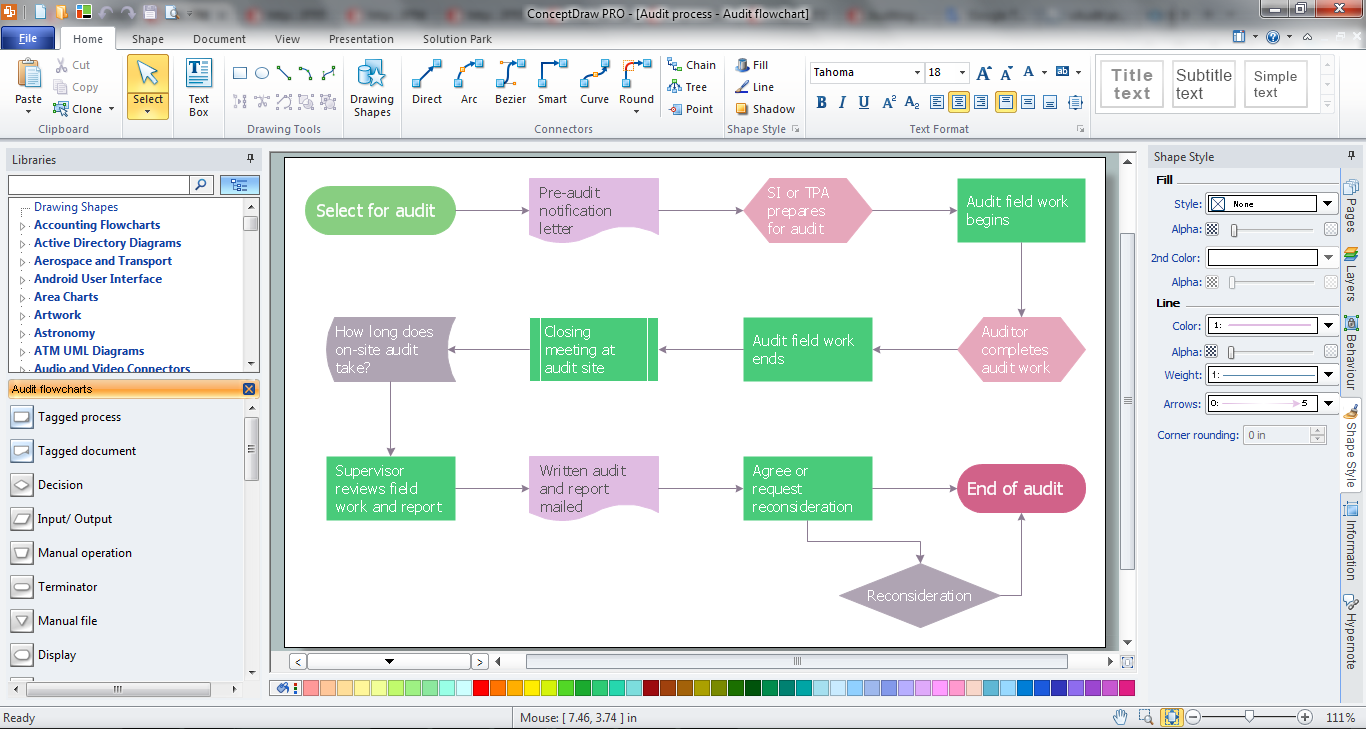
Example 1. Audit Process Design in ConceptDraw DIAGRAM
Look at the example below, it represents the variety of audit flowchart symbols developed specially for Audit Flowchart library included in Audit Flowcharts Solution. All these symbols are vector and ready for designing the audit process.

Example 2. Audit Flowcharts Library Design Elements
You can also benefit from the set of samples, examples and template included in Audit Flowcharts Solution and available from ConceptDraw STORE. Each of them can become the good base for your own Audit Process Flowchart.
Use Solution:
- Audit steps,
- Audit planning process,
- Audit flowcharts templates and examples,
- Vector graphics audit flowchart symbols,
- Analyzing complex processes,
- Designing complex processes,
- Documenting complex processes,
- Managing complex processes,
- Representing process operations,
- Showing the steps.

Example 3. Audit Process
The following features make ConceptDraw DIAGRAM the best audit process design software:
- You don't need to be an artist to draw professional looking flowcharts in a few minutes.
- Large quantity of ready-to-use vector objects makes your drawing charts quick and easy.
- Great number of predesigned templates and samples give you the good start for your own flowcharts.
- ConceptDraw DIAGRAM provides you the possibility to use the grid, rules and guides. You can easily rotate, group, align, arrange the objects, use different fonts and colors to make your diagram exceptionally looking.
- All ConceptDraw DIAGRAM documents are vector graphic files and are available for reviewing, modifying, and converting to a variety of formats: image, HTML, PDF file, MS PowerPoint Presentation, Adobe Flash, MS Visio.
- Using ConceptDraw STORE you can navigate through ConceptDraw Solution Park, managing downloads and updates. You can access libraries, templates and samples directly from the ConceptDraw STORE.
- If you have any questions, our free of charge support is always ready to come to your aid.
NINE RELATED HOW TO's:
ConceptDraw DIAGRAM enhanced with Flowcharts Solution is the best flow chart maker online design software. Use it to ✔️ create clear and actionable Flowcharts, ✔️ improve decision-making, ✔️ enhance problem-solving in various scenarios, ✔️ enhance creativity and productivity across industries, ✔️ streamline workflows
Picture: Flow Chart Online
Related Solution:
Process Flow Charts are very popular and widely used in chemical and process engineering for representation a general flow of plant processes and equipment. If you need often draw them, the ConceptDraw DIAGRAM diagramming and vector drawing software extended with tools of Flowcharts Solution will be useful for you.
The mostly used set of process flow chart symbols includes the following: Rectangle (box) process flow chart symbol, Rounded rectangle, Circle, Diamond.
Picture: Process Flow Chart Symbol
Related Solution:
ConceptDraw DIAGRAM diagramming and vector drawing software extended with 25 Typical Orgcharts solution from the Management area of ConceptDraw Solution Park offers 25 ready Organization Chart templates, 10 samples and 2 libraries with predesigned vector objects.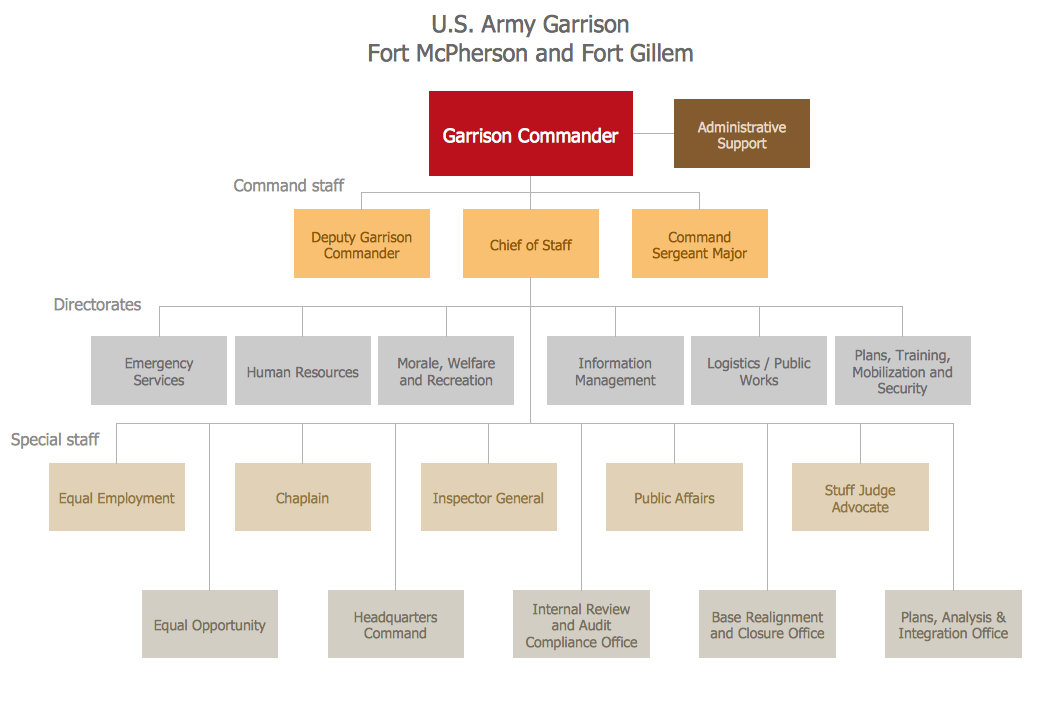
Picture: Organization Chart
Related Solution:
ConceptDraw DIAGRAM enhanced with Audit Flowcharts solution from the Finance and Accounting area of ConceptDraw Solution Park is a powerful diagramming and vector drawing software for designing professional looking Chart Audit of any complexity.
Chart Audit is incredibly convenient for representing important information about audit process and audit planning process. It also helps auditors to define the problem areas and to elaborate the ways of their solving and effectiveness improvement.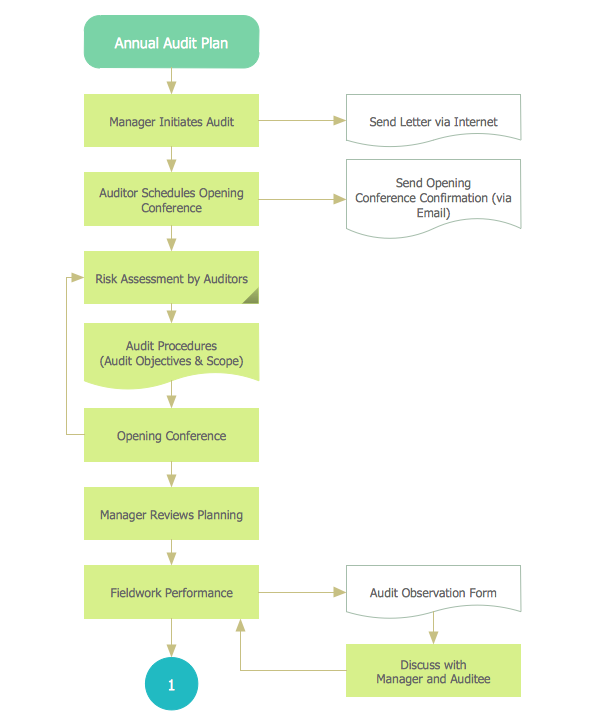
Picture: Chart Audit
Related Solution:
Steps in the Accounting Process - The Accounting Process is a sequence of organization activities that is used for gaining quantitative information about the finances. This complex process consists of a set of sequential steps.
9 steps in the accounting process: Analysis of Business Transactions, Make Journal Entries, Post to Ledger Accounts, Prepare Trial Balance, Make Adjusting Entries, Adjusted Trial Balance, Prepare Financial Statements, Close Accounts, Post-Closing Trial Balance.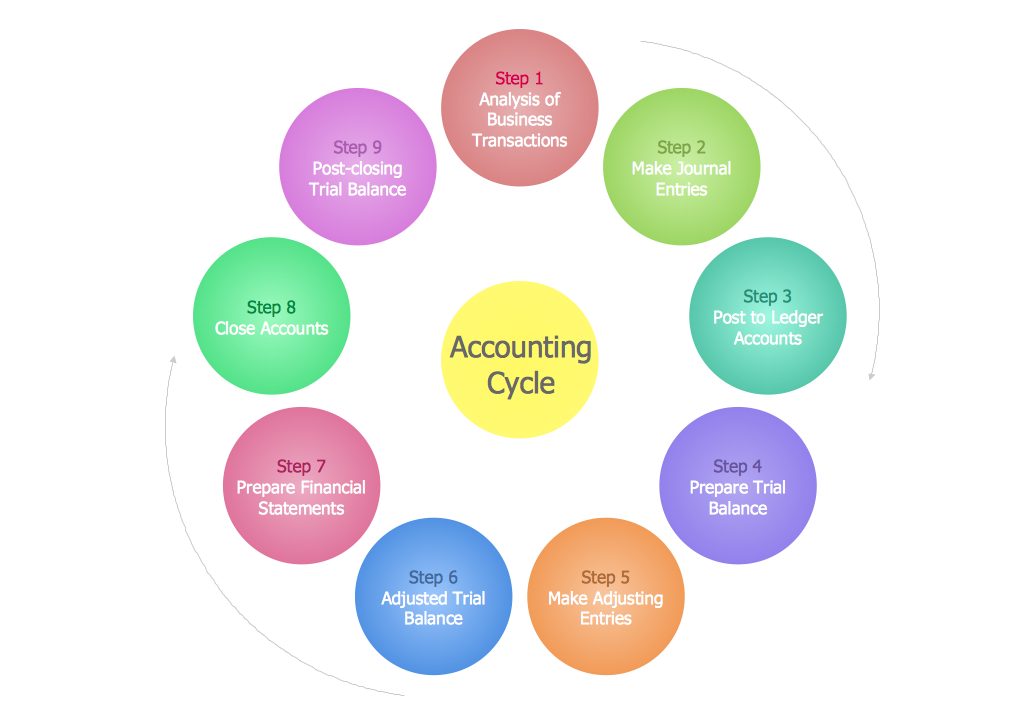
Picture: Steps in the Accounting Process
Related Solution:
You need to draw professional looking BPMN diagrams quick and easy? Pay please your attention on ConceptDraw DIAGRAM diagramming and vector drawing software. Extended with Business Process Diagram Solution from the Business Processes Area it will be ideal for your.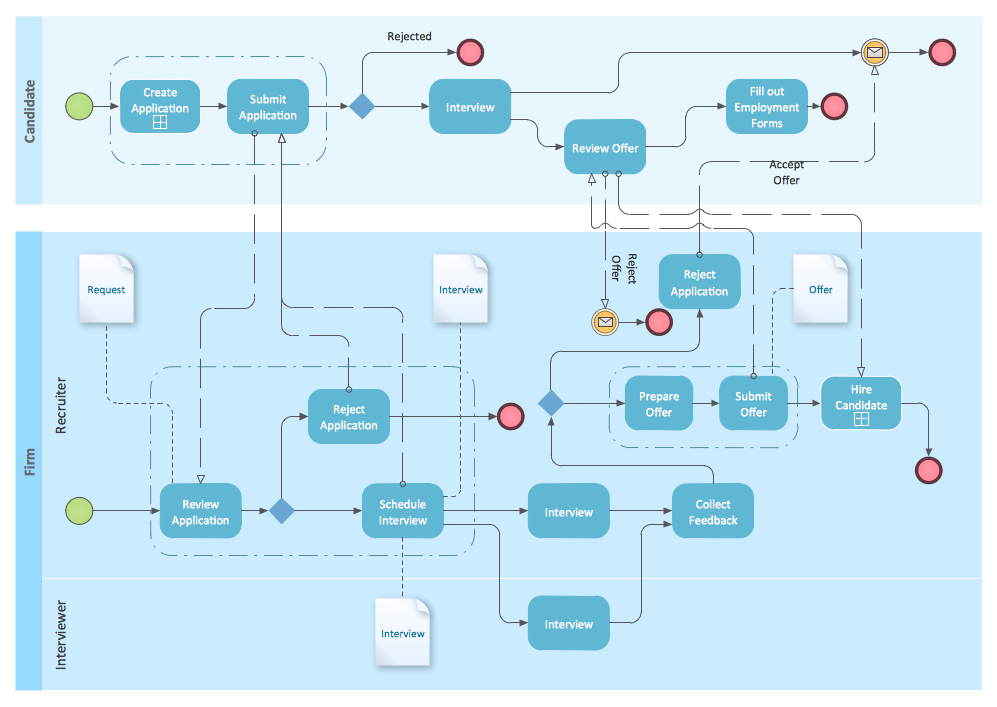
Picture: BPMN
Related Solution:
ConceptDraw DIAGRAM is a powerful diagramming and vector drawing software. Extended with Office Layout Plans Solution from the Building Plans Area, ConceptDraw DIAGRAM became the ideal software for making Office Floor Plans.
Picture: Office Floor Plans
Related Solution:
If you need to describe some process, diagramming is a perfect tool for almost any imaginable purpose. The set of the most commonly used flow charts symbols is quite wide and includes symbols for operations, processes, data inputs and outputs. You can see the full list of all the symbols used for flowcharting in Flowcharts solution from Diagrams area in ConceptDraw Solution Park.
A flow chart is often used for visual representation of a sequential process flow. The flowchart approach to any process is to divide it into some sequential actions. What makes a flow chart so popular and clear to make out is the set of standard flowchart symbols that has the same reading independently from processes described with their applying. The current drawing represents the vector library containing the pack of standard flowchart symbols. This library is supplied with ConceptDraw Flowcharts solution.
Picture: Flow Chart Symbols
Related Solution:
Now, thanks to the new HR Flowcharts Solution, it become also ideal for designing HR Flowcharts and visually displaying the hiring process steps.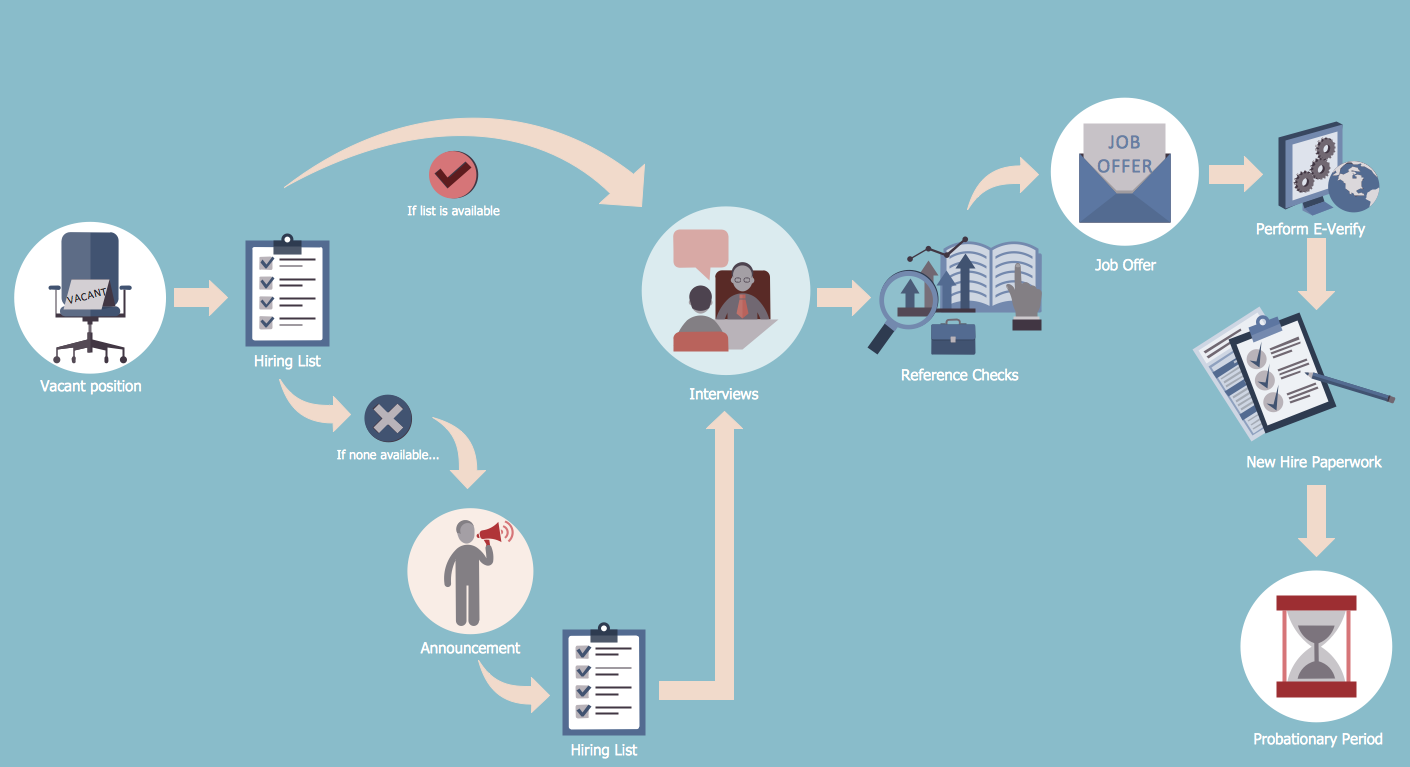
Picture: Hiring Process Steps
Related Solution:

