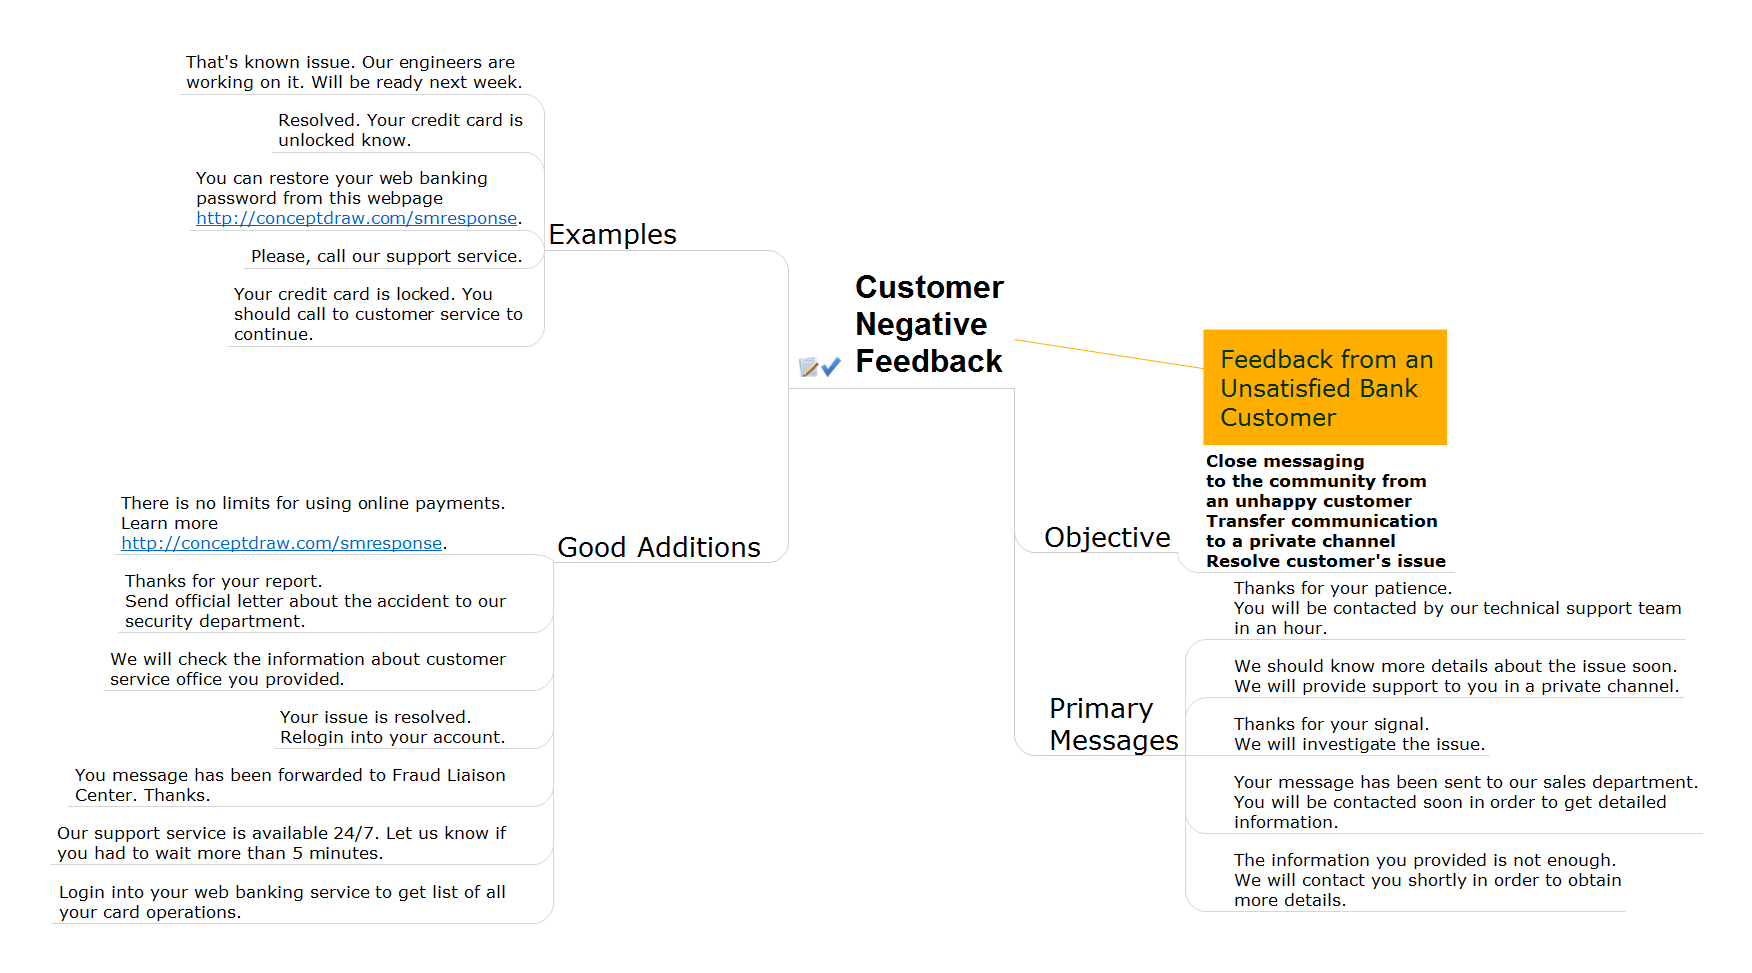
Sample 1. Response to Customer Negative Feedback - Bank customer negative feedback.
It’s a big help to customers if you can answer questions before they were asked.
Action Maps helps the teams be on the same page and follow the social media response plan.
SEVEN RELATED HOW TO's:
ConceptDraw MINDMAP has a new challenges in leading or taking instruction during remote mind map presentation and available to deliver lessons to a remote group via a Skype conference call. ConceptDraw DIAGRAM provides tools to develop a response flowchart that can be connected with Action Mind Maps.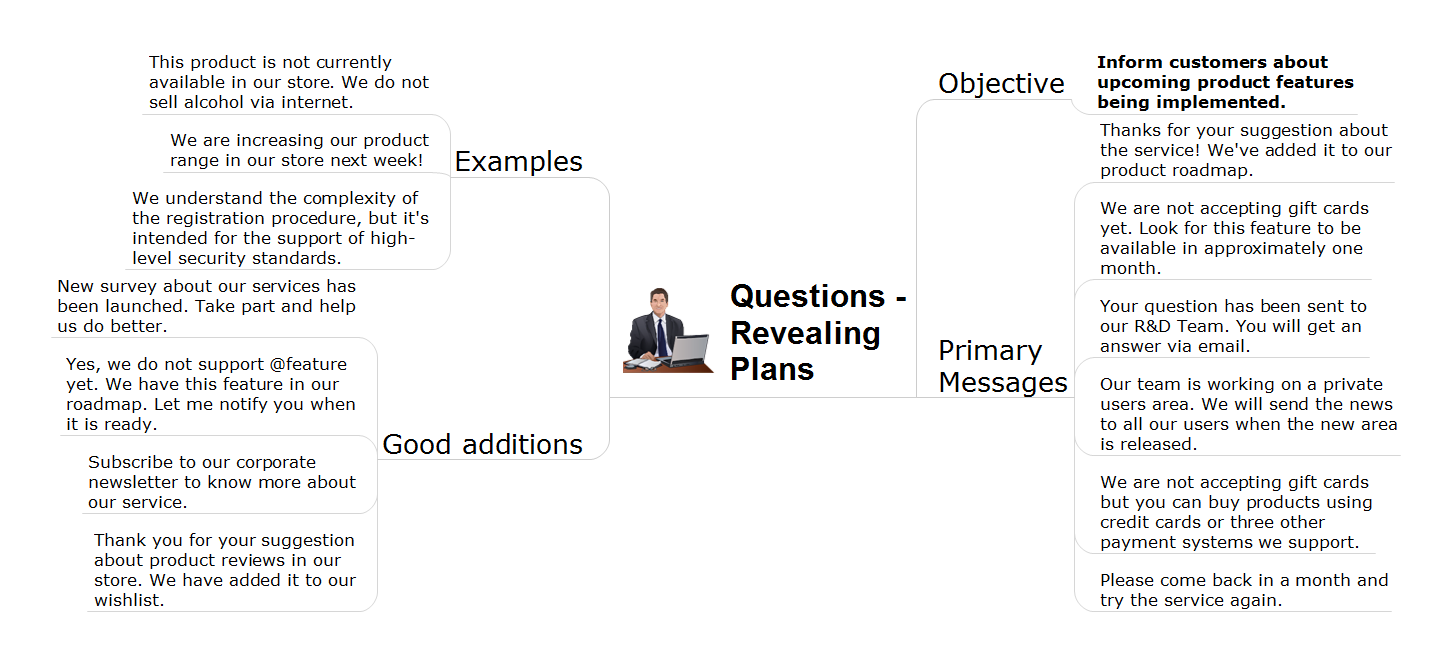
Picture: Provide Team Training
Related Solution:
Which trends are on the horizont of social media? What’s we have to prepare for? Look into the future with ConceptDraw products.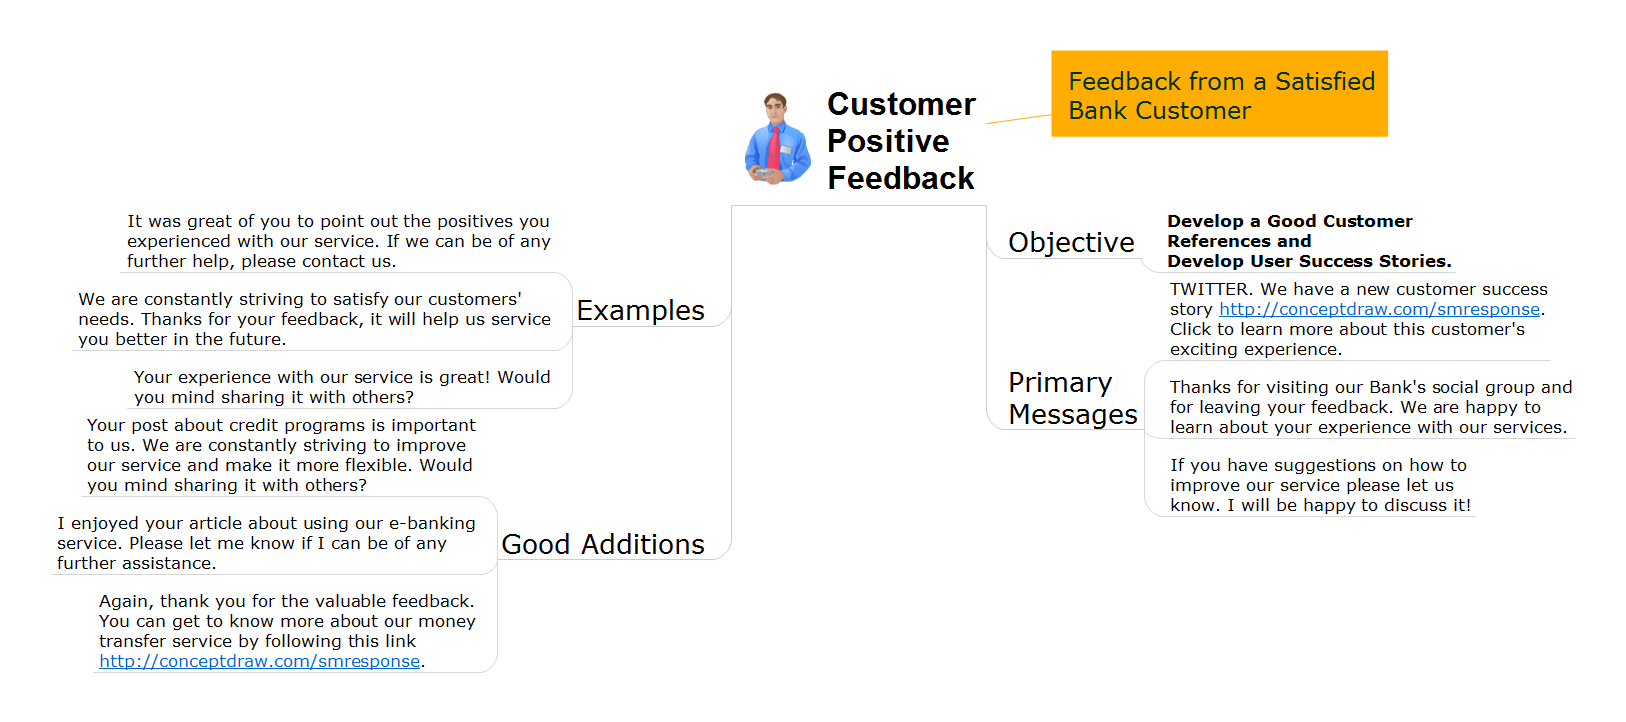
Picture: The Means to Respond to Social Media Mentions
Related Solution:
The most easier way of creating the visually engaging and informative Sales Process Flowchart is to create the new ConceptDraw document and to use the predesigned vector symbols offered in 6 libraries of the Sales Flowchart Solution. There are more than six types of sales process flow diagrams, ConceptDraw DIAGRAM software is flowchart maker which include six collections of extended flowchart symbols for effective diagramming. There are main collections of color coded flowchart symbols: Sales Department, Sales Steps, Sales Workflow, Sales Symbols and special set of Sales Arrows and Sales Flowchart.
Picture: Sales Process Flowchart Symbols
Related Solution:
In order to be strategic leader and be ahead of your competitors, use ConceptDraw DIAGRAM, a unique tool for creating your Social Media Strategy.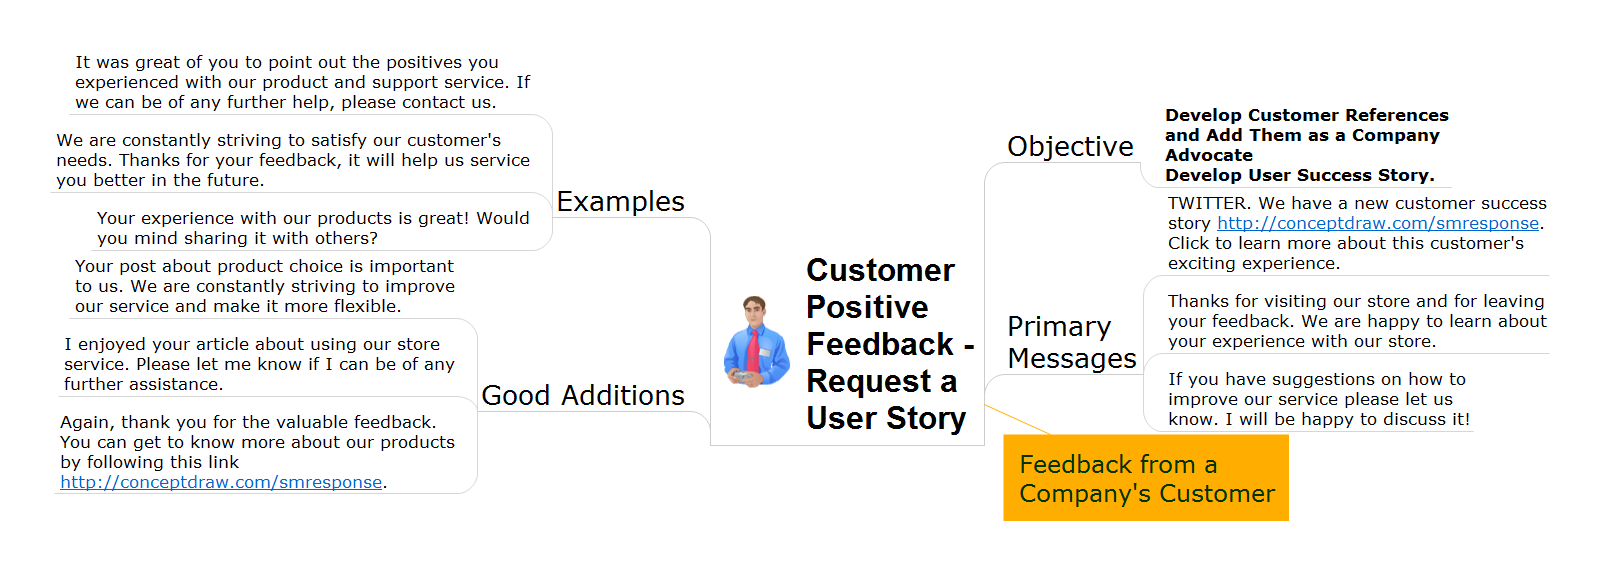
Picture: How to Realize your Social Media Strategy
Related Solution:
The Social Media Response solution provides the means to respond to social media mentions quickly and professionally. This tool keeps the entire team on the same page allowing you to realize your social media strategy, improve the quality of your answers, and minimize the time it takes to respond.
Picture: Manage Social Media Response Plan DFD
Related Solution:
This action mindmap helps to develop good customer references and user success stories.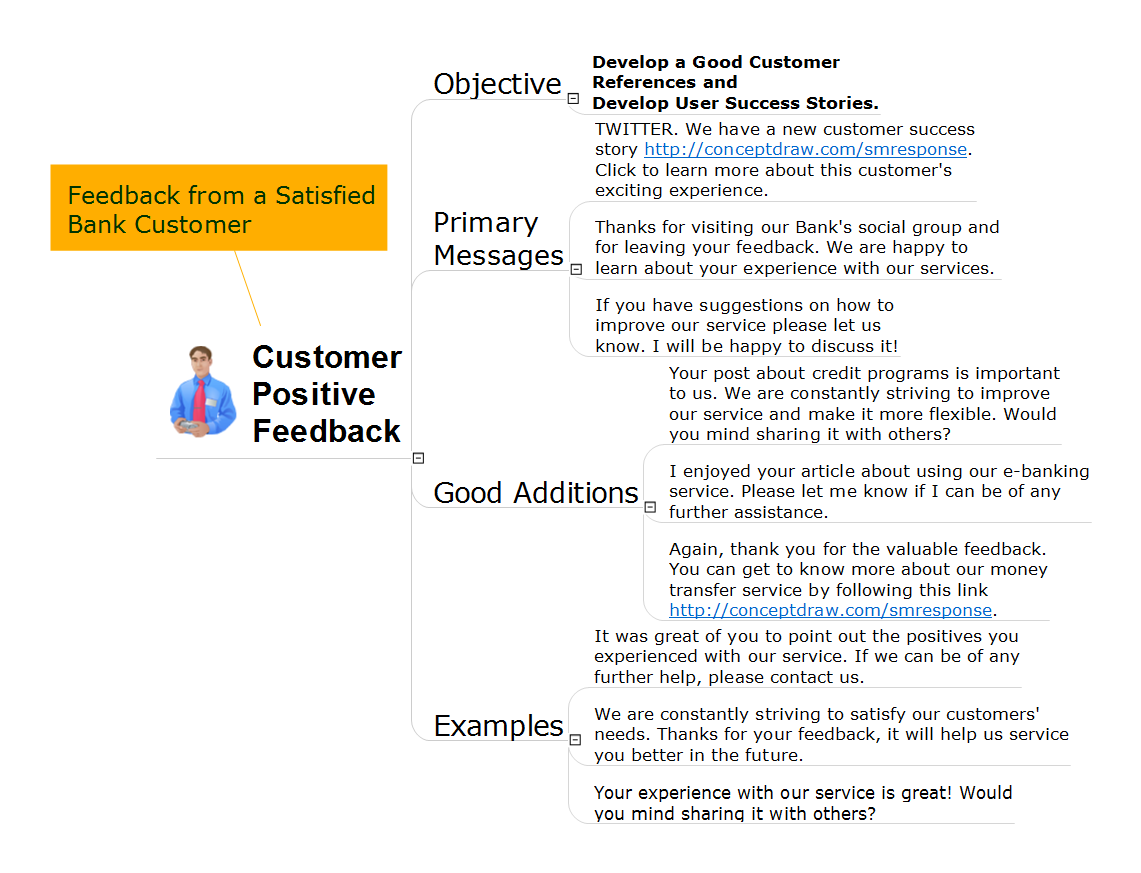
Picture: Bank Customer Positive Feedback
Related Solution:
Response to Customer Negative feedback - ConceptDraw DIAGRAM helps to realize the process of response for interactions occurring in social media.
Interactive Flowcharts can change the way one creates and organizes their social media response process.Picture: Response to Customer Negative Feedback
Related Solution: