Diagramming Software for Design UML Component Diagrams
How to draw UML Component Diagrams
UML Component Diagram illustrate how components are wired together to larger components and software systems that shows the structure of arbitrarily complex systems.
Components are wired together by using an assembly connector that defines that one component requires the services that another component provides. Connector that links the external contract of a component to the internal realization of that behavior by the component’s parts called a delegation connector.
ConceptDraw has four examples that help you to start using software for drawing UML Component Diagrams. You can use the appropriate stencils of UML notation for drawing own UML Component Diagram.
UML Component Diagram Library
ConceptDraw Rapid UML solution delivers libraries contain pre-designed objects fit UML notation, and ready to draw professional UML Component Diagram.

Example 1. UML Component Diagram library
UML Component Diagram Design Elements
Design elements sample shows all library objects at one page for quick review.
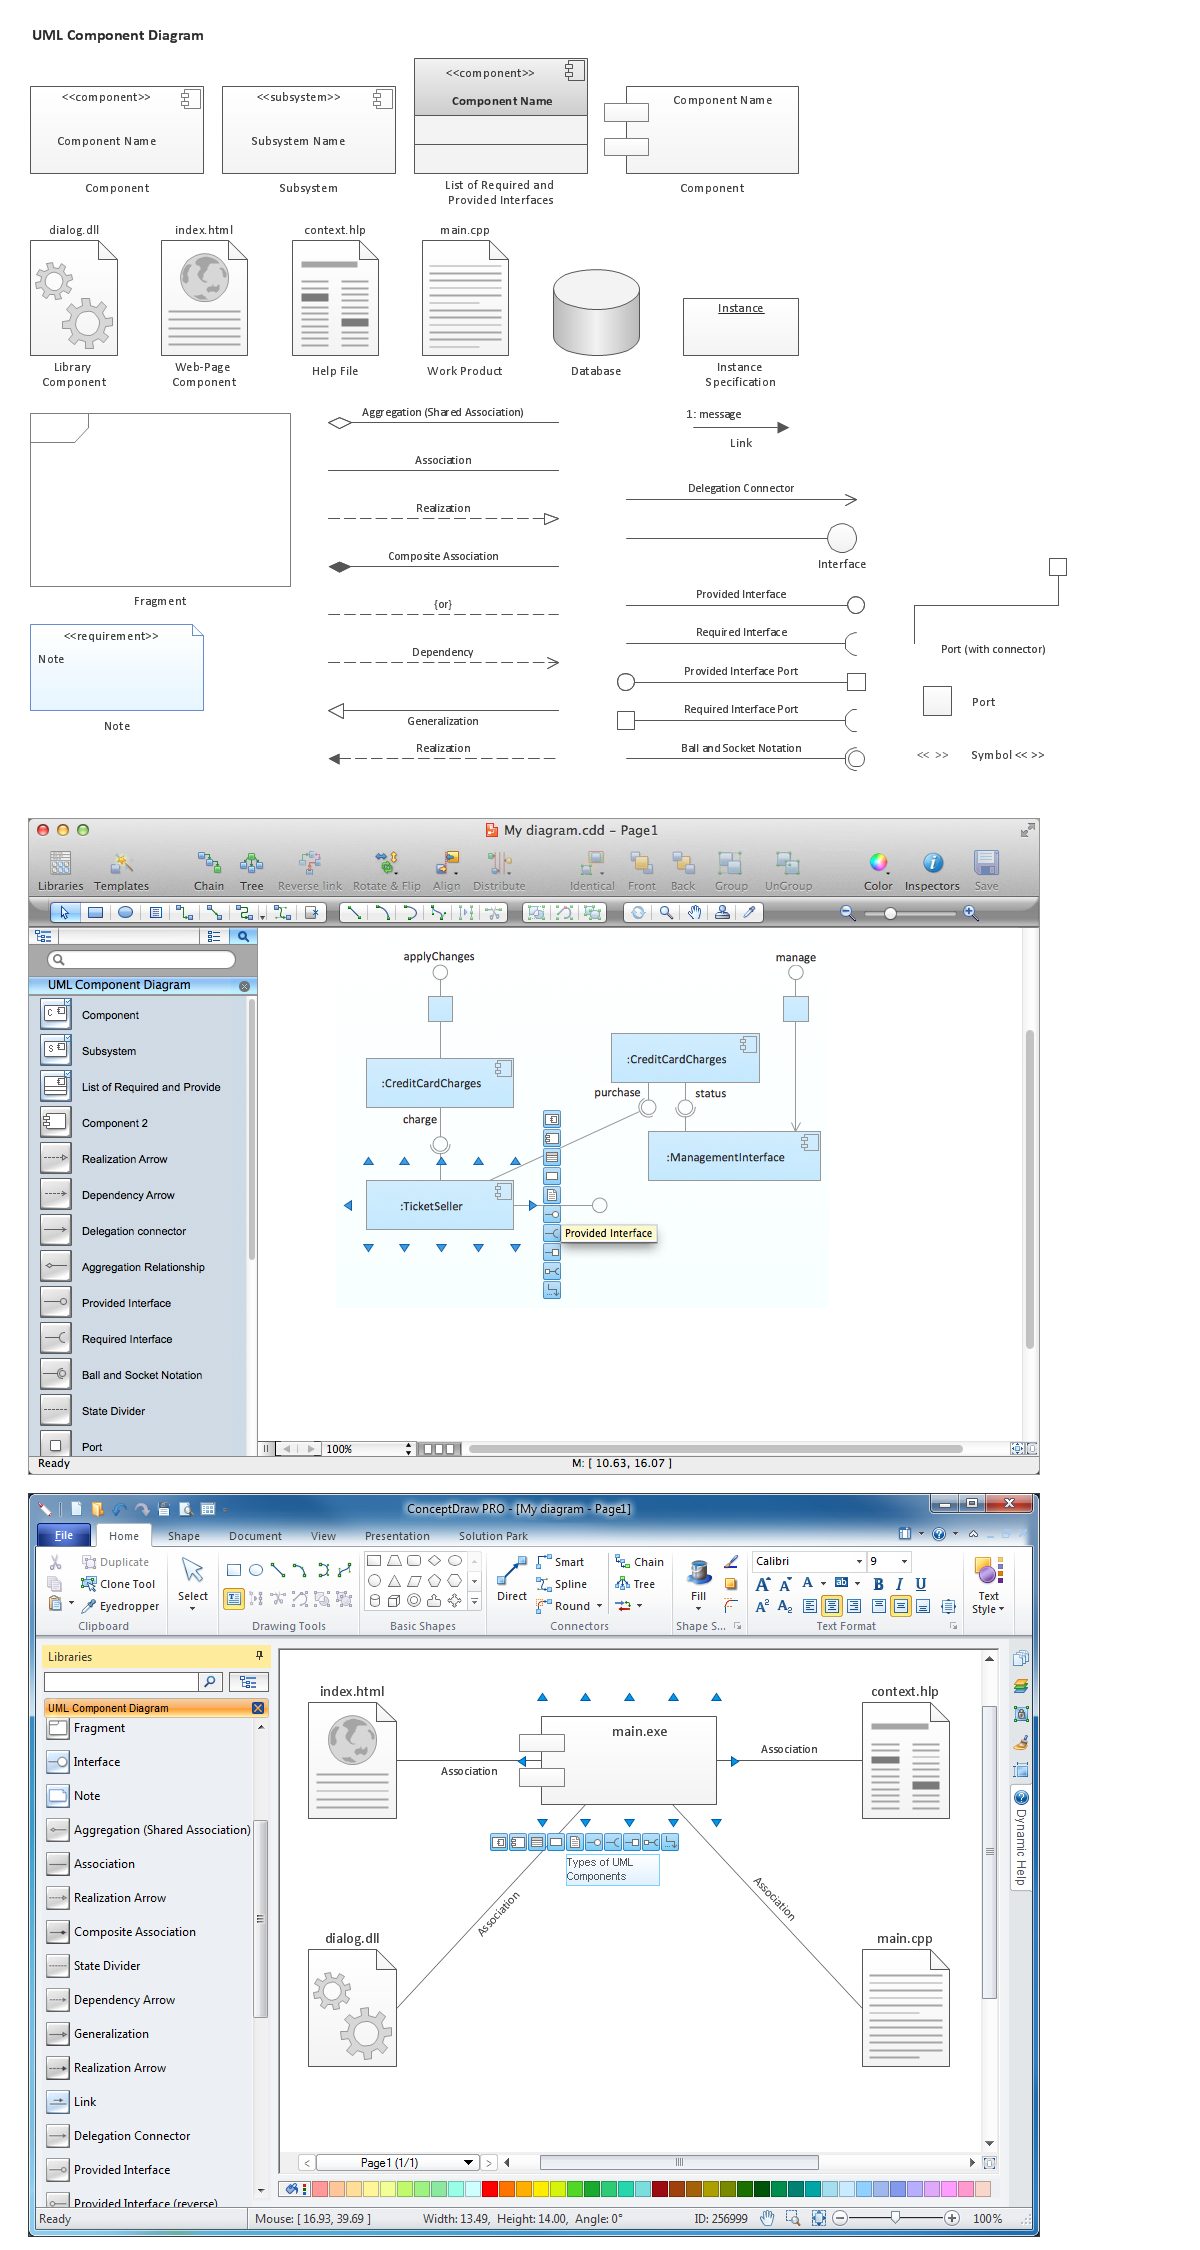
Example 2. Diagramming Software for Design UML Component Diagrams
ConceptDraw Rapid UML solution provides UML Component Diagram library of vector stencils for drawing the component diagrams using component blocks and assembly connectors.

Example 3. UML Component diagram solution
Use design element from the UML Component Diagram library to draw your own UML component diagrams of complex systems and software applications.
TEN RELATED HOW TO's:
The UML diagram is a powerful tool which lets visually represent all system's components, the interactions between them and relationships with external user interface.
The Rapid UML solution for ConceptDraw DIAGRAM software offers diversity of UML flowchart symbols for drawing all types of UML diagrams.
Picture: UML Flowchart Symbols
Related Solution:
Flowcharts can be used in designing and documenting both simple and complex processes or programs and, similar to the other types of diagrams, they can help visualize what happens and so help understand some definite process, and, as a result, find flaws, bottlenecks and other features within it.
Picture: Flowchart Programming Project. Flowchart Examples
Related Solution:
Data base diagrams describes inter-related data and tables. It describes roles and relationships, internal and external dependencies, data exchange conventions and structures of knowledge domain.
ConceptDraw Software provides number of data-base chart libraries including major 49 vector symbols. Use these DFD flowchart symbol libraries to design data-base structure and models, use it to design data base process-oriented models, or simple data-oriented models. The are special drawing tools for making data flowcharts, data process diagrams, structured analysis diagrams, and information flow diagrams.
Picture: Database Flowchart Symbols
Related Solution:
ConceptDraw is a good means of visualization of information of any kind as it features powerful graphic capabilities. The conception of using ConceptDraw and open formats by the programs that work with Internet can be used for displaying any data and any structure in Internet.
Picture: Internet solutions with ConceptDraw DIAGRAM
The Building Plans area of ConceptDraw Solution Park includes a set of solutions of Interior Design. The Interior Design solutions for ConceptDraw DIAGRAM allow you simply and quickly create the professional looking Building Plans that will help you to design, redesign your room, flat, home, office, cafe or any other building. Having the ready plan of the rooms you can easy rearrange the furniture, interior objects on the plan and see the future result at once.
Picture: Interior Design Software. Building Plan Examples
Related Solution:
The art of arranging furniture and other decorations in space is called interior design. Some sites, like sport fields have tight restrictions in dimensions, but there's still a lot of work for a designer. You can help yourself to design such a plan with ConceptDraw DIAGRAM solution Sport Field Plans that contains elements of sport equipment and recreation plans.
This drawing represents the set of vector graphic objects that compose the Sport fields and Recreation library, supplied by ConveptDraw Sport Fields Plans solution. It can be used for drawing interior designs and layouts of sport fields and recreation zones. By using ConceptDraw with Sport Field Plans solution you can create professional plans for different sport fields: basketball, volleyball, football, tennis, golf, etc. Moreover, the use of this solutions enables making a site plans including green zone, pools, parkings - in short, what makes the recreation area, that usually accompanies sports facilities.
Picture: Interior Design. Sport Fields — Design Elements
Related Solution:
ConceptDraw DIAGRAM is a powerful tool for drawing business communication ideas and concepts, simple visual presentation of numerical data in the Mac environment.
Picture: Best Multi-Platform Diagram Software
Related Solution:
Communication via Internet nowadays is almost irreplaceable part of lifestyle. It’s needless to say that providing that communication is not a piece of cake, and network diagram software is useful for representing all the interconnections between network devices. These diagrams are also helpful for educational purposes.
This drawing depicts the network topology of the sample web studio. This is a physical type of network diagram. It is depicting the network, end-user equipment and connections between them. The given network has combined the both star and mesh network topology features. This diagram is a tool of network administrator. it delivers the actual information on location of servers, hubs, switches, routers, and other telecommunication equipment. The collection of network related symbols provided with ConceptDraw Network Diagrams solution represents the entire network components. All Symbols are standard. Therefore, network specialists can effortlessly decrypt this diagram.
Picture: Network Diagram Software
Related Solution:
This sample was created in ConceptDraw DIAGRAM diagramming and vector drawing software using the UML Deployment Diagram library of the Rapid UML Solution from the Software Development area of ConceptDraw Solution Park.
This sample shows the work of the ATM (Automated Teller Machine) banking system that is used for service and performing of the banking transactions using ATMs. System engineers can use comprehensive UML diagrams solution.
Picture: UML Deployment Diagram Example - ATM SystemUML diagrams
Related Solution:
Computer networks nowadays are spread all across the world. The large number of parameters, such as geographic scale or communication protocols, can divide networks. One of the most common types of networks is called local area network (LAN). It convenient to represent network examples by means of diagrams.
This local area network (LAN) diagram provides an easy way to see the way the devices in a local network are interacted. The diagram uses a library containing specific symbols to represent network equipment , media and the end-user devices such as computers (PC, mac, laptop) , network printer, hubs, server and finally a modem. There are two types of network topologies: physical and logical. The current diagram represents precisely a physical type of LAN topology because it refers to the physical layout of a local network equipment.
Picture:
What is a Local Area Network?
Examples of LAN Diagrams
Related Solution:
