How to create a UML Diagram
The Rapid UML Solution from the Software Development area of ConceptDraw Solution Park helps you to create all types of the UML 2.x and 1.x diagrams quick and easy using ConceptDraw DIAGRAM diagramming and vector drawing software.
The Rapid UML Solution contains 13 vector stencils libraries with 393 interactive shapes that you can use to design your UML diagrams.
For example, let’s create a Class Diagram.
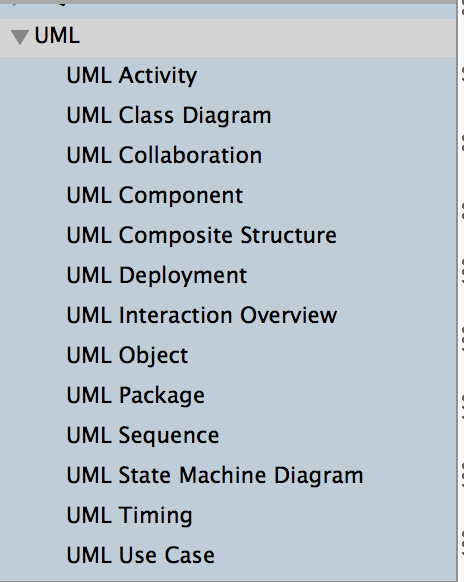
- Open the UML Class Diagram library from the tree in the left side panel Libraries by simple click on his name.
- Drag and drop the shape from the library to your document.
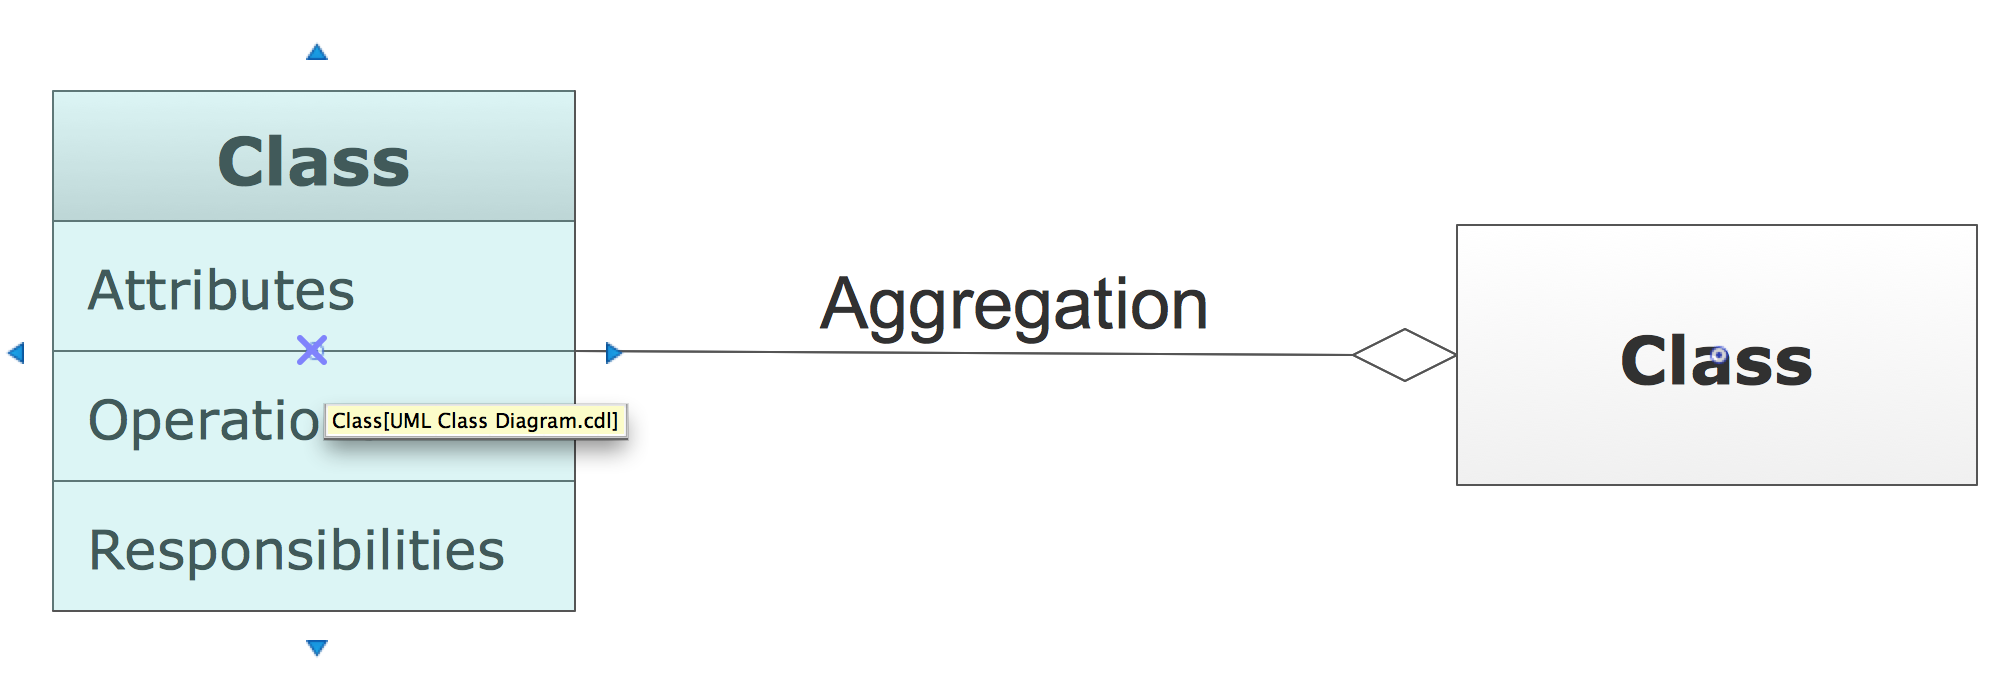
- Select the shape by mouse click. The Action menu icon appears near the right top corner of the selected shape.
- Open the Action menu by click on the icon.
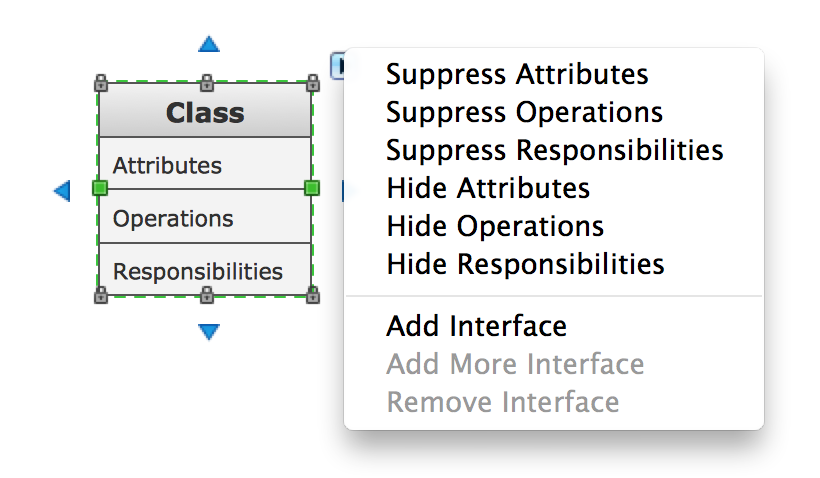
- Use the Action menu commands:
- Suppress Attributes, Suppress Operations, Suppress Responsibilities to suppress the corresponding fields.
- Hide Attributes, Hide Operations, Hide Responsibilities to hide / show the corresponding fields.
- Add Interface, Add More Interface, Remove Interface to add / remove interfaces.
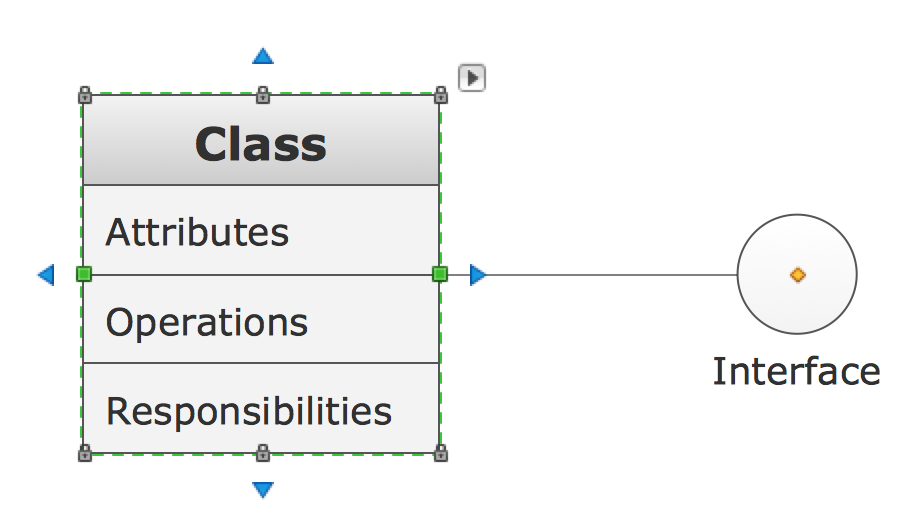
- Select next shape to connect using Rapid Draw feature:
- Put cursor on one of 4 directional arrows around the selected shape. The column of shape icons will appear.
- To add and connect new shape to the selected shape simply click on the corresponding shape icon.
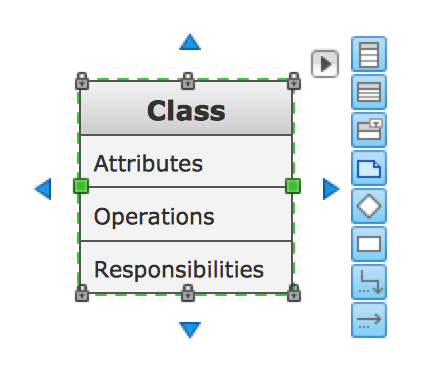
- Rapid Draw feature will automatically add the new shape and connect it to the selected shape.
- You can also use special types of connectors from the library.
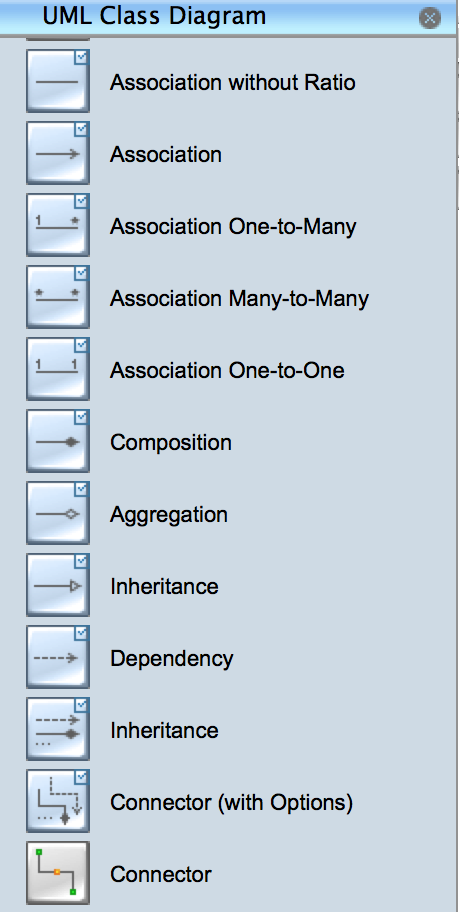
- Drag and drop any connector from the library to your diagram.
To connect any two shapes with this connector drag and drop his end points to the centers of the shapes.
- Drag and drop any connector from the library to your diagram.
To connect any two shapes with this connector drag and drop his end points to the centers of the shapes.
- To add or edit shape label, select the shape by mouse click, then type in your label text.
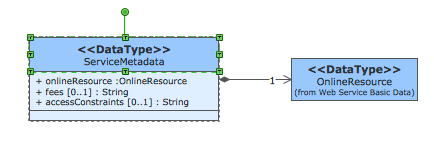
Example. UML Class Diagramm - Metadata Information Model

ConceptDraw DIAGRAM extended with the Rapid UML solution is perfect for drawing professional UML diagrams.
TEN RELATED HOW TO's:
What is a computer network? This is a set of devices and systems that are connected to each other (logically or physically) and communicate with each other. This could include servers, computers, phones, routers, and so on. The size of this network can reach the size of the Internet, and can consist of only two devices connected by a cable.
This sample shows the connection scheme of the home WLAN equipment to the Internet.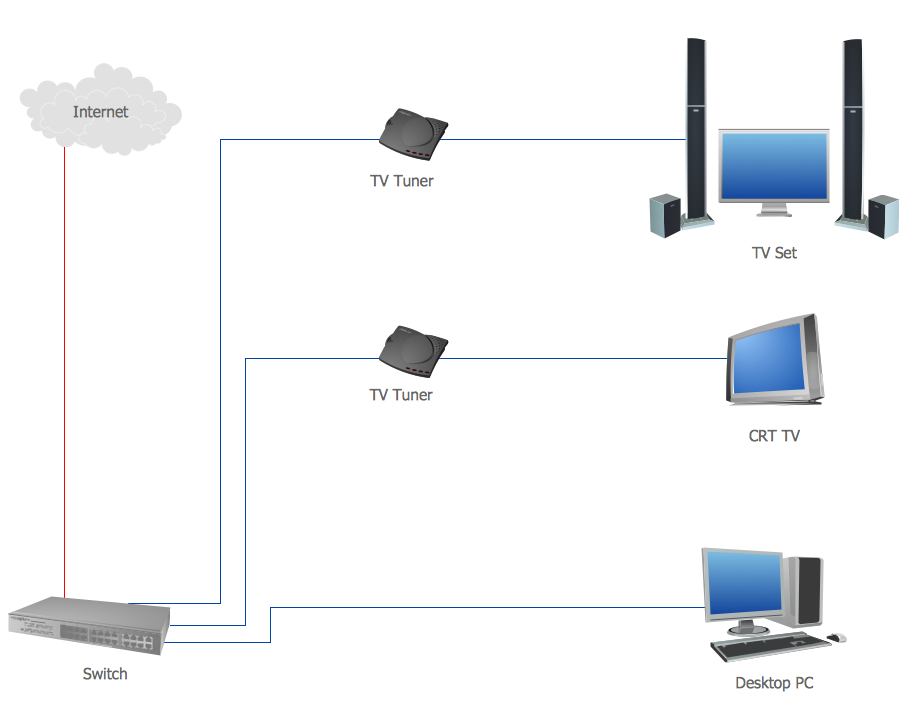
Picture: Diagram of a Basic Computer Network. Computer Network Diagram Example
Related Solution:
The use case diagram (behavior scenarios, precedents) is the initial conceptual representation of the system during its design and development. This diagram consists of actors, use cases and relationships between them. When constructing a diagram, common notation elements can also be used: notes and extension mechanisms.
This sample was created in ConceptDraw DIAGRAM diagramming and vector drawing software using the UML Use Case Diagram library of the Rapid UML Solution from the Software Development area of ConceptDraw Solution Park.
This sample shows the types of user’s interactions with the system and is used at the registration and working with the database system.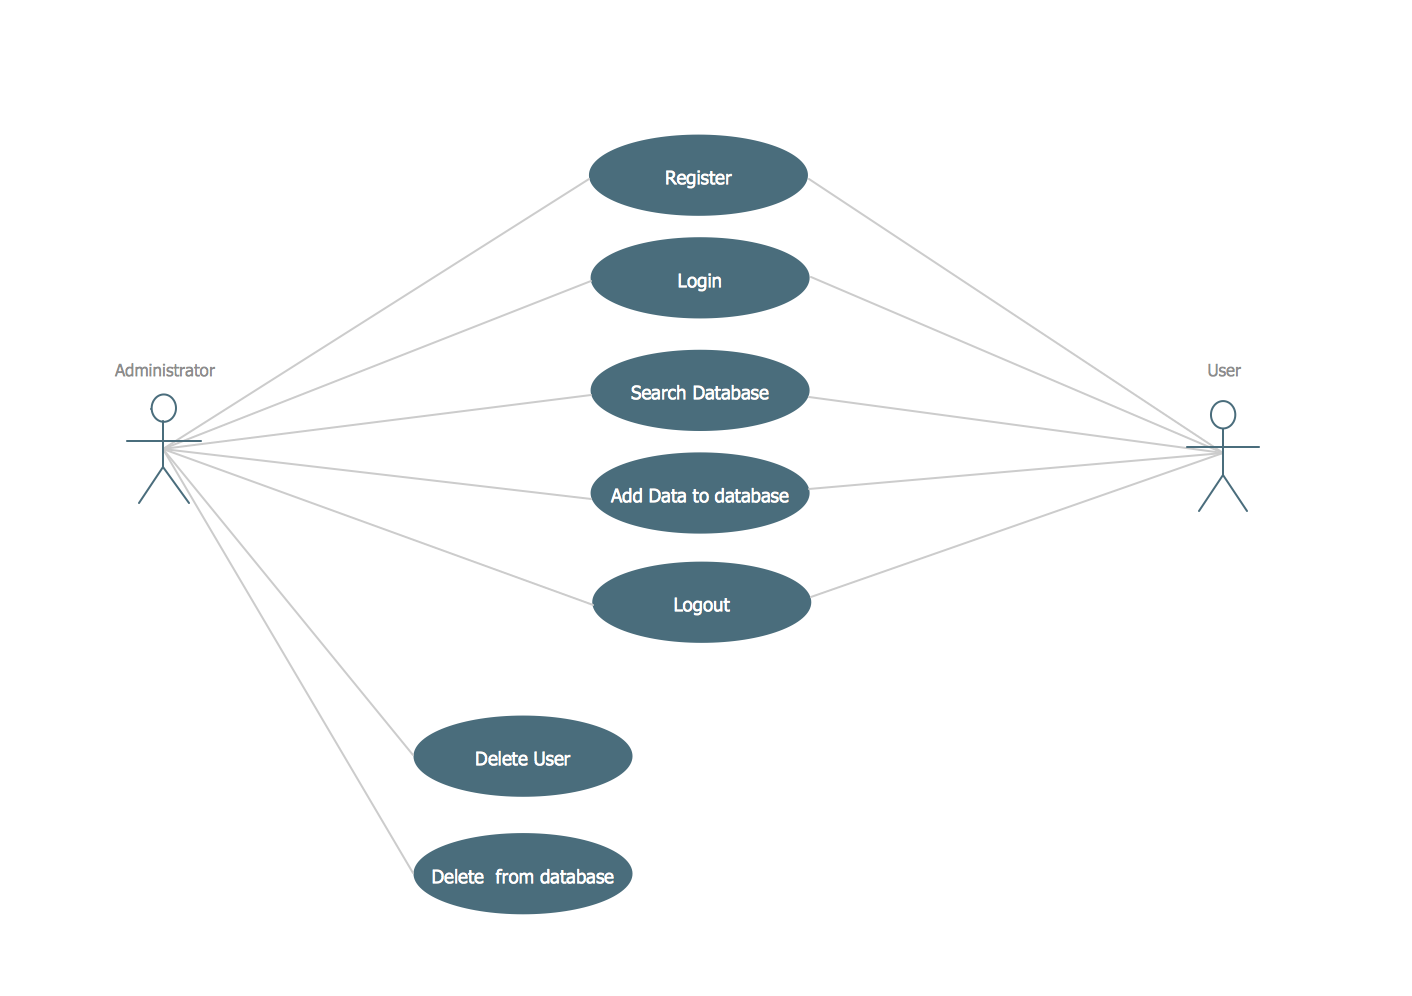
Picture: UML Use Case Diagram Example. Registration System
Related Solution:
If you need to pull together a quick marketing drawing, you'll find elements, samples, templates and libraries with vector clip art for drawing the Marketing Illustrations.
These symbols and signs you can use in your design for Strategic Marketing, Graphic Design, Inbound and Content Marketing, Social Media, Lead Generation, Email Marketing and Automation, CRM implementation and Integration and more.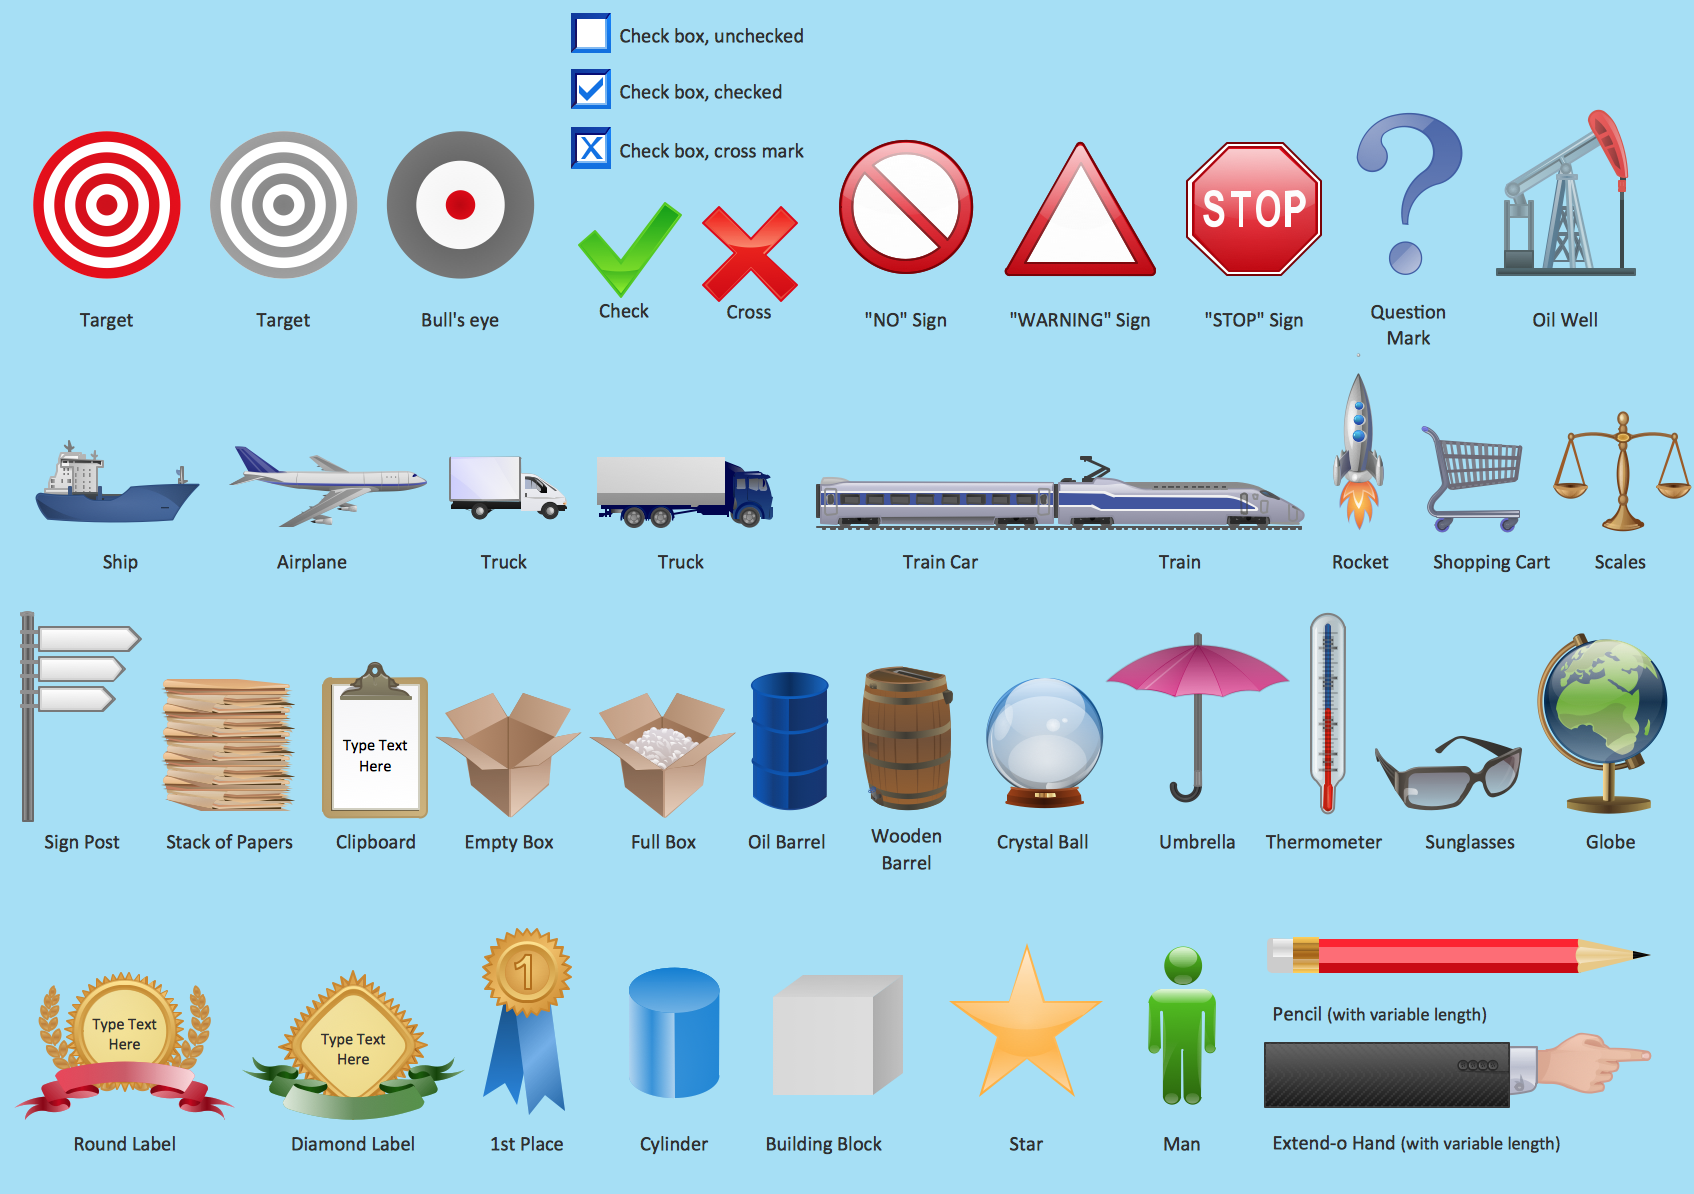
Picture: Marketing - Design Elements
Related Solution:
Entity Relationship Diagram (ERD) is an acknowledged method to visualize the logical structure of databases. Using special symbols described in ERD notations you can depict a database of any complexity.
The vector graphic ER diagrams produced when using ConceptDraw ERD solution can be used in whitepapers, presentations, datasheets, posters, or any technical materials.
Picture: What is Entity-Relationship Diagram
Related Solution:
It is impossible to imagine the biology science without drawings. Drawings are very convenient way to explain the different biological knowledge and processes. If you dream to design any biology drawing quick and easy – the ConceptDraw DIAGRAM software is exactly what you need.
ConceptDraw DIAGRAM diagramming and vector drawing software extended with Biology solution from the Science and Education area offers the useful tools for easy biology drawing.
Picture: Biology Drawing
Related Solution:
ConceptDraw DIAGRAM is a world-class diagramming platform that lets you display, communicate, and present dynamically. It′s powerful enough to draw everything from basic flowcharts to complex engineering schematics.
Video tutorials on ConceptDraw products. Try it today!
Picture: Business Process Mapping — How to Map a Work Process
Related Solutions:
Variable delay elements are often used to manipulate the rising or falling edges of the clock or any other signal in integrated circuits. Delay elements are also used in delay locked loops and in defining a time reference for the movement of data within those systems.
26 libraries of the Electrical Engineering Solution of ConceptDraw DIAGRAM make your electrical diagramming simple, efficient, and effective. You can simply and quickly drop the ready-to-use objects from libraries into your document to create the electrical diagram.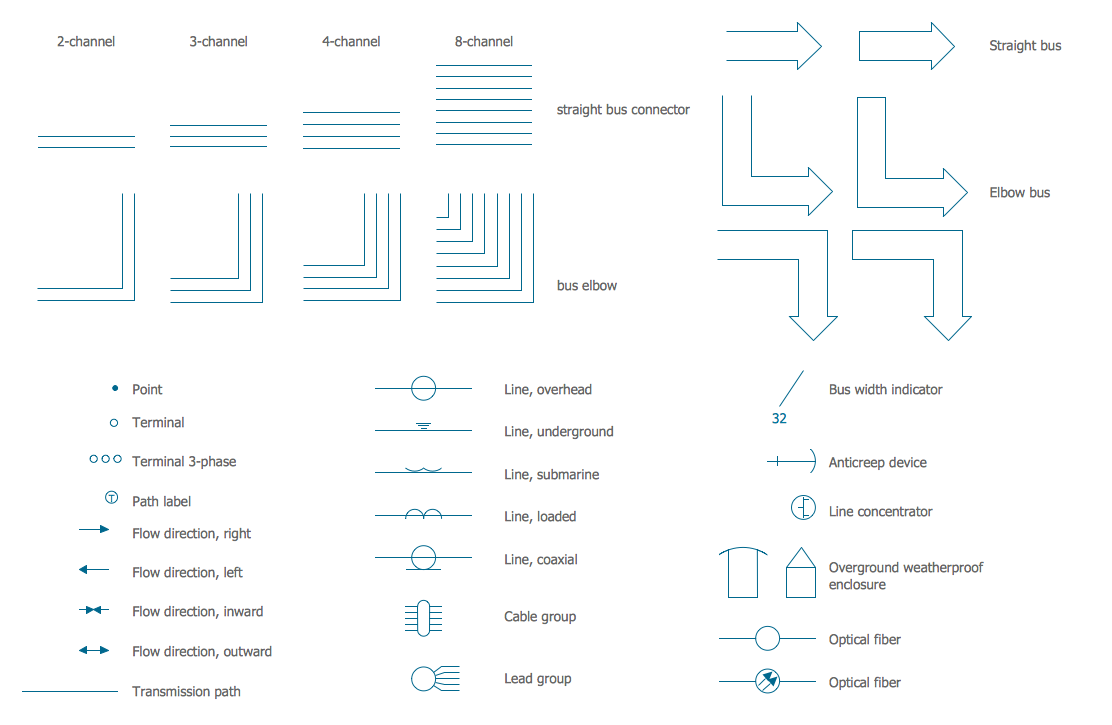
Picture: Electrical Symbols — Transmission Paths
Related Solution:
Activity diagram describes the business and operational step-by-step workflows of components in a system. An activity diagram shows the overall flow of control.
Picture: Diagramming Software for Design UML Activity Diagrams
Use ConceptDraw DIAGRAM enhanced with solutions from ConceptDraw Solution Park to create diagrams to present and explain structures, process flows, logical relationships and networks.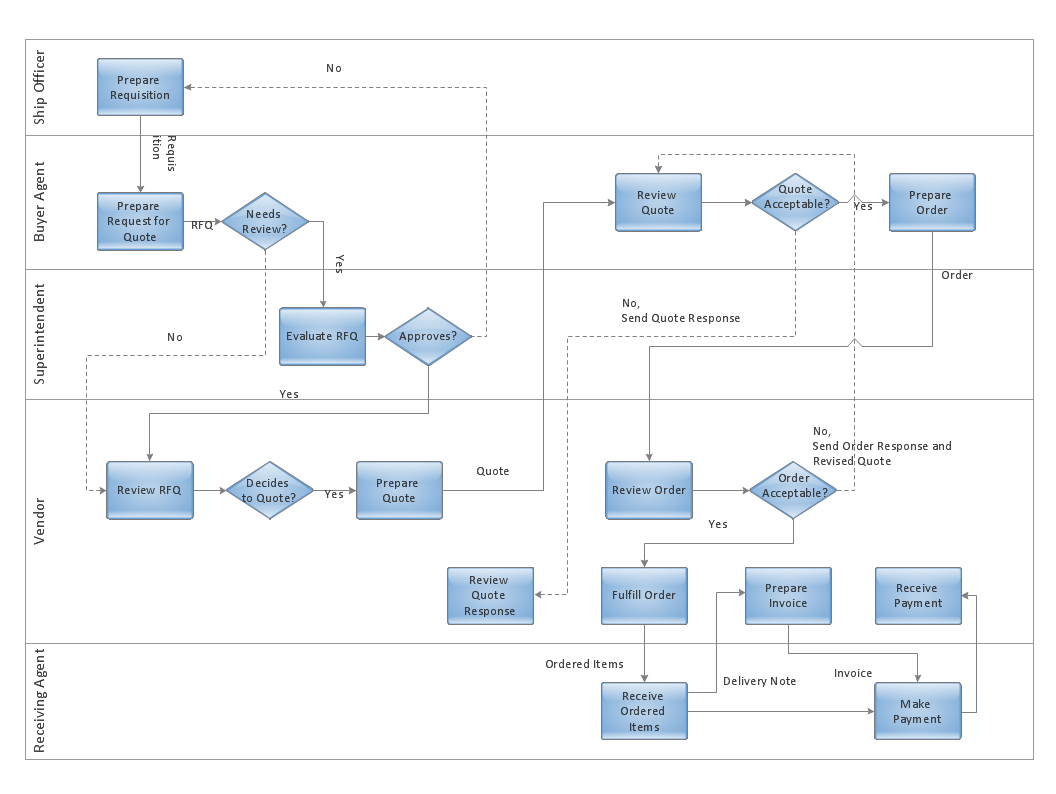
Picture: Cross-Functional Flowcharts in ConceptDraw
ConceptDraw DIAGRAM diagramming and vector drawing software enhanced with Fishbone Diagrams solution from the Management area of ConceptDraw Solution Park gives the ability to draw Fishbone diagram, which identifies many possible causes for an effect for problem solving. Fishbone Diagram procedure of creation includes the set of steps easy for execution in ConceptDraw DIAGRAM.
Picture: Fishbone Diagram Procedure
Related Solution:
ConceptDraw
DIAGRAM 18