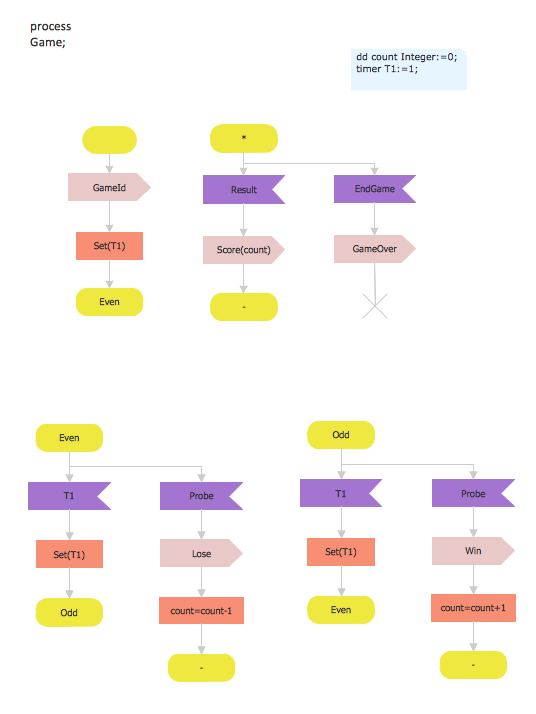
Sample 1. SDL process game.
This sample shows the SDL Diagram of the process game.
Use the ready-to-use predesigned objects, templates and samples from the Basic Diagramming Solution for ConceptDraw DIAGRAM you can create your own SDL Diagrams quick and easy.
The SDL Diagrams produced with ConceptDraw DIAGRAM are vector graphic documents and are available for reviewing, modifying, and converting to a variety of formats (image, HTML, PDF file, MS PowerPoint Presentation, Adobe Flash or MS Visio).
TEN RELATED HOW TO's:
ConceptDraw helps you to start designing your own UML Collaboration Diagrams with examples and templates.
Picture: Diagramming Software for Design UML Collaboration Diagrams
ConceptDraw DIAGRAM diagramming and vector drawing software offers the Entity-Relationship Diagram (ERD) Solution from the Software Development Area for ConceptDraw Solution Park. How many examples contains the Entity-Relationship Diagram (ERD) Solution! All Entity Relationship Diagram examples were designed and saved for ConceptDraw DIAGRAM users. Now they are available from ConceptDraw STORE.
Picture: Entity Relationship Diagram Examples
Related Solution:
The Onion Diagram is a type of circular diagram which consists of the core circle and concentric circles that look like the cross sections of onion. The key value of the Onion Diagram is to visually demonstrate the relationships that lead to a successful final product or deliverable.
Design of Onion Diagrams and Stakeholder Onions Diagrams is a complex process, but ConceptDraw DIAGRAM diagramming and vector drawing software makes it easier thanks to the Stakeholder Onion Diagrams Solution from the Management Area of ConceptDraw Solution Park, and the set of included libraries and Onion Diagram templates.
Picture: Onion Diagram Templates
Related Solution:
ConceptDraw DIAGRAM is a professional diagramming and vector drawing software. Now, enhanced with SysML Solution from the Software Development Area of ConceptDraw Solution Park, ConceptDraw DIAGRAM became an ideal software for model based systems engineering (MBSE).
Picture: Model Based Systems Engineering
Related Solution:
This sample was created in ConceptDraw DIAGRAM diagramming and vector drawing software using the Flowcharts solution from the Diagrams area of ConceptDraw Solution Park.
This sample shows the Flowchart that displays the procedures of 2PP (two-party preferred) voting and counting the voters. The two-party-preferred vote is the result of the elections that was distributed to the final two parties.
Picture: Basic Flowchart Images. Flowchart Examples
Related Solution:
The vector stencils library COM and OLE from the solution Software Engineering contains 15 symbols of the COM and OLE objects for ConceptDraw DIAGRAM software.
Picture: COM and OLE Diagram
Online collaboration tool for workgroups that extends Skype conference call possibilities. This professional solution makes meetings more powerful and discussions more lively. Great way to engage your audience.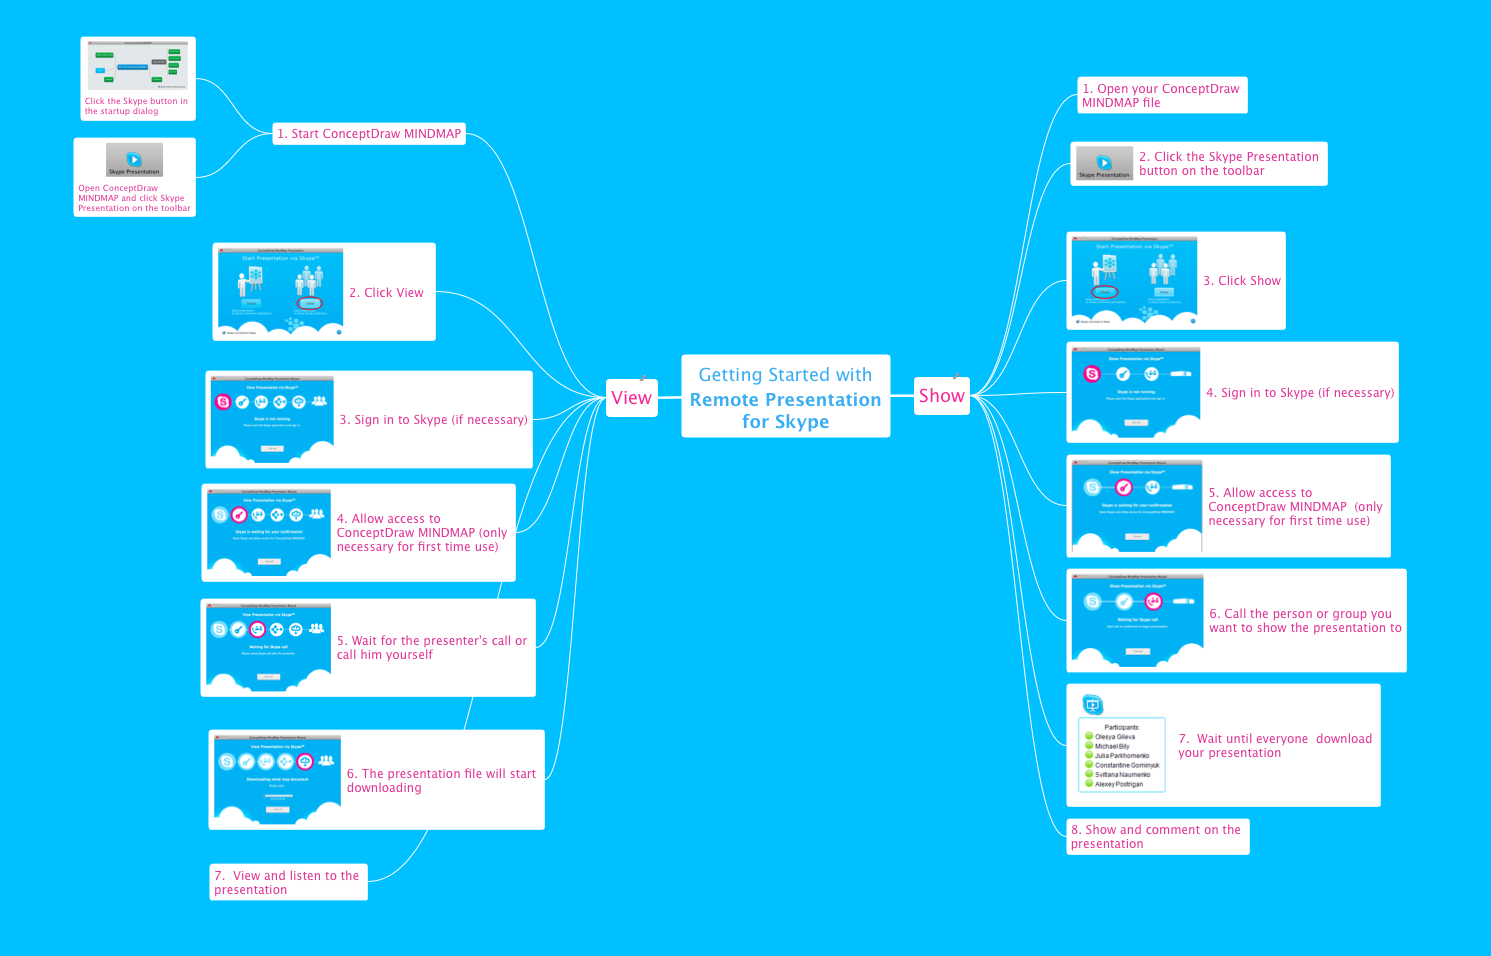
Picture: How To Collaborate via Skype
Related Solution:
This template shows the Context Diagram. It was created in ConceptDraw DIAGRAM diagramming and vector drawing software using the Block Diagrams Solution from the “Diagrams” area of ConceptDraw Solution Park.
The context diagram graphically identifies the system. external factors, and relations between them. It’s a high level view of the system. The context diagrams are widely used in software engineering and systems engineering for designing the systems that process the information.

Picture: Context Diagram Template
Related Solution:
Visual information is easier to perceive. You can teach even a child to make diagrams with a good flowchart example that would be interesting for it. Flowcharts can be fun, it’s not about business processes or programming algorithms.
This flowchart shows step by step process of manufacturing of Nixtamal The product which is obtained by processing maize with calcium hydroxide. We must assume that the Aztecs were very fond of this product, if the recipe of its production came to our times. This flow chart was designed using ConceptDraw DIAGRAM with its solution for designing flowcharts of various types, sizes and purposes. ConceptDraw Flowcharts solution consists from the library of flowchart symbols, containing the set vector objects. Also there are a lot of diverse templates and samples of flow charts.
Picture: Flowchart Examples and Templates
Related Solution:
While creating flowcharts and process flow diagrams, you should use special objects to define different statements, so anyone aware of flowcharts can get your scheme right. There is a short and an extended list of basic flowchart symbols and their meaning. Basic flowchart symbols include terminator objects, rectangles for describing steps of a process, diamonds representing appearing conditions and questions and parallelograms to show incoming data.
This diagram gives a general review of the standard symbols that are used when creating flowcharts and process flow diagrams. The practice of using a set of standard flowchart symbols was admitted in order to make flowcharts and other process flow diagrams created by any person properly understandable by other people. The flowchart symbols depict different kinds of actions and phases in a process. The sequence of the actions, and the relationships between them are shown by special lines and arrows. There are a large number of flowchart symbols. Which of them can be used in the particular diagram depends on its type. For instance, some symbols used in data flow diagrams usually are not used in the process flowcharts. Business process system use exactly these flowchart symbols.
Picture: Flowchart Symbols: Meaning and Examples
Related Solution: