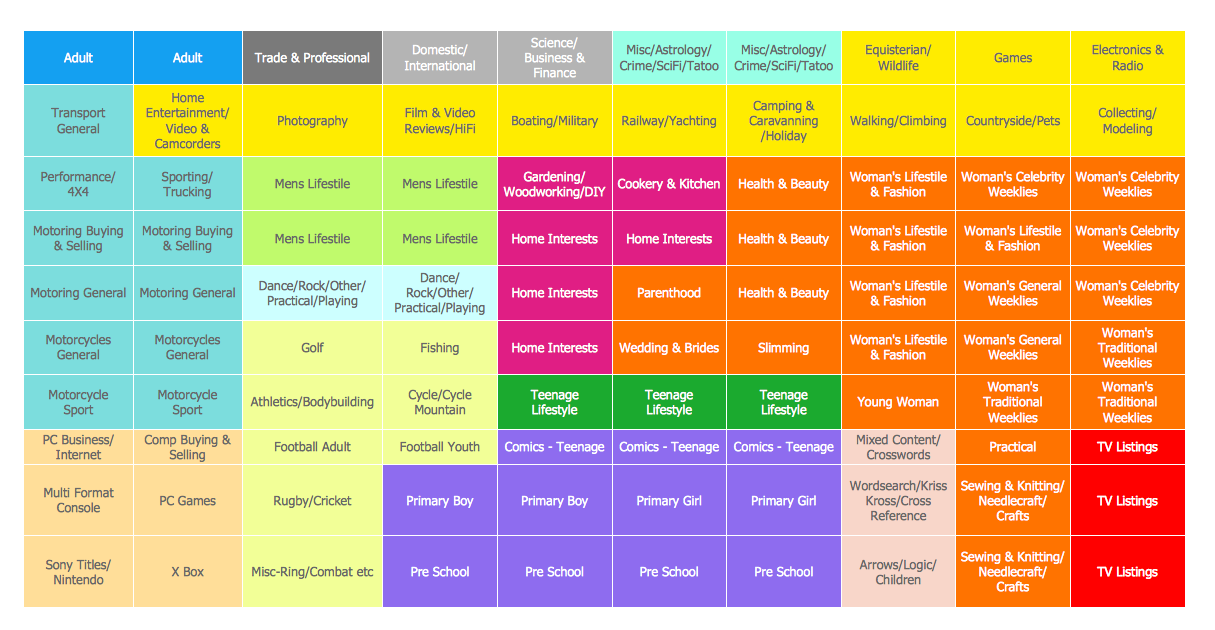
Sample 1. Planogram for magazines.
This example shows the planogram for magazines.
Use the ready-to-use predesigned objects, templates and samples from the Basic Diagramming Solution for ConceptDraw DIAGRAM you can create your own professional looking Planograms quick, easy and effective.
The Planograms produced with ConceptDraw DIAGRAM are vector graphic documents and are available for reviewing, modifying, and converting to a variety of formats (image, HTML, PDF file, MS PowerPoint Presentation, Adobe Flash or MS Visio).
SEVEN RELATED HOW TO's:
Working as a designer, you might find developing projects exciting and difficult at the same time. It is a challenging task to create a usable interior design that will fulfill all the customer’s requirements. So, in order to aid yourself, you can use special software to create site plans, landscape designs, furniture layouts.
This example of an interior plan introduces an internal area of a small cafe. The floor plan demonstrates interior angle "view from above". It involves many different elements of furniture such as tables , chairs and various cushioned furniture. Also it includes a kitchen fixtures and furniture. Making this plan was managed by the ConceptDraw Cafe and Restaurant Floor Plan solution. The libraries, composing this solution contain about vector graphic 300 objects. It can be use to help interior designers to develop interior design proposals, communicate ideas and concepts that relate to a interior design.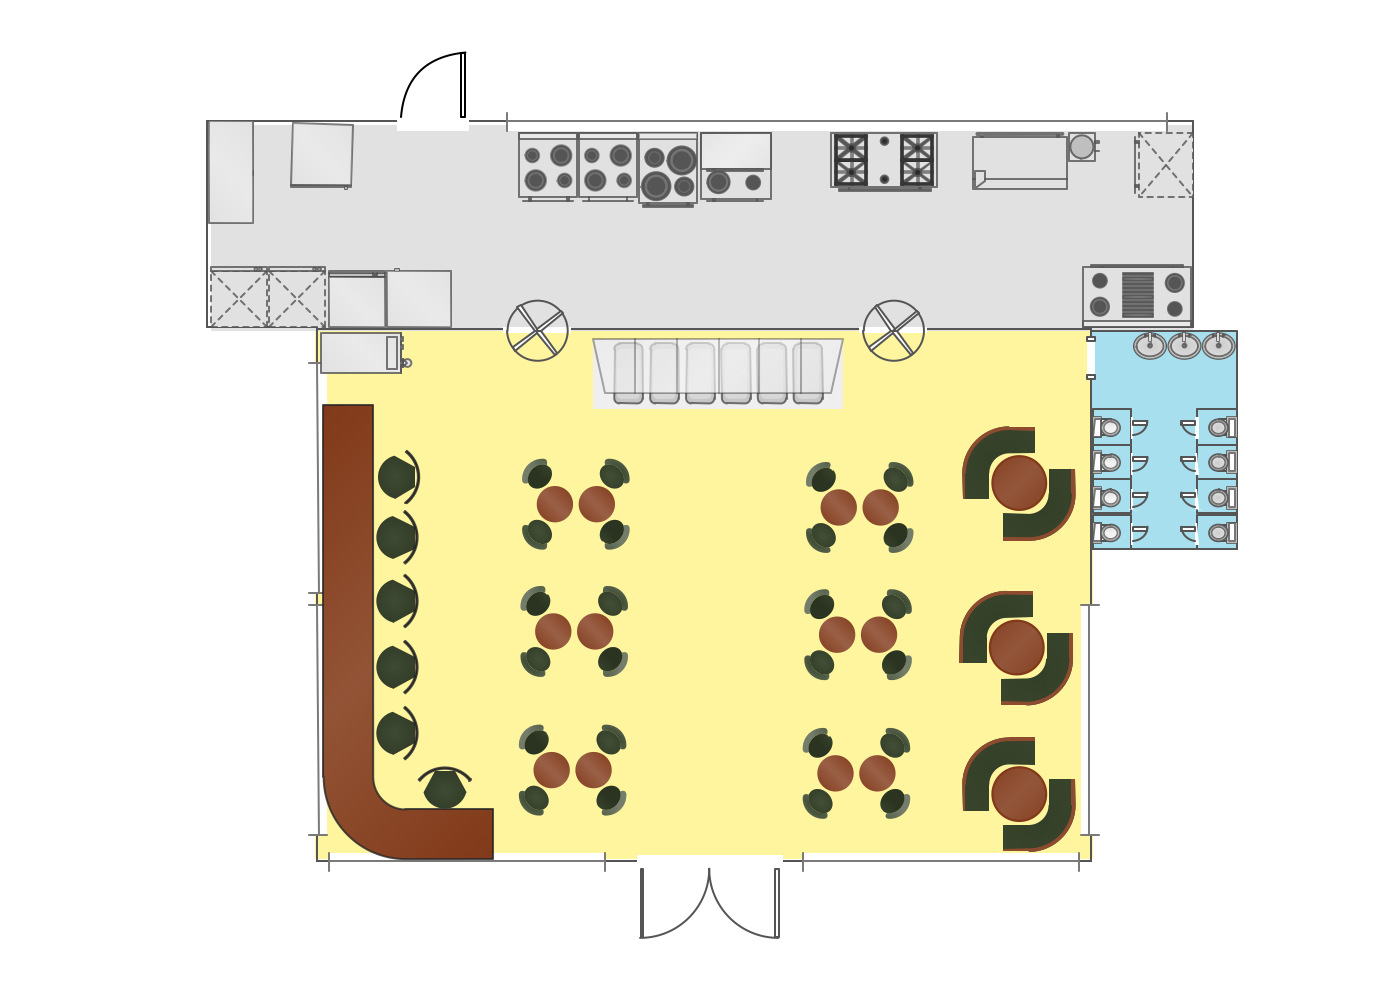
Picture: Interior Design
Related Solution:
When deciding to start your own business, you have to take into account a bunch of different aspects. One of the ways to get inspired is to look through various restaurant floor plans samples or interior photos of already known establishments. This will help you, but keep in mind that a really unforgettable establishment must be unique.
This restaurant floor plan diagram was designed using ConceptDraw Cafe and Restaurant Floor Plan solution. It can be used as a sample while considering a custom restaurant design. With the help of this example you can estimate the amount of furniture best for a dining room or kitchen of the restaurant. In addition, this plan would be useful as a check list when you will consider a list of the furniture and equipment needed for all areas of the future restaurant.
Picture: Restaurant Floor Plans Samples
Related Solution:
ConceptDraw DIAGRAM software enhanced with Organizational charts solution is an essential tool to ✔️ show the internal structure of an organization, ✔️ outline the hierarchy, ✔️ display key roles or job titles, ✔️ show relationships among employees or departments, ✔️ facilitate communication and cooperation, ✔️ visualize reporting relationships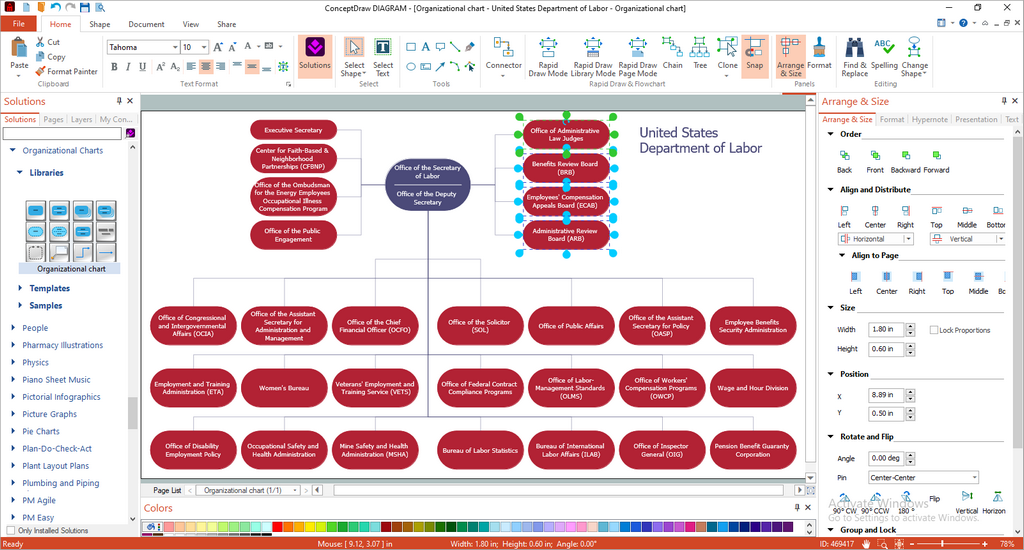
Picture: Organization Chart Software: A Comprehensive Guide
Related Solution:
ConceptDraw DIAGRAM diagramming and vector drawing software extended with tools of Flowcharts Solution from the Diagrams Area of ConceptDraw Solution Park ideally suits for fast and easy Online Flow Chart designing. We propose to verify this right now.
Picture: Online Flow Chart
Related Solution:
Mind map template for organizing various elements required for planning a business.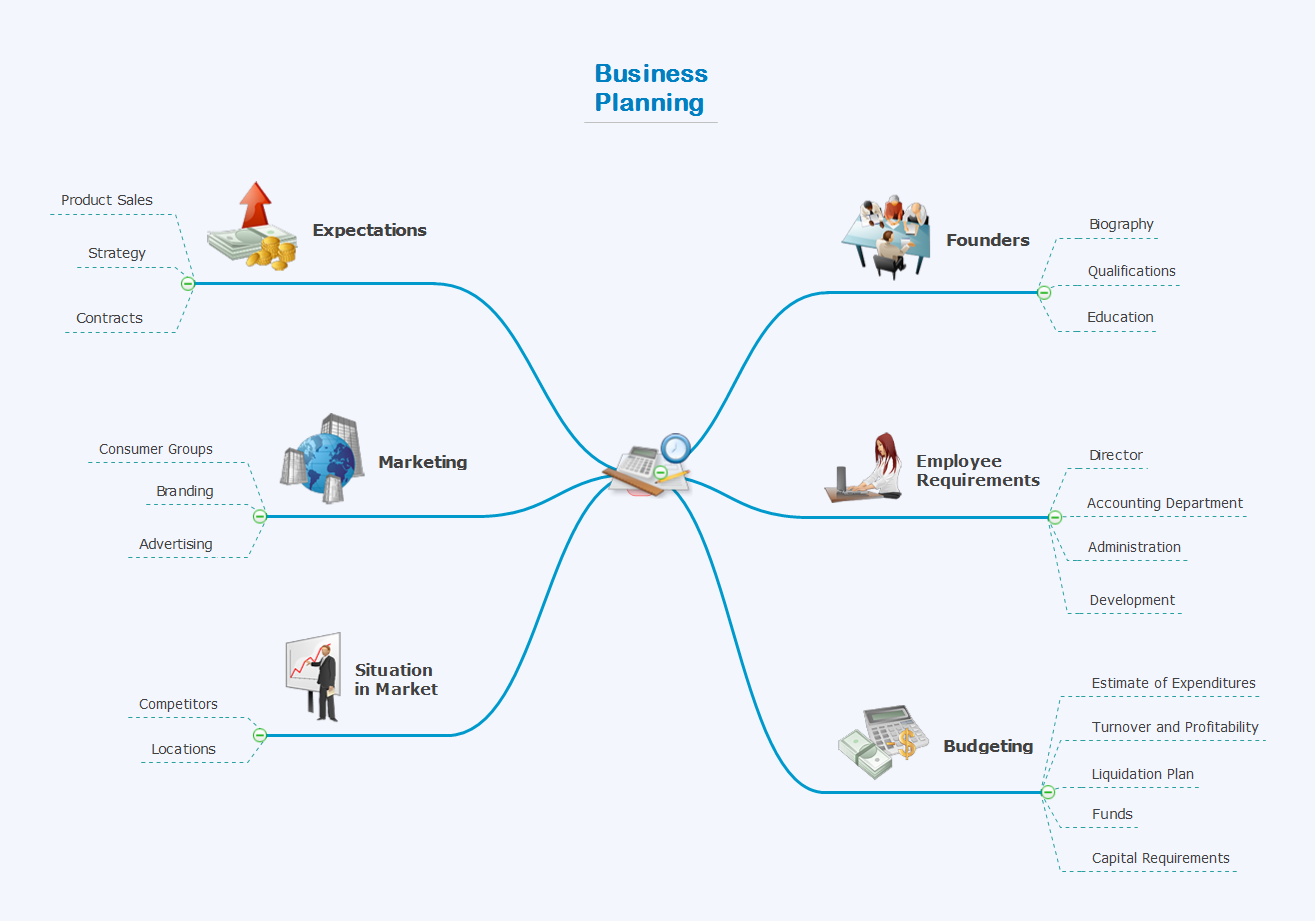
Picture: Business Planning
Related Solution:
The Organizational Chart is a diagram that shows the structure of the organization and the relationships of its parts. There are many ways to present the Organizational Chart. One of them is the Horizontal Organizational Chart: the parts of the diagram are arranged from left to right, or from right to left.
This sample was created in ConceptDraw DIAGRAM diagramming and vector drawing software using the Organizational Charts Solution from the Management area of ConceptDraw Solution Park.
Picture: Horizontal Orgchart
Related Solution:
ConceptDraw offers you a number of ready-made organizational chart templates which you can use in your drawing. They are grouped in topical sets as organizational chart template files.
Use the Organizational Charts Solution for ConceptDraw DIAGRAM to create your own Organizational Charts of any complexity quick, easy and effective.
The Organizational Charts designed with ConceptDraw DIAGRAM are vector graphic documents and are available for reviewing, modifying, converting to a variety of formats (image, HTML, PDF file, MS PowerPoint Presentation, Adobe Flash or MS Visio XML), printing and send via e-mail in one moment.
Picture: Organizational Chart Templates
Related Solution: