
Example 1. Planogram Software and Retail Plan Software
Each shop, boutique or other retail sale point is a unique place with its own demands, requirements and customer preferences, so in each case it is required an individual approach and plan. The ConceptDraw DIAGRAM Planogram Software and Retail Plan Software will help you effectively design your individual plans of any complexity.
Planogram and Retail Plan Elements
The Enterprise Architecture Diagrams solution for ConceptDraw DIAGRAM provides easy-to-use drawing tools, and Enterprise Architecture Diagrams library with a number of predesigned planogram and retail plan vector elements. All this collection lets facilitate as much as possible drawing exceptionally looking Planograms and Retail Plans.

Example 2. Planogram and Retail Plan Design Elements
You can also use for filling your Planograms and Retail Plans the vector elements offered in plenty by other libraries of numerous solutions from ConceptDraw Solution Park. All solutions and their libraries are available for using from ConceptDraw STORE.
Planogram and Retail Plan Sample
ConceptDraw DIAGRAM gives you the perfect choice - design your own Planograms and Retail Plans at new blank ConceptDraw document using the predesigned library objects, or use as the base one of predesigned samples from ConceptDraw STORE and simply change it according to your needs.

Example 3. Planogram and Retail Plan Sample
The following features make ConceptDraw DIAGRAM the best Planogram Software and Retail Plan Software:
- You don't need to be an artist to draw professional looking plans in a few minutes.
- Large quantity of ready-to-use vector objects makes your drawing diagrams quick and easy.
- Great number of predesigned templates and samples give you the good start for your own planograms and retail plans.
- ConceptDraw DIAGRAM provides you the possibility to use the grid, rules and guides. You can easily rotate, group, align, arrange the objects, use different fonts and colors to make your diagram exceptionally looking.
- All ConceptDraw DIAGRAM documents are vector graphic files and are available for reviewing, modifying, and converting to a variety of formats: image, HTML, PDF file, MS PowerPoint Presentation, Adobe Flash, MS Visio.
- Using ConceptDraw STORE you can navigate through ConceptDraw Solution Park, managing downloads and updates. You can access libraries, templates and samples directly from the ConceptDraw STORE.
- If you have any questions, our free of charge support is always ready to come to your aid.
TEN RELATED HOW TO's:
The Office Layout Plans Solution contains a large quantity of vector objects that will make your creating of the office design plans easy, quick and effective. It also provides templates and samples that will help you create the office designs of any difficulty in one moment.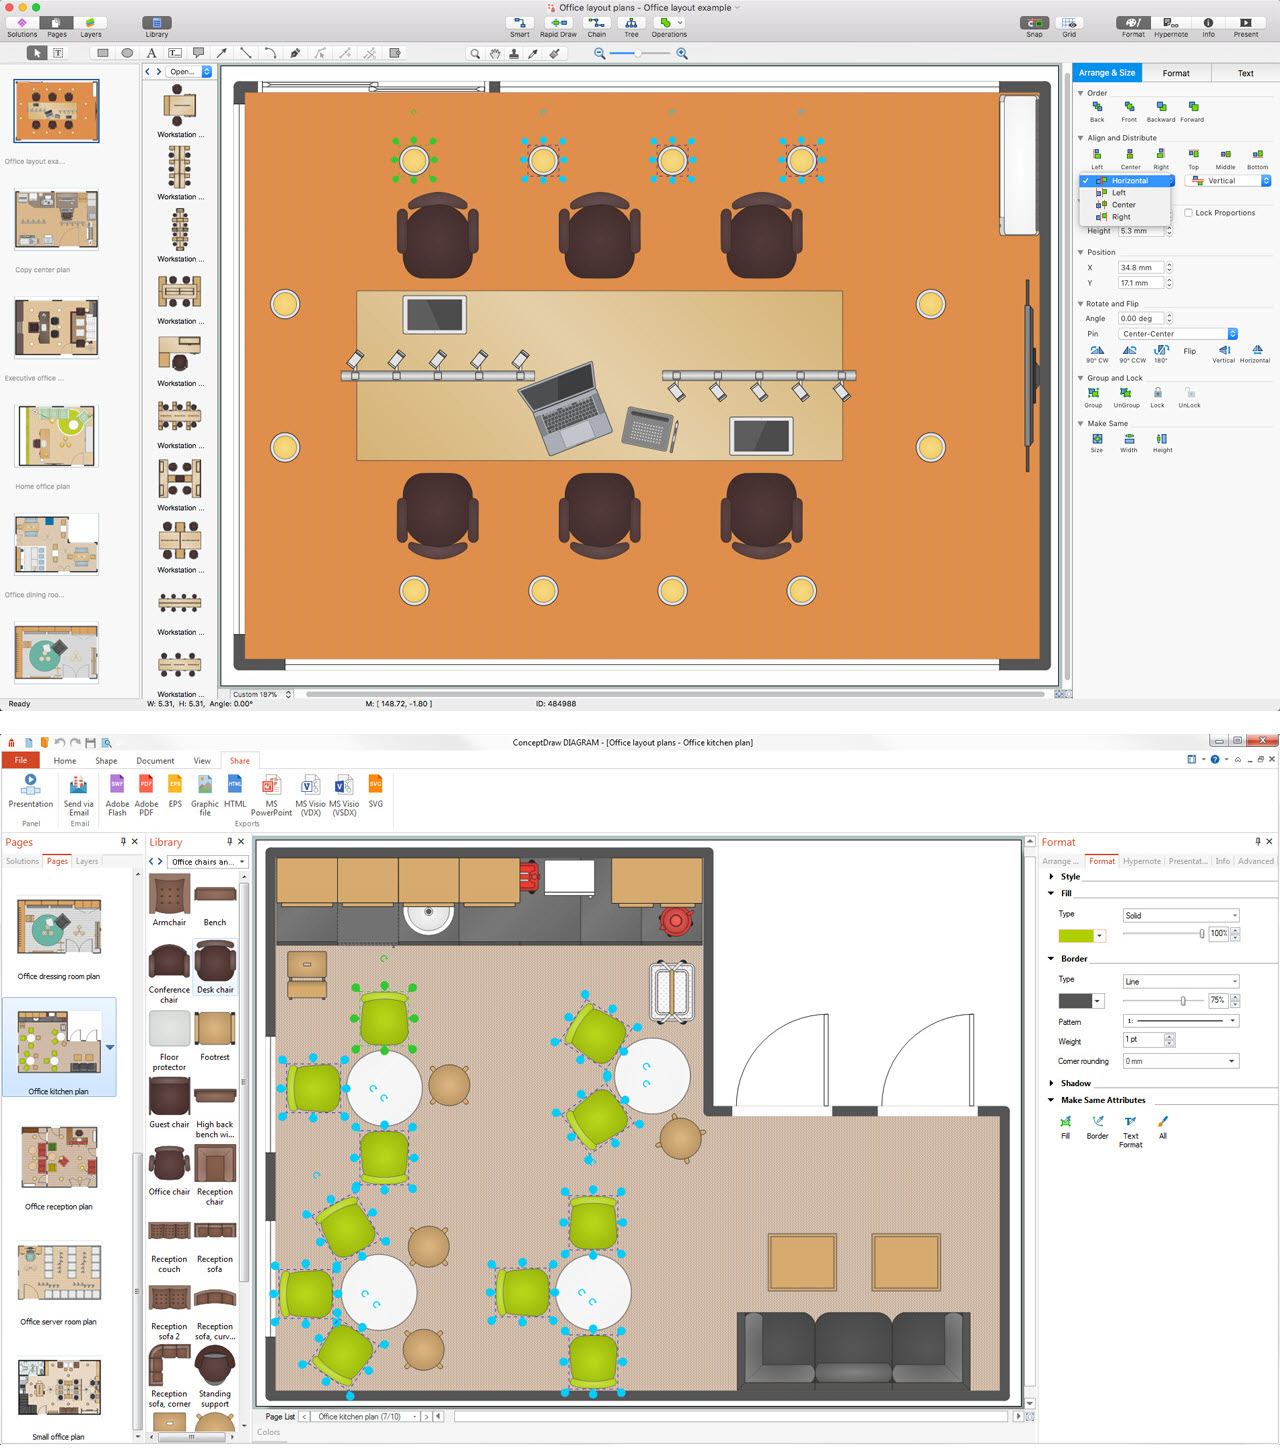
Picture: Office Design Software
Related Solution:
ConceptDraw DIAGRAM extended with IDEF0 Diagrams solution from the Software Development area of ConceptDraw Solution Park is a powerful diagramming and vector drawing IDEF0 software. All IDEF0 diagrams created in ConceptDraw DIAGRAM are vector graphic documents and can be reviewed, modified and converted to MS Visio XML format. To obtain the IDEF0 Visio documents from ConceptDraw DIAGRAM documents use the wide export possibilities of ConceptDraw DIAGRAM.
Picture: IDEF0 Visio
Related Solution:
Internet solutions on ConceptDraw base. What may interest developers of Internet solutions.
Picture: Software development with ConceptDraw products
Different organizations have different organizational structures. Matrix organization is one of the most popular and widely used type of organizational structure. Use ConceptDraw DIAGRAM diagramming and vector drawing software extended with 25 Typical Orgcharts solution from the Management area of ConceptDraw Solution Park for fast and easy designing matrix organizational chart for your company.
Picture: Matrix Organization
Related Solution:
Nowadays, it's easy to create any drawing with appropriate software tools. Special Seating Plan solution from Building Plans area has all the design elements possible to create any seating plan that you might need. It might be a plan of a theater, or a cinema or even a wedding plan.
A seating plan is an indispensable element of any public event organization. Well thought-out arrangement of seats, furniture and other items help making the event a successful and effective. If you are organizing a spectacular event in a big theater or in a banquet hall, ConceptDraw Seating Plans solution is the tool for you. Especially its library of graphic elements for large and small blocks of seats, stairs, sectors, stage and backstage - just 67 vector objects. The Seating Plans Solution is specially developed for seating plans easy construction. With the help of this solution you'll quickly sketched the seating plan for any event
Picture: Building Drawing Software for Design Seating Plan
Related Solution:
Creating diagrams and schemes is a pleasure with proper software. You don’t need any additional skills to create organizational chart quick and effectively with our diagramming tool. Create your ConceptDraw account today and start your diagramming experience.
This is the most regular type of organizational chart - hierarchical. It is created using the ConceptDraw Organizational Charts solution. Its composition can be displayed as a pyramid, with an only person in authority at the top, with sub-levels of management below them. According to hierarchy, an employee communicates only to his immediate head or subordinates. A hierarchical organizational structure may be choice for a businesses that work on multiform markets or any other organization that has a workflow requiring a multilevel structure of middle management.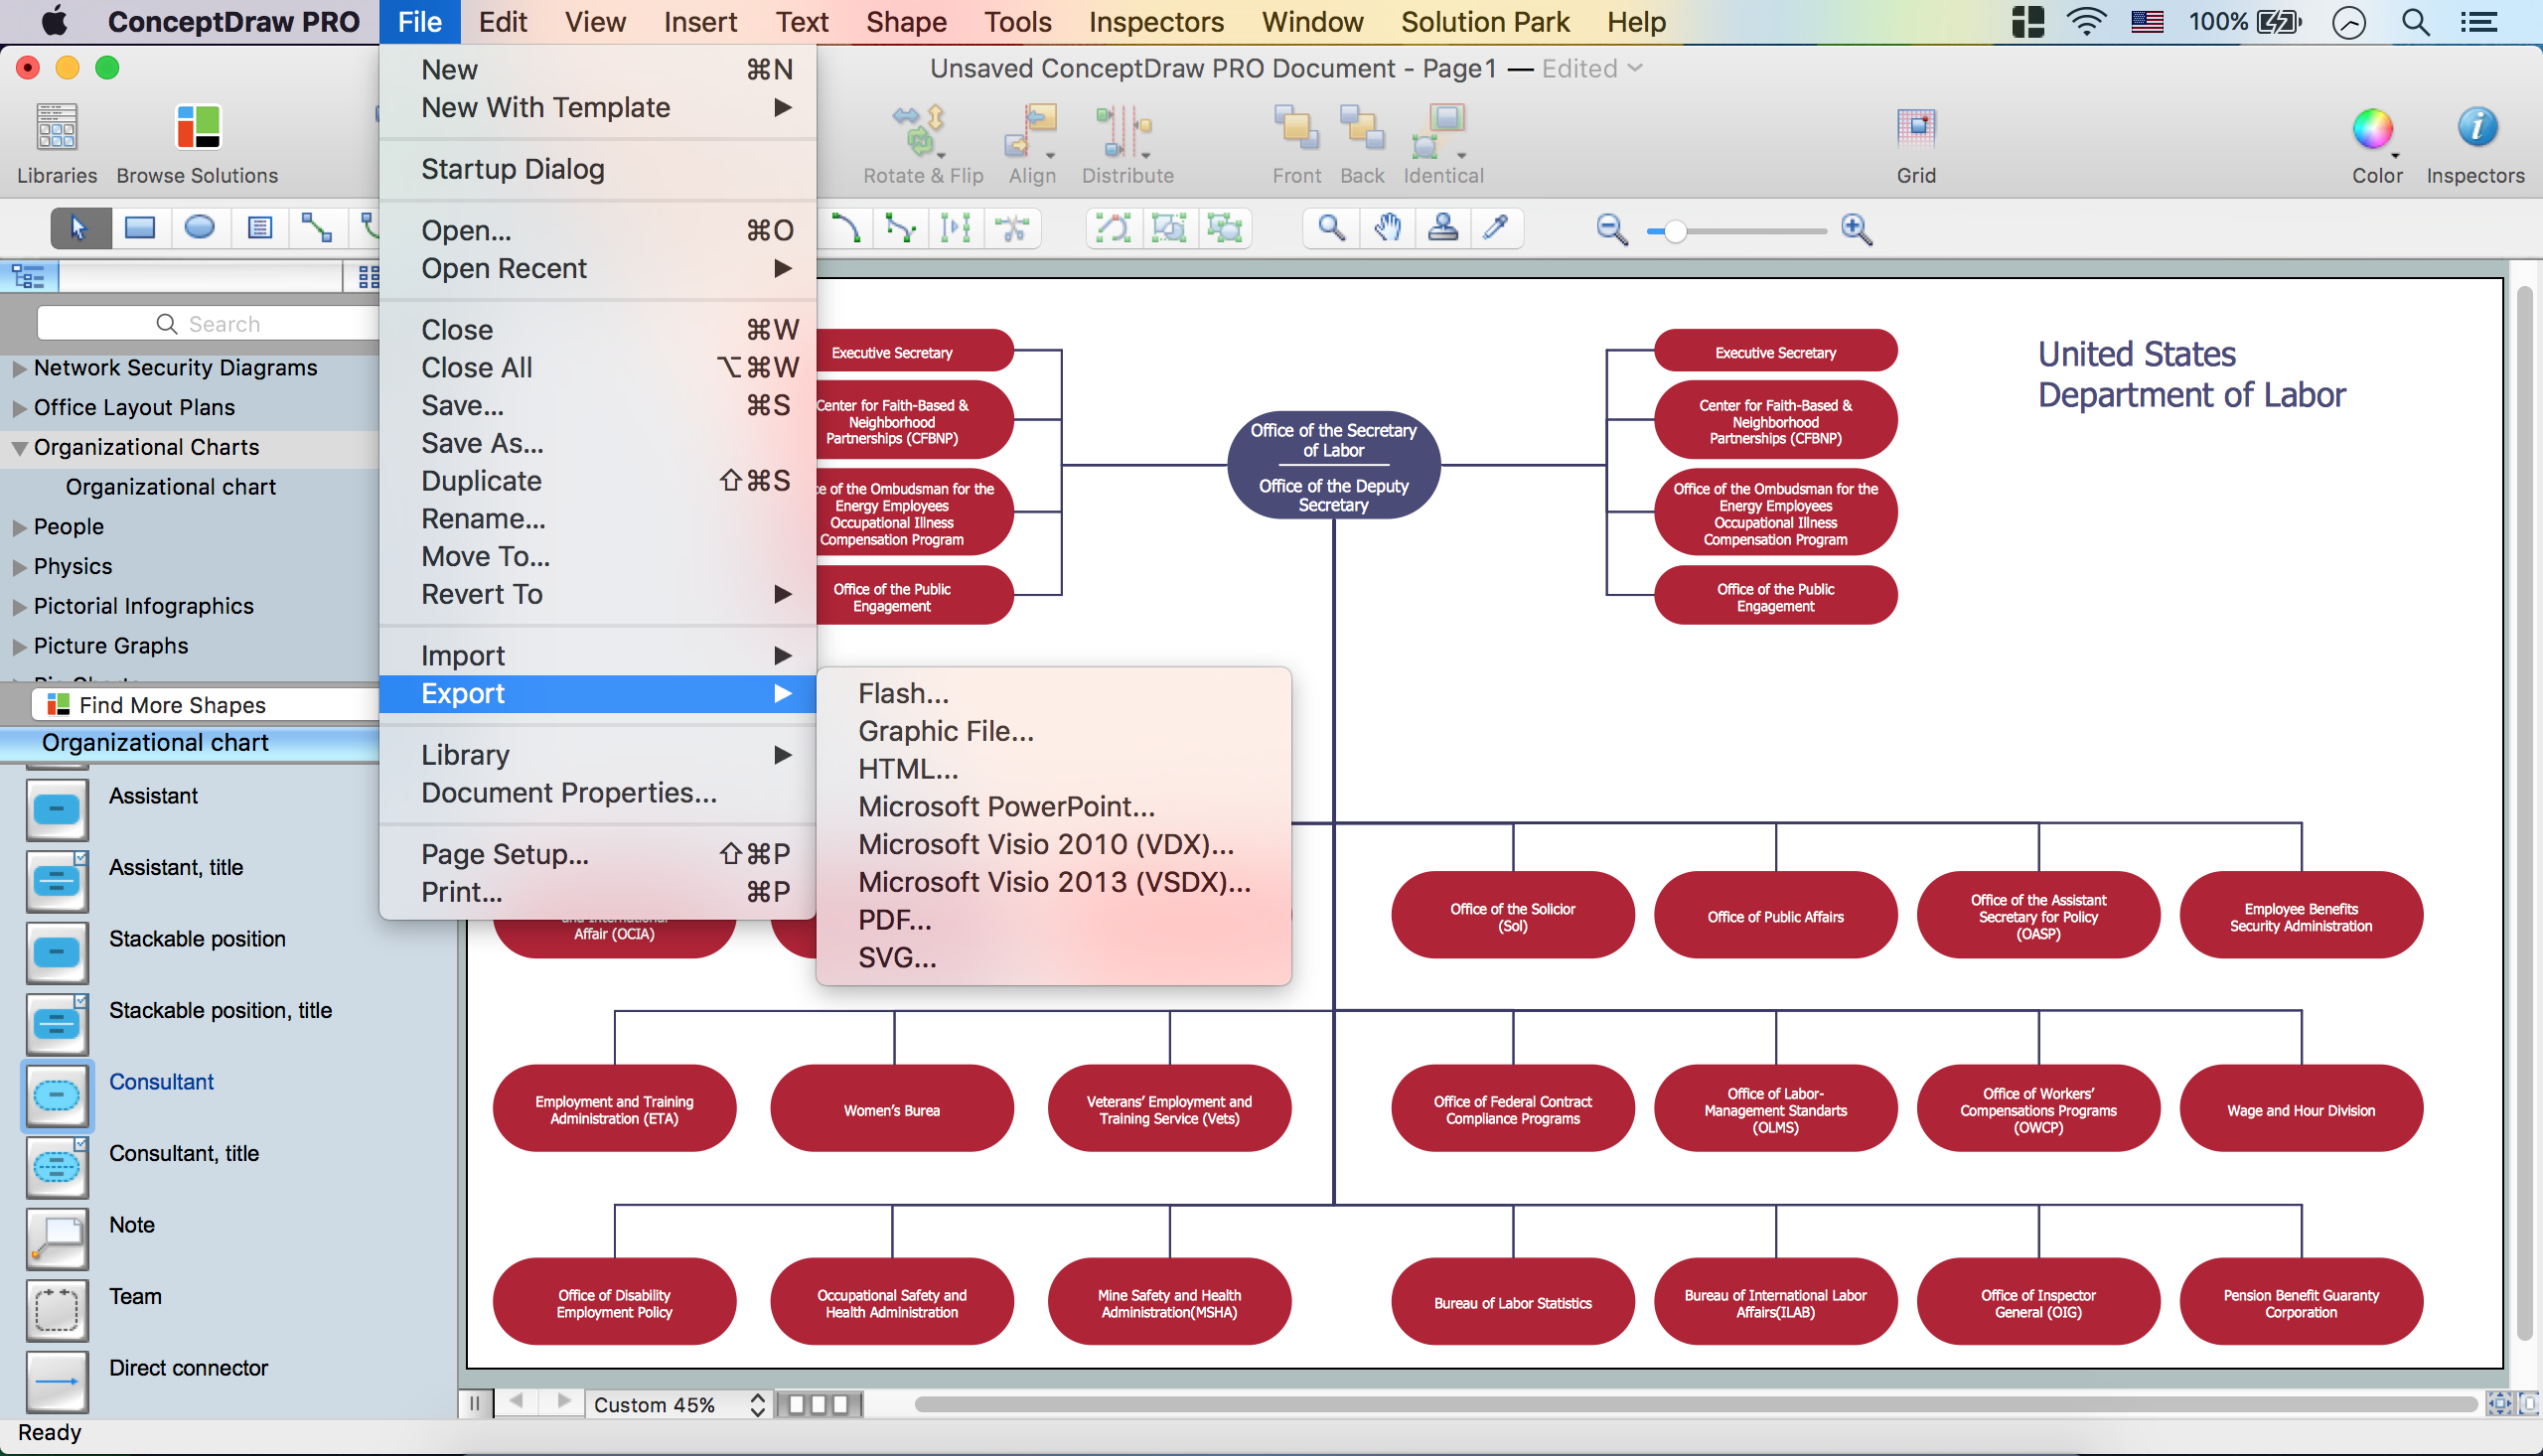
Picture: Create Organizational Chart
Related Solution:
You can use many tools to create a representation of a system behavior or a scheme of objects relationships. Some of them are quite abstract and useless, and some, like UML tools help clarifying both the structure and the behavior of a system. There are various types of uml diagrams and tons of examples explaining the difference between them.
UML 2.2 specification has many kinds of diagrams. They are divided into two groups( structure and behavior diagrams). This class diagram shows the hierarchical structure of UML 2.2 specification. Class diagram - the most suitable tool for this task because it is designed to describe basic structure of a system. This diagram can be use as a visual aid for learning UML.
Picture: UML Tool & UML Diagram Examples
Related Solution:
ConceptDraw DIAGRAM is a powerful drawing and vector diagram maker software that allows to design the professional looking Influence Diagrams quick and easy.
Picture: Influence Diagram Software
Related Solution:
You want to connecting objects manually?
You don't know how should diagramming software work?
Is it possible to develop a diagram as quickly as the ideas come to you?
Yes. The innovative ConceptDraw Arrows10 Technology - This is more than enough versatility to draw any type of diagram with any degree of complexity.
You can start draw your diagram manually now.
Picture: ConceptDraw Arrows10 Technology
Identify and Structure Factors. Use the Affinity Diagram to collect and structure factors that impact on a problem.
ConceptDraw OFFICE suite is a software for identify and structure factors with affinity diagram. This is a grouping and structuring of factors that impact on a problem.
Picture: PROBLEM ANALYSIS. Identify and Structure Factors

