
Example 1. Fishbone Diagram Example - Production Process
All predesigned templates and samples of Fishbone Diagrams Solution are available from ConceptDraw STORE which is the best for easy navigation through a ConceptDraw Solution Park.

Example 2. Fishbone Diagrams in ConceptDraw STORE
Starting with one of templates you can also use the predesigned vector objects from the Fishbone diagrams library to expand and refine your diagram. Use of these objects will allow you easy construct any Fishbone diagram example you want.
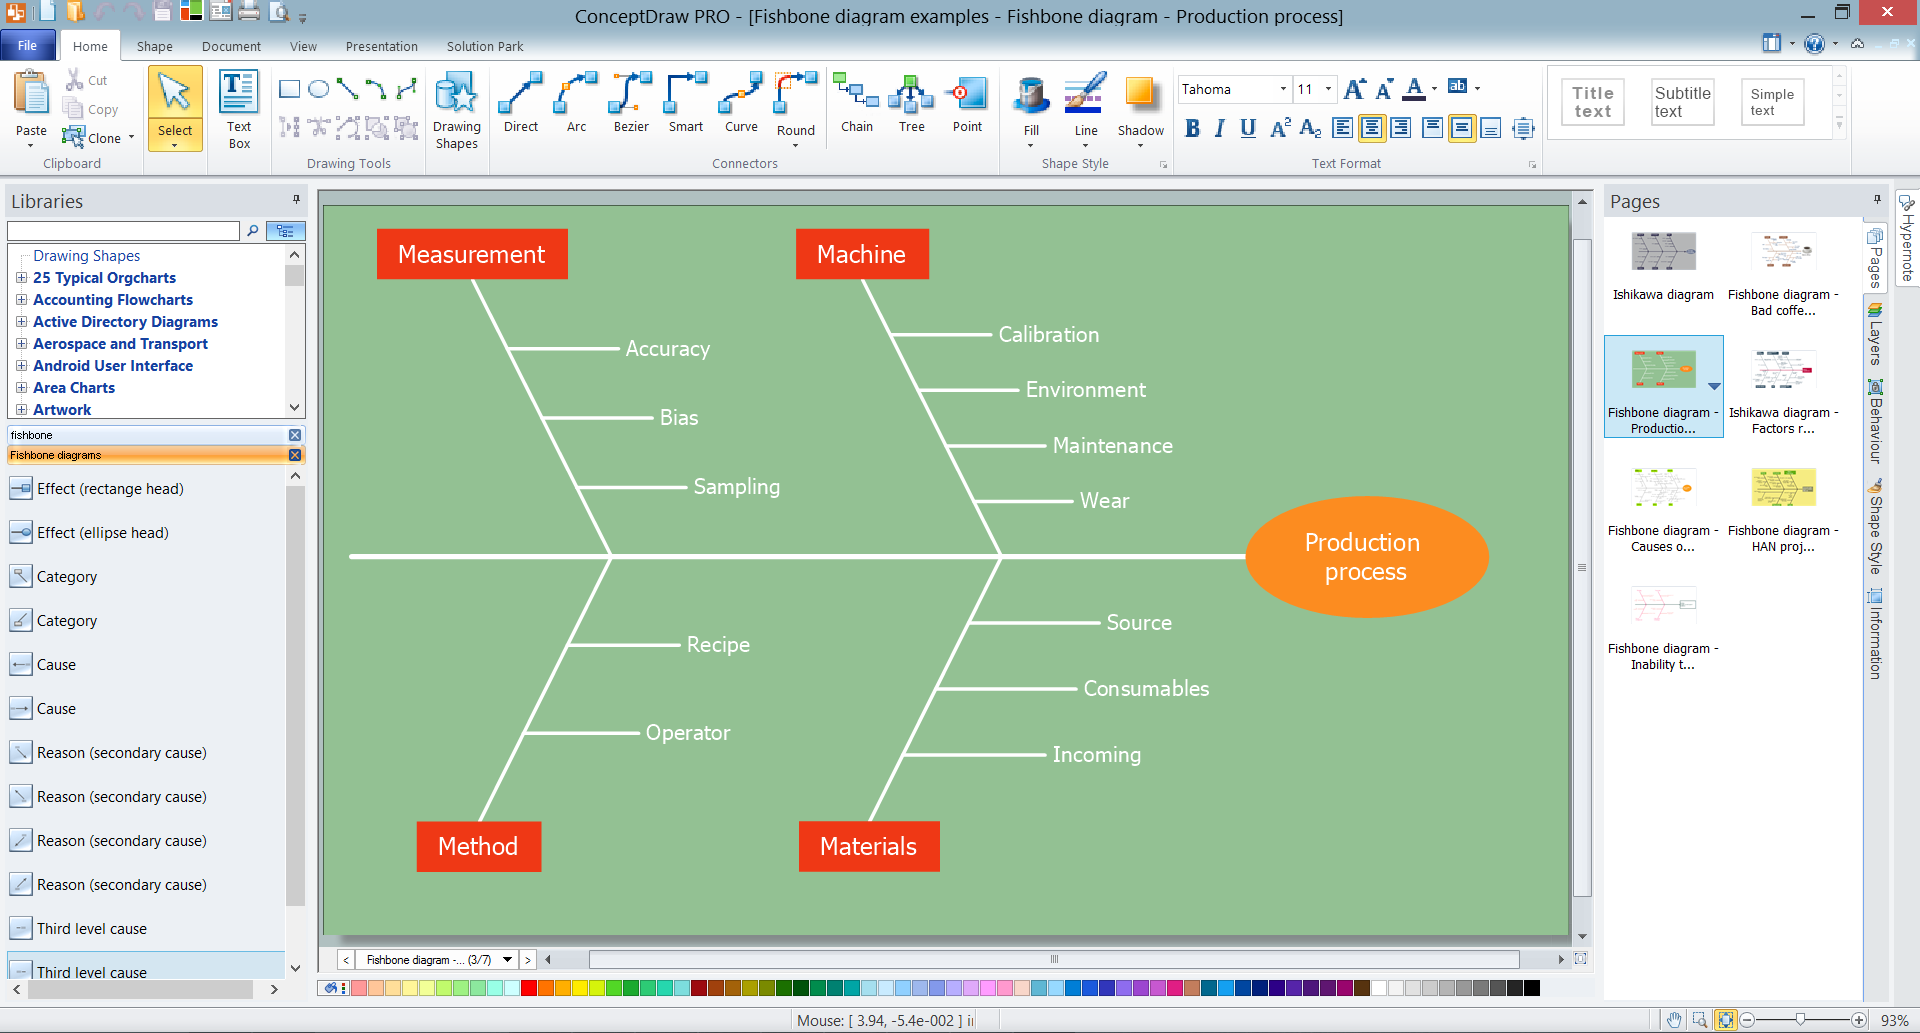
Example 3. Fishbone Diagram Example in ConceptDraw DIAGRAM /p>
The Fishbone diagram example you see on this page was created in ConceptDraw DIAGRAM using the tools of the Fishbone Diagrams Solution. It depicts the possible causes and factors for a production process, and relationships among these factors. An experienced user spent 5 minutes creating this sample.
Use the Fishbone Diagrams Solution for ConceptDraw DIAGRAM Solution Park for fast, easy and effective cause and effect analysis.
All source documents are vector graphic documents. They are available for reviewing, modifying, or converting to a variety of formats (PDF file, MS PowerPoint, MS Visio, and many other graphic formats) from the ConceptDraw STORE. The Fishbone Diagrams Solution is available for all ConceptDraw DIAGRAM or later users.
TEN RELATED HOW TO's:
eLearning with Skype without attending classes. Skype as a communication and instructional tool allows trainers to meet with students online and run training sessions. Solution which provides effective results.
Picture: Skype - eLearning Learning
Related Solution:
Flow diagrams is a diagram used for structuring complex system and visually representing a flow and interactions of elements in a system.
ConceptDraw DIAGRAM diagramming and vector drawing software enhanced with Flowcharts Solution from the Diagrams Area of ConceptDraw Solution Park is perfect for easy drawing professional looking Flow Diagrams.
For drawing Flow Diagrams the Flowcharts Solution provides: 2 libraries with commonly used predesigned vector objects - Flowchart library and Flowcharts Rapid Draw library; collection of Flow Diagrams samples; Basic Flowchart template.
Picture: Flow Diagrams
Related Solution:
ConceptDraw Wireless Network solution includes several wireless network diagram examples that users can modify and make your own diagram.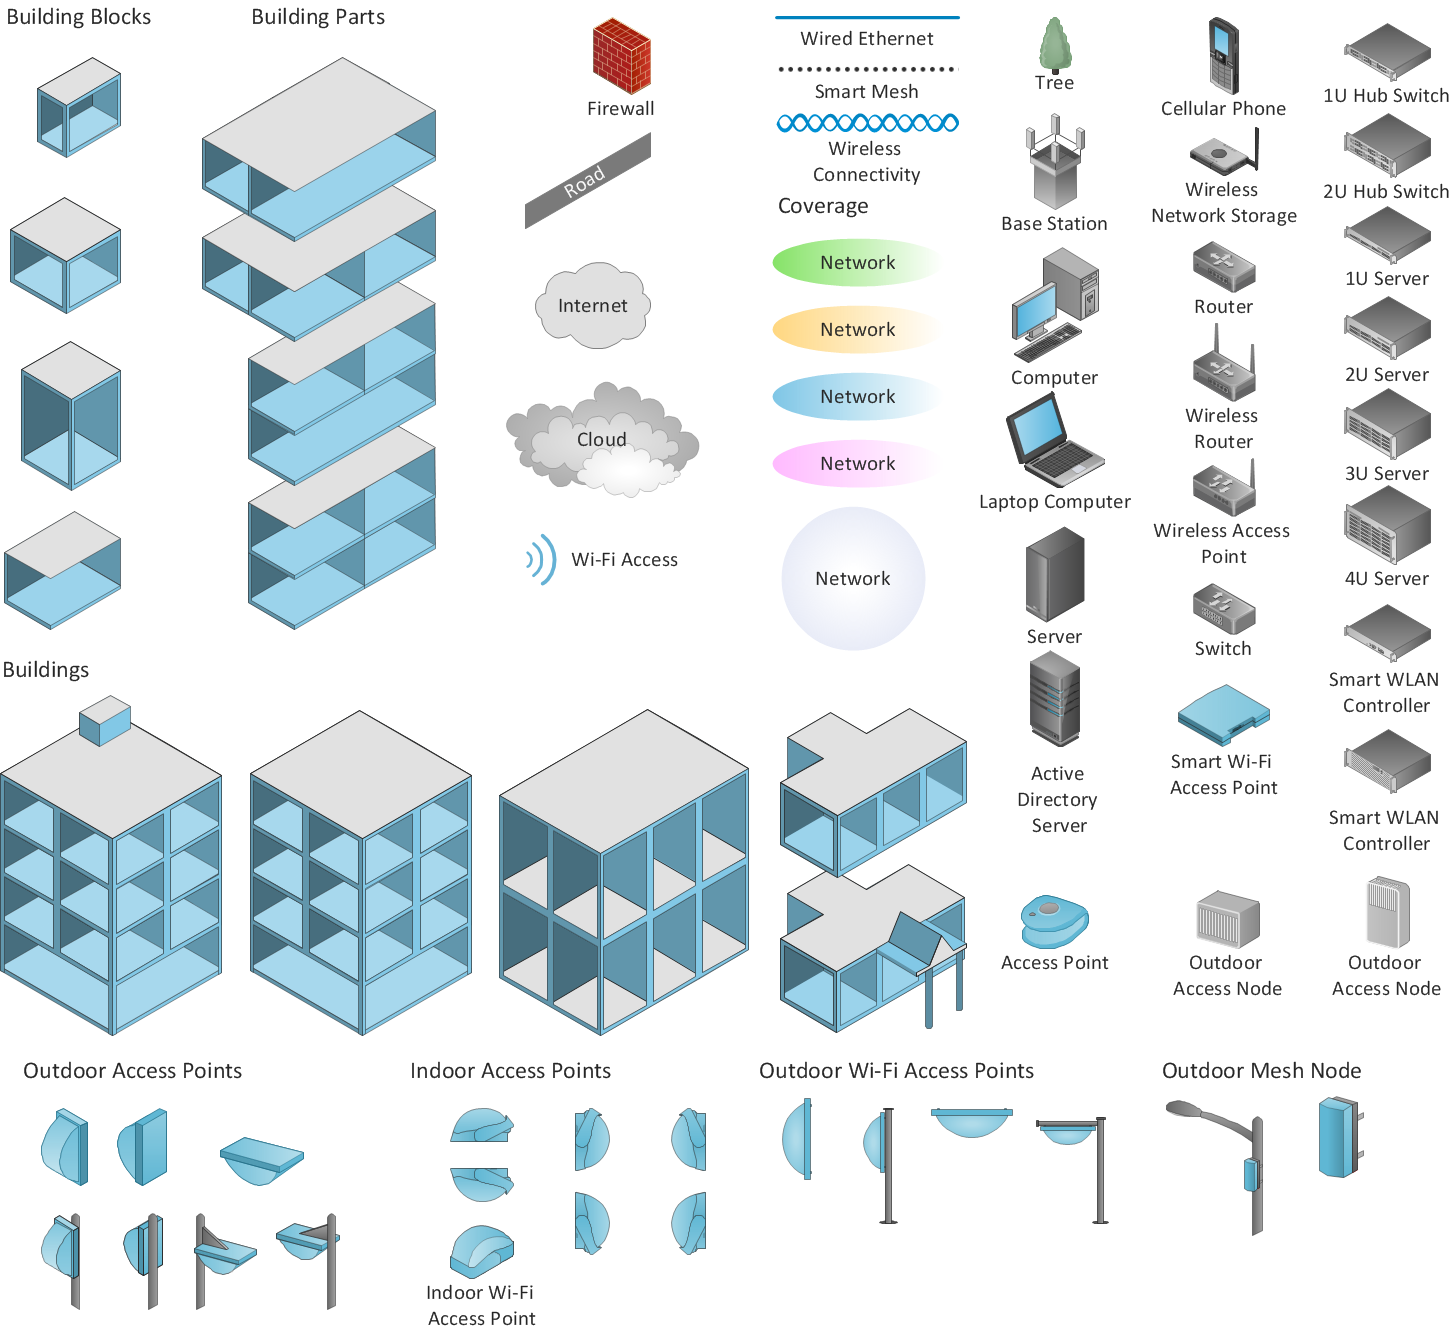
Picture: Wireless Network Diagram Examples
Related Solution:
Big and complex projects sometimes need some simplification of plans and schedules. That's why Program Evaluation and Review Technique was invented and first implemented in 1958. You can create PERT diagrams effortlessly with ConceptDraw DIAGRAM and share them with your colleagues.
Program Evaluation Review Technique (PERT) is a method that is used to assess and analyze projects. PERT is a valuable tool for the project management practice. PERT gives an assessment and analysis of the time needed to the project completion. A PERT chart is a visual tool that delivers a graphical view of a project timeline. It is used to display the sequences and dependences of project tasks necessary to complete a project. ConceptDraw DIAGRAM delivers the possibility to build a PERT along with other diagrams applied to assist management process by using its Seven Management and Planning Tools solution.
Picture: Program Evaluation and Review Technique (PERT) with ConceptDraw DIAGRAM
Related Solution:
The reliability is a cornerstone for any corporate computer network. If you want to provide a high fault tolerance, a mesh network topology would be the solution. The main advantage of this network is that every node can work as a commutator, although it’s not easy to set up this kind of network.
A mesh network topology may be full, or partial. Full mesh network means that each node of the network (computer, workstation or other equipment) is connected directly to each of the other nodes. A partial mesh topology means that a part of nodes are connected with a whole network, and the other part of nodes are only connected to those equipment, they exchange the majority of data. This illustration shows schematic diagram of a partial mesh network containing six nodes. Each node is represented as a circles and connections are drawn as straight lines. The connections may be both wired and wireless. This scheme can be used to make the specific logical or physical network diagrams by means the ConceptDraw Computer and Networks solution.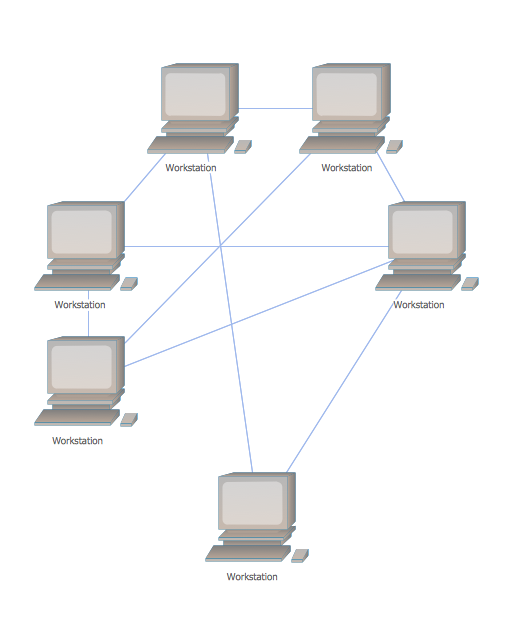
Picture: Mesh Network Topology Diagram
Related Solution:
Organizing and Selecting Social Media Response Messages.
Interactive Flowcharts can change the way one creates and organizes their social media response process.
Picture: What is Interactive Flowcharts
Related Solution:
Event-Driven Process chain Diagrams for improvement throughout an organisation. Best software for Process Flow Diagram. The Event-driven Process Chain (EPC) Diagrams allows managers to plan processes and resources.
Picture: Business process Flow Chart — Event-Driven Process chain (EPC) diagrams
Related Solution:
UML Apartment Plan. This sample was created in ConceptDraw DIAGRAM diagramming and vector drawing software using the UML Class Diagram library of the Rapid UML Solution from the Software Development area of ConceptDraw Solution Park.
This sample show the detailed plan of the apartment and is used by building companies, design apartments, real estate agencies, at the buying / selling of the realty.
Picture: UML Class Diagram Example - Apartment Plan
Related Solution:
You need design the Marketing Organization Chart and look for effective software? Now it's incredibly easy to do this in ConceptDraw DIAGRAM which was supplied with Marketing Diagrams Solution from the Marketing Area of ConceptDraw Solution Park.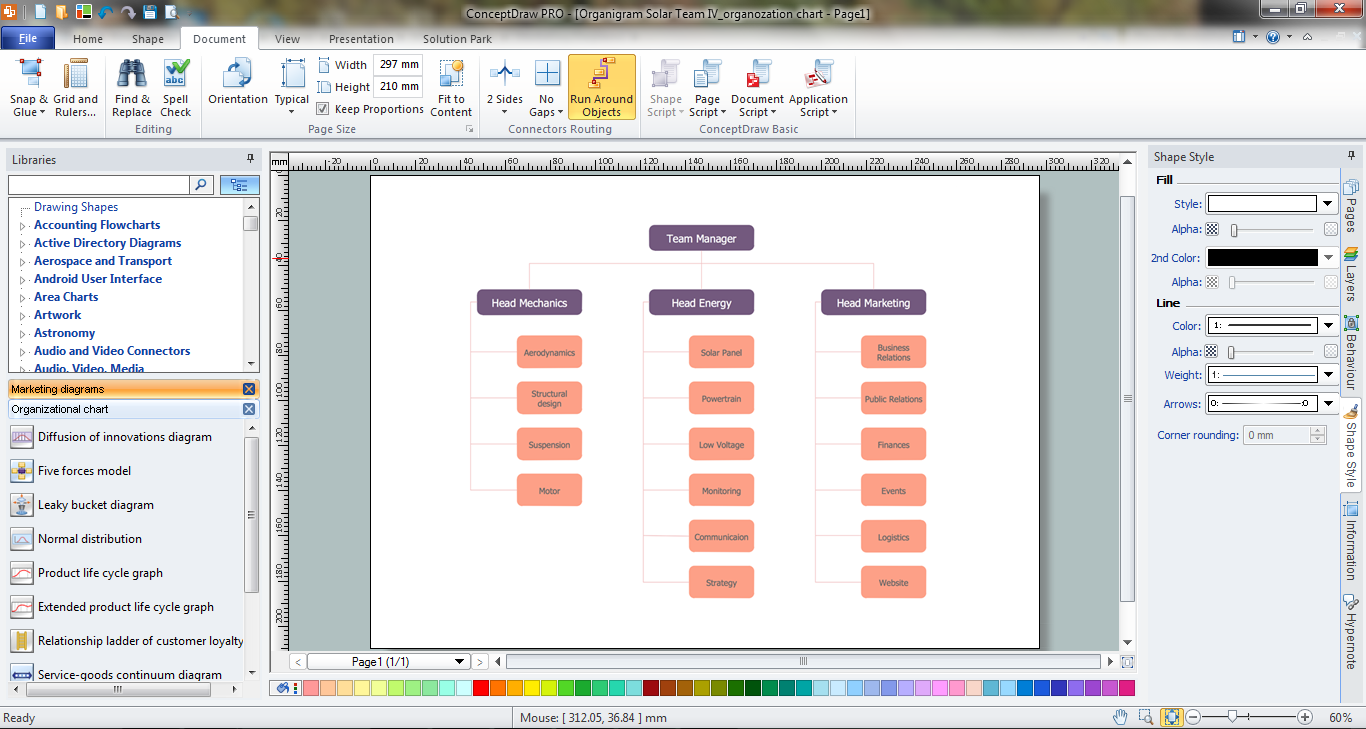
Picture: Marketing Organization Chart
Related Solution:
ConceptDraw - Organigram software allows quickly create Organigrams and much more. ConceptDraw DIAGRAM is an ideal tool for Administrative staff to clearly demonstrate the company orgchart professional.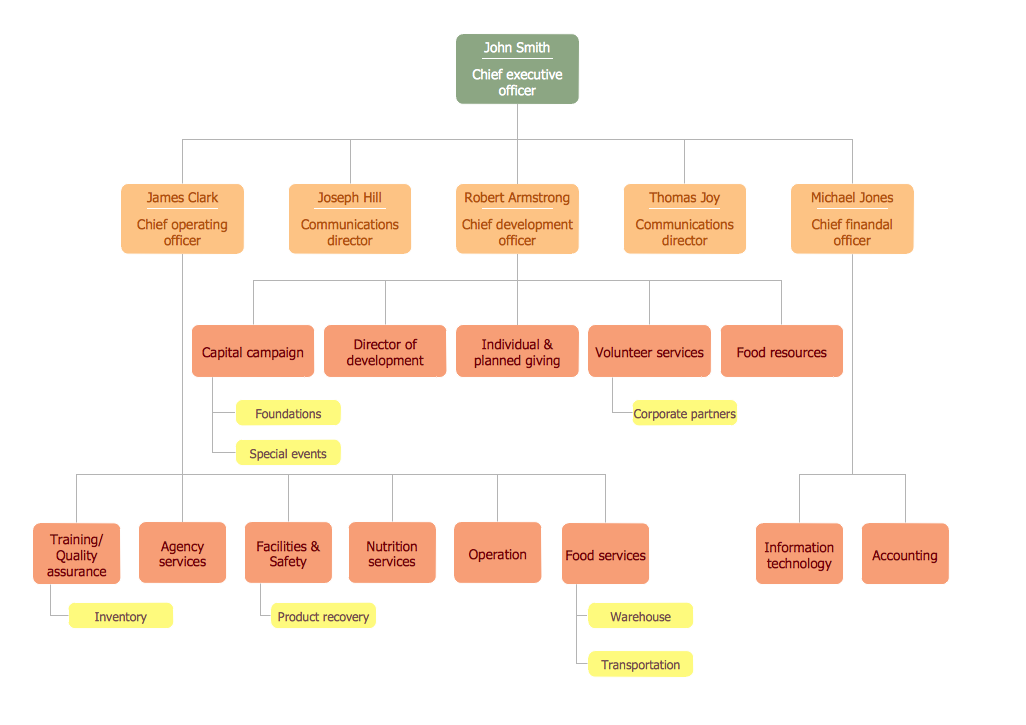
Picture: Organigrams with ConceptDraw DIAGRAM
Related Solution:

