Example 1. Marketing Organization Chart in ConceptDraw DIAGRAM /p>
Marketing Diagrams Solution is rich for the predesigned samples and templates which are available from ConceptDraw STORE. Templates are very useful and convenient tool for fast and easy drawing various marketing diagrams and marketing organization chart.

Example 2. Marketing Diagrams Solution in ConceptDraw STORE
It is the excellent news that Marketing Diagrams Solution for ConceptDraw Solution Park contains also the Marketing Diagrams library with numerous vector objects which will afford you the real help in self-dependent drawing Marketing Organization Chart and other types of marketing diagrams.
If you need, you can also use the predesigned objects from the Organizational Chart library from the Organizational Charts Solution of the Management Area.
.png "Marketing Organization Chart")
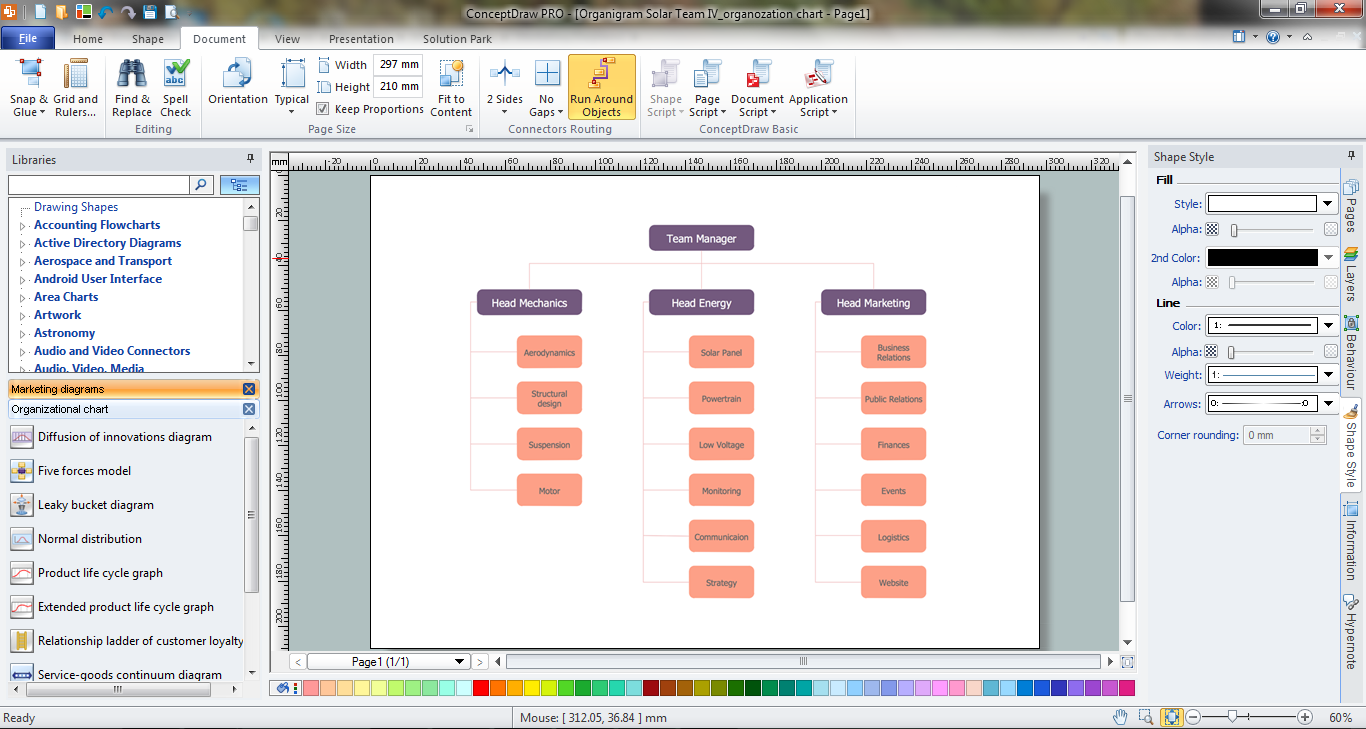
Example 3. Marketing Organization Chart
This Marketing Organization Chart was created in ConceptDraw DIAGRAM software with help of tools of Marketing Diagrams Solution for ConceptDraw DIAGRAM Solution Park. An experienced user spent 5 minutes creating this sample.
Use the powerful tools of Marketing Diagrams Solution for ConceptDraw DIAGRAM software to create your own professional looking Marketing Organization Chart quick, easy and effective, and then successfully use it in your work or education activity. You need only a few minutes to get the excellent result in ConceptDraw DIAGRAM thanks to the Marketing Diagrams Solution!
All source documents are vector graphic documents. They are available for reviewing, modifying, or converting to a variety of formats (PDF file, MS PowerPoint, MS Visio, and many other graphic formats) from the ConceptDraw STORE. The Marketing Diagrams Solution is available for all ConceptDraw DIAGRAM or later users.
NINE RELATED HOW TO's:
ConceptDraw DIAGRAM is a Mac OS X and Windows platforms professional software to draw your own business process diagrams and flowcharts.
Picture: Professional Diagram and Flowchart Software
Timeline is a type of diagram which illustrates the series of events in a chronological order on a linear timescale. How to make a timeline? It is convenient to use a modern powerful software. ConceptDraw DIAGRAM diagramming and vector drawing software extended with Timeline Diagrams solution from the Management area is exactly what you need.
Picture: How to Make a Timeline
Related Solution:
An organizational chart is a diagram that shows the structure of an organization and the relationships of its parts. ConceptDraw DIAGRAM extended with Organizational Charts Solution from the Management Area is powerful Organizational Chart Software.
Picture: Organizational Chart
Related Solution:
Use the advantages of hierarchical tree structure of mind map while developing the organizational structure of your organization. Create an Organizational Chart from your map. Double click the icon to create an Organizational Chart.
The diagram is created automatically from the active page of your map by ConceptDraw DIAGRAM and will be opened in Slideshow mode.
Picture: Organizational Chart
Related Solution:
An organizational structure defines how activities such as task allocation, coordination and supervision are directed towards the achievement of organizational aims. It is convenient to use a powerful software for developing and representing the organizational structures. ConceptDraw DIAGRAM diagramming and vector drawing software extended with Organizational Charts Solution from the Management Area is ideal for achievement this goal.
Picture: Organizational Structures
Related Solution:
Mind map that organizes tasks, resources, outcomes and people for a marketing research project.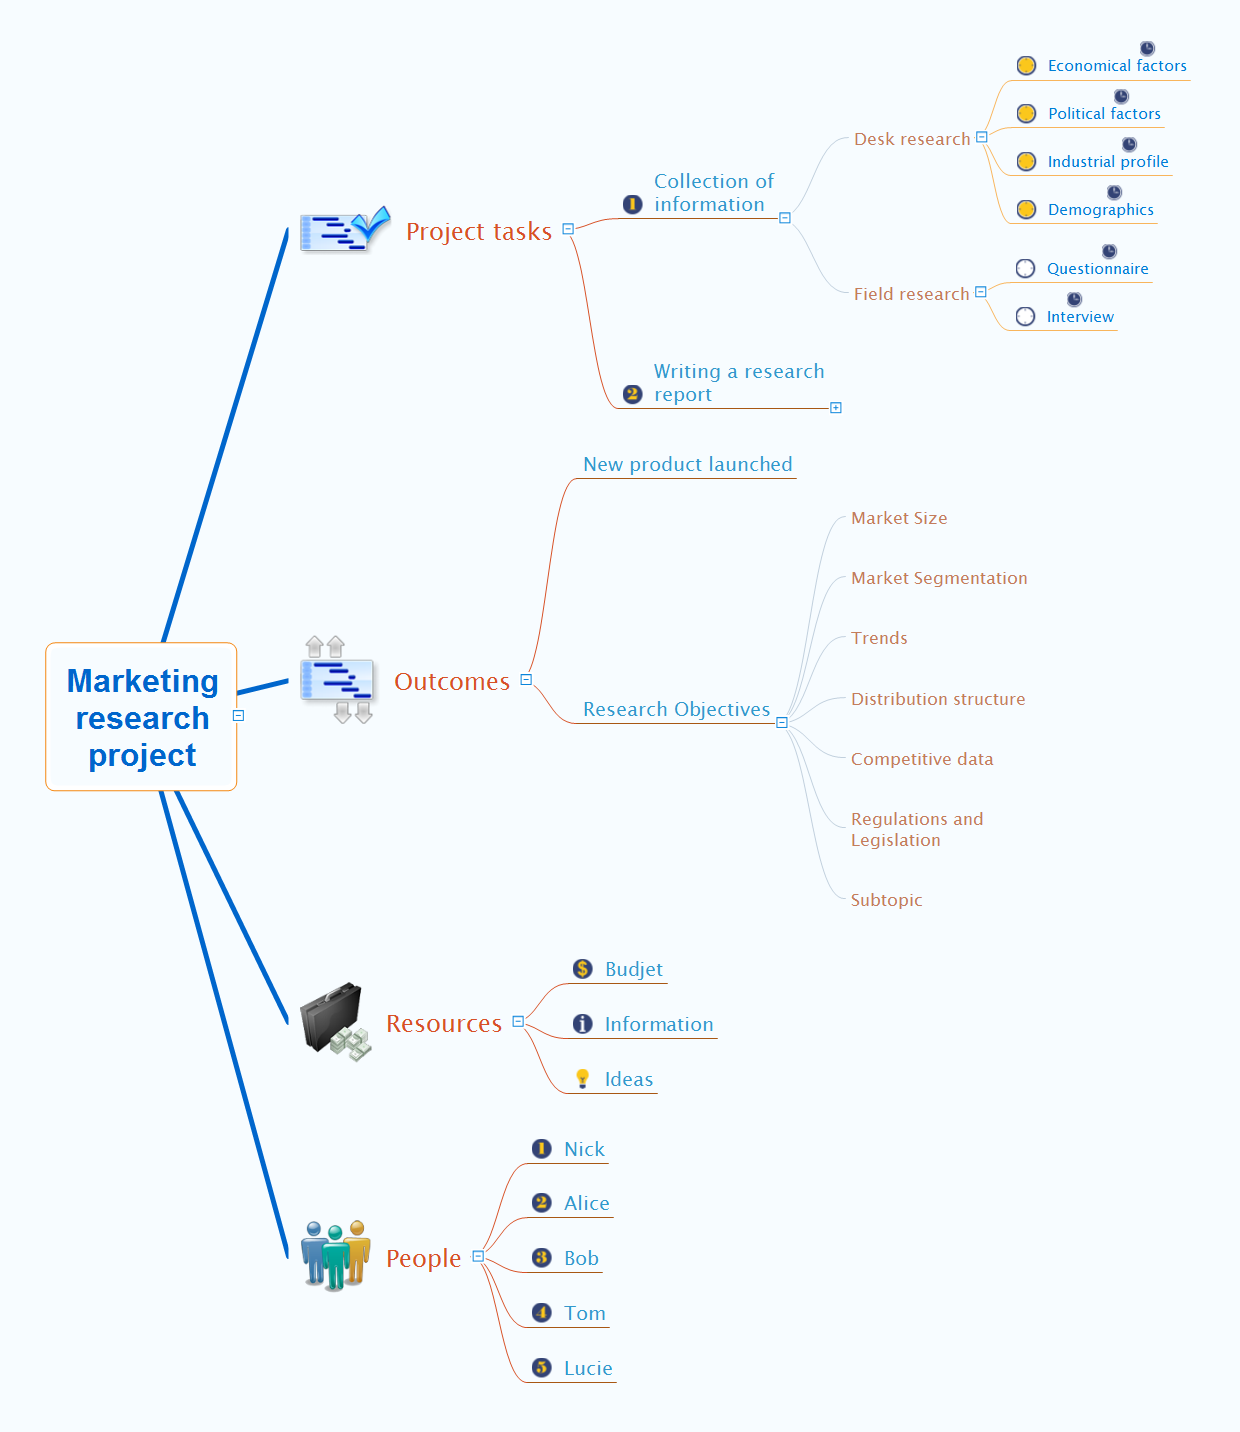
Picture: Marketing Research Project
Related Solution:
Gant Chart is a graphical representation of tasks as segments on a time scale. It helps plan and monitor project development or resource allocation. The horizontal axis is a time scale, expressed either in absolute or relative time.
Picture: Gant Chart in Project Management
Related Solution:
The question how to create a column chart have a simple answer. Use ConceptDraw tips to find out how to create a column chart depicts your data the best way.
Picture: How to Create a Column Chart
Related Solution:
This sample was created in ConceptDraw DIAGRAM diagramming and vector drawing software using the Pie Charts Solution from Graphs and Charts area of ConceptDraw Solution Park.
This sample shows the Pie Chart of the approximate air composition. You can see the percentage of oxygen, nitrogen and other gases in the air visualized on this Pie Chart.
Picture: Percentage Pie Chart. Pie Chart Examples
Related Solution:

.png "Marketing Organization Chart")