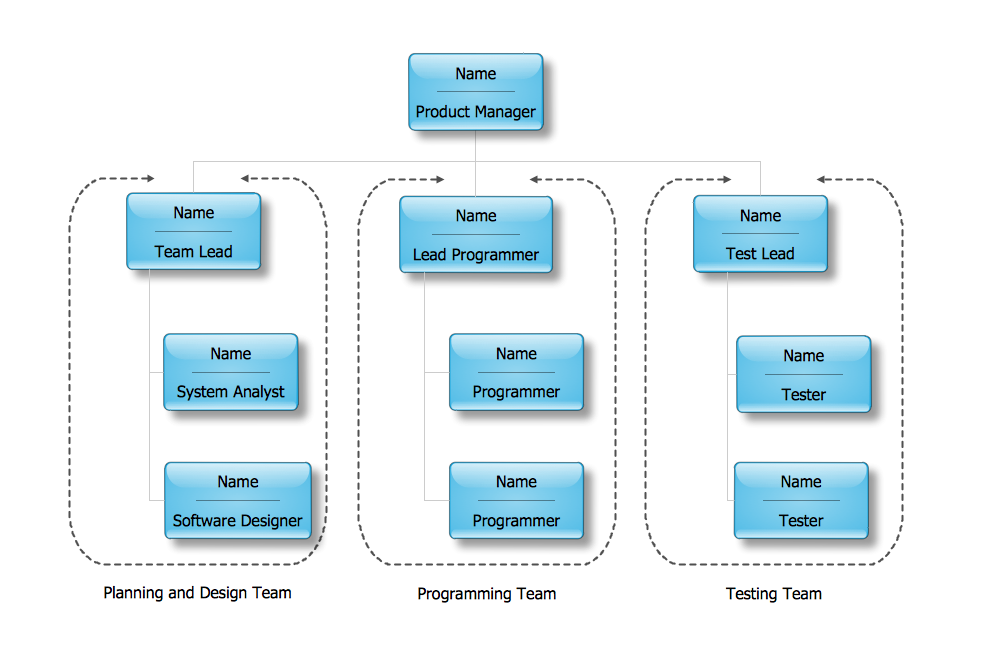
Pic. 1. Organizational Chart Template
This template was designed specially for you in ConceptDraw DIAGRAM diagramming and vector drawing software using the Organizational Chart Library from the Organizational Charts Solution. You can choose it from ConceptDraw STORE and then change for your needs.

Pic. 2. Organizational Chart
This organizational chart was created on the base of Organizational Chart Template from the Organizational Charts solution. How is it easy create so complex Organizational Charts using the predesigned templates!
The Organizational Charts designed with ConceptDraw DIAGRAM are vector graphic documents and are available for reviewing, modifying, converting to a variety of formats (image, HTML, PDF file, MS PowerPoint Presentation, Adobe Flash or MS Visio), printing and send via e-mail in one moment.
TEN RELATED HOW TO's:
Different organizations have different organizational structures. Matrix organization is one of the most popular and widely used type of organizational structure. Use ConceptDraw DIAGRAM diagramming and vector drawing software extended with 25 Typical Orgcharts solution from the Management area of ConceptDraw Solution Park for fast and easy designing matrix organizational chart for your company.
Picture: Matrix Organization
Related Solution:
If your company is in chaos in clutter and no one understands their rights and responsibilities, maybe it's time to change that. One of the ways to put the company in order is to draw an organization chart that would reflect the structure and show the relationships among departments and positions. This is a very useful and easy to understand scheme.
This is example of the one of the most typical kind of organizational chart. It depicts an organizational structure of the hierarchical type. Its construction is similarv to pyramid. The single main position on the top - in this case, the mayor's position followed by sub-levels of authority in his command. Each position in the pyramid reports only to his supervisor, and takes only a report of direct subordinates. Such scheme limits the number of communications. This organizational structure is effectively used in public organizations. Also it is suitable for any organization with the need for multiple levels of middle managers. The ability to create organizational charts of different types is supplied with ConceptDraw Ogrcharts solutions.
Picture: How to Draw an Organizational Chart
Related Solution:
To your mind, deliberation about the profits of creating organizational charts takes more time than actually creating itself. If lack of software is the only thing that stops you, you should know that organizational charts with ConceptDraw DIAGRAM are created within a few minutes. Owing to the great number of ready-to-use templates, you’ll get your chart easily.
Chart is a very handy format for visually depicting official relations of an organization. Usually, an Orgchart (organizational chart) consists from simple geometrical shapes, containing an information on a position, personal data, and the lines that means responsibilities and accountabilities associated with position. ConceptDraw solution designed for making organizational charts enables one to create various org charts effortlessly using special templates and vector libraries.
Picture: Organizational Charts with ConceptDraw DIAGRAM
Related Solution:
Understanding the connections between an organization department might take some time. If you are a newcomer to a company, an orgchart would help you if don’t know who to call when questions appear. This scheme usually is printed on one of the walls in the office.
This template of orgchart is supplied with the ConceptDraw add-on containing solutions for making organizational charts. You can use it to depict an organizational structure of your company. The only you need is - open this template and alter it to cover an organizational features of your business. It is easy to rearrange the orgchart structure by dragging the elements by mouse. Finally fill the template with particular positions of your company's staffing table.
Picture: Orgchart
Related Solution:
Visio Files and ConceptDraw. ConceptDraw DIAGRAM is compatible with MS Visio.VDX formatted files.VDX is Visio’s open XML file format, and it can be easily imported and exported by ConceptDraw DIAGRAM.
Picture: Visio Files and ConceptDraw
Our DFD software ConceptDraw DIAGRAM allows you to quickly create DFD with data storages, external entities, functional transforms, data flows, as well as control transforms and signals. DFD program ConceptDraw DIAGRAM has hundreds of templates, and a wide range of libraries with all nesassary ready-made drag-and-drop.
Picture: ConceptDraw DIAGRAM DFD Software
There are numerous articles about the advantages of flowcharting, creating business graphics and developing different charts. Nevertheless, these articles are almost useless without the main component - the examples of flowcharts, org charts and without a fine example, it is difficult to get all the conveniences of creating diagrams. You can find tons of templates and vivid examples on Solution Park.
This illustration shows a variety of business diagrams that can be created using ConceptDraw DIAGRAM. It comprises a different fields of business activities: management, marketing, networking, software and database development along with design of infographics and business illustrations. ConceptDraw DIAGRAM provides a huge set of sample drawings including business process modeling diagrams,, network diagrams, UML diagrams, orgcharts, DFD, flowcharts, ERD, geographical maps and more.
Picture: Examples of Flowcharts, Org Charts and More
Related Solution:
Starting producing workflow diagram from template you save time and avoid the blank page syndrome. At first, the workflow template is set of rules for a workflow. The workflow symbols used in the specific case are part of workflow template. This is the subset of large standard collections of workflow symbols. The first part of workflow template is identification of symbols allowed in use in your specific case. The best way would be to collect them in your customized drawing collection of workflow symbols which used in your specific cases of workflow diagrams. Another way to create business process documents is using business process flow diagram which have similar purposes and have different visual notation.
ConceptDraw DIAGRAM is professional workflow diagram software with the rich extentions from ConceptDraw Solution Park. The basic solution for workflow diagramming is Workflow Diagrams Solution. It delivers a rich set of workflow diagram templates and samples help you draw diagrams e
Picture: Workflow Diagram Template
Related Solution:
ConceptDraw DIAGRAM diagramming and vector drawing software offers the unique Business Process Mapping Solution from the Business Processes Area of ConceptDraw Solution Park. Powerful drawing tools of this solution make it effective Business Process Mapping software and help easy design professional looking business process diagrams and flowcharts.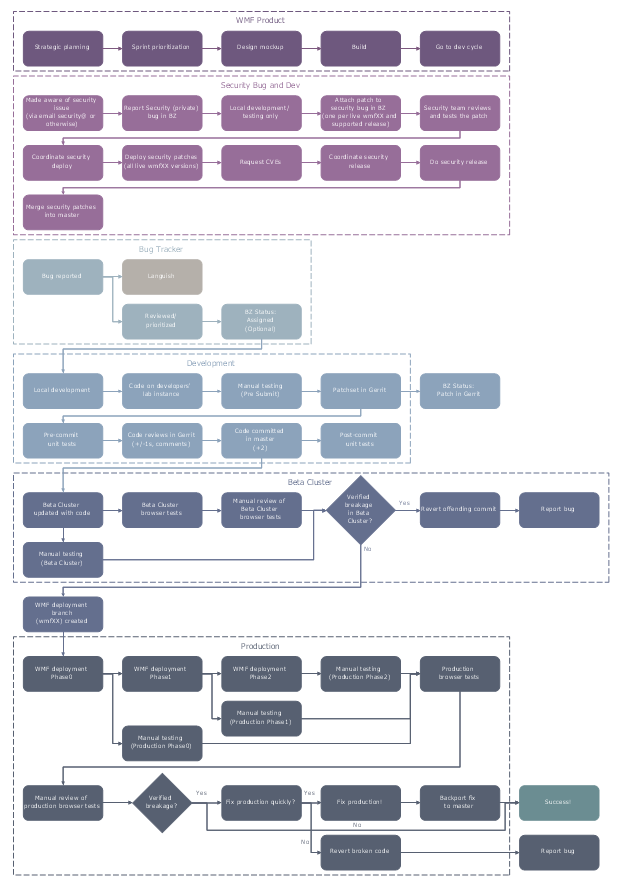
Picture: Process Mapping
Related Solution:
Compare flowchart software by type, features, and workflow fit. Learn the difference between desktop and online tools and choose the right solution for documentation or collaboration.
Picture: Flowchart Software: Tools for Process and Workflow Diagramming
Related Solution: