Organizational Structure Types
An organizational structure is known to be used for defining the way the activities (usually – the business activities, if it is used for representing some business structure) are used to be directed toward the achievement of some particular aims and goals within some organization/company. The mentioned activities can be supervision the workers, coordination of their work, tasks allocations, etc. It is very well known that any organization has to be efficient as well as innovative in order to succeed and so to win the race with its competitors on the same market. Every single company has to be also flexible and caring to be able to achieve a sustainable competitive advantage.
Each organizational structure of each organization can be considered as the perspective through which different individuals can see the organization they work for as well as the environment it is in. Thus, an organization can be structured in many different ways, which all depends on the objectives of this organization in particular. The structure of any organization can be determined with use of the modes in which it performs and operates, allowing the expressed allocation of its responsibilities for different processes and functions. The entities mentioned within one organizational structure can differ, being departments, branches, workgroups as well as individual, who are usually simply workers.
The affect any organizational action of any organizational structure can be performed is known to be classified in two ways, which is, basically simply determining all the individuals who manage to participate in all decision-making processes and providing the foundation for the standard operating routines as well as the procedures rest.
There are many types of such organizational structures, which can be pre-bureaucratic ones, bureaucratic, post- bureaucratic and many more other ones. Mentioning the first, pre-bureaucratic structures, it is important to take into consideration that they also can be known as “entrepreneurial” ones. Such structures lack the so called “standardization” of all given tasks, which is very common for the small organizations, being used for solving only simple tasks. This type of structure is known to be “totally centralized”, which means that the strategic leader makes all key decisions, having most communication done in a “one on one” format conversations. It may look quite old-fashioned, but such type of organizational structures still takes place, being useful for new business (also called “entrepreneurial” one), enabling its founder to control both development and growth of his business in this way.
The so called “bureaucratic mechanism” structures have only some degree of standardization, but they are still not fully standardized, being better suited for more complex organizations, larger than the smallest ones, adopting a so called “tall structure”. The well-known characteristics of bureaucracy are known to have clear defined responsibilities and so roles, responsible for such tasks, a hierarchical structure and a so called “respect for merit”.
The mentioned bureaucratic structures have quite many levels of management starting from senior executives up to regional managers, and later to department store managers, having the decision-making authority passing through more layers than smaller organizations. Having more tight procedures, constraints and policies, any bureaucratic organization is known to be reluctant to change or adapt what has been used since the date the company started.
Every time you need to create an organizational chart means you need to mention every single department in your company to make it simpler to understands who in particular is in charge for every situation within this organization and what exactly the workers’ responsibilities are. All decisions can be made through an organized process, having a strict command as well as control structure present all the time.
In the so called “bureaucratic structures”, mentioned above, their authorities are at the very top of the organizational structure and all the information about this organization is represented in a way from top to bottom. The advantages for such “bureaucratic structure” for managers can be that they basically get control over all organizational structure decisions. The strategic decision-makers prefer such structure, having no need to go through too many people to approve their propositions. The disadvantages in the bureaucratic structures can be discouraging all the creativity as well as innovation within the organization and so making it hard for a company to adapt in the marketplace considering its changing conditions.
There’s also a term of “functional organizational structure”, which is basically a structure consisted of activities, that are known to be ‘supervision’, ‘coordination’ and ‘task allocation’. Determining the way how the organization operates (performs), the organizational structure refers to the way how exactly the people in an organization are grouped, mentioning who to they actually report about completing their tasks. A few common functions within functional organizational structure of organization can include marketing, production, accounting and human resources. This structure can be best suited for a company-producer of standardized goods (or/and services) at both low cost and large volume. Specialization (as well as coordination) of all tasks is always centralized in such functional structure, making producing products (or services) both predictable as well as efficient.
There are many more types of organizational structures, besides the mentioned, you can create using ConceptDraw DIAGRAM software getting the right solution from ConcepDraw STORE — application, developed in order to simplify ConceptDraw DIAGRAM users’ work with drawing any needed schematics, including the organizational structures.
Each organization is set up in a specific way to accomplish some goal, these goals are different for various organizations, so their structures will be also different. There is a direct relationship between organization's structure and achievement progress in organization's development.
There are three main types of organizational structures which can be adopted by organizations depending on their objectives:
- functional structure,
- divisional structure,
- matrix structure.

Example 1. Organizational Structure Types - DOE Org Chart
25 Typical Orgcharts Solution offers diversity of templates for depicting charts of various organizational structure types. These are 25 templates available for filling from ConceptDraw STORE.

Example 2. Matrix Organizational Structure - Template
Another way of drawing organizational chart in ConceptDraw DIAGRAM software is to start with one of 10 predesigned orgchart samples also included in 25 Typical Orgcharts solution.

Example 3. 25 Typical Orgcharts Solution in ConceptDraw STORE
Apply also collection of ready-to-use vector objects offered in 2 libraries specially developed for 25 Typical Orgcharts solution: Organizational Chart library, Organizational Chart (people) library.

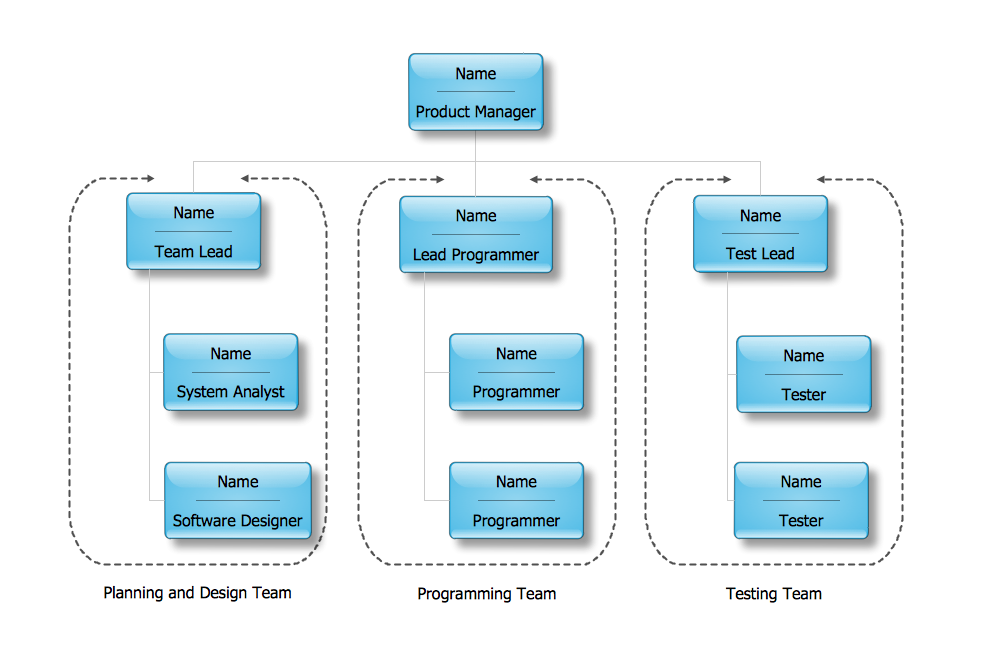
Example 4. Functional Organizational Structure - Software Company
The samples you see on this page were created in ConceptDraw DIAGRAM software on the base of predesigned templates from 25 Typical Orgcharts Solution for ConceptDraw DIAGRAM Solution Park. An experienced user spent 10 minutes creating each of them.
Use the 25 Typical Orgcharts Solution for ConceptDraw DIAGRAM software to create your own professional looking Organization Charts of different organizational structure types quick, easy and effective.
All source documents are vector graphic documents. They are available for reviewing, modifying, or converting to a variety of formats (PDF file, MS PowerPoint, MS Visio, and many other graphic formats) from the ConceptDraw STORE. The 25 Typical Orgcharts Solution is available for all ConceptDraw DIAGRAM users.