
Example 1. Sales Process Management - Hotel Reservation System
It is impossible to imagine the sales process management without different informative graphics, maps, diagrams. They are convenient for representing and analyzing the sales process, the sales results, and for making management decisions. If you dream to design Sales Process Maps quick and easy, the Sales Flowcharts Solution for ConceptDraw DIAGRAM software is exactly what you need.

Example 2. Sales Flowcharts Solution in ConceptDraw STORE
You can easy design your Sales Process Map or Flowchart in the new document using the predesigned vector shapes from the 6 libraries of the Sales Flowcharts Solution, or use already ready samples as the base or as the source of inspiration.

Example 3. Sales Process Management - Global Payment Solutions
The samples you see on this page were created in ConceptDraw DIAGRAM using the Sales Flowcharts Solution for ConceptDraw DIAGRAM They are the good examples of effective applying the ConceptDraw DIAGRAM software for the sales process management. An experienced user spent 10-15 minutes creating each of these samples.
Use the Sales Flowcharts Solution for ConceptDraw DIAGRAM software to create your own Sales Flowcharts of any complexity quick, easy and effective.
All source documents are vector graphic documents. They are available for reviewing, modifying, or converting to a variety of formats (PDF file, MS PowerPoint, MS Visio, and many other graphic formats) from the ConceptDraw STORE. The Sales Flowcharts Solution is available for all ConceptDraw DIAGRAM
TEN RELATED HOW TO's:
It’s very simple and quick to create the UML Diagrams using the Rapid UML Solution for ConceptDraw DIAGRAM. This sample was created in 10 minutes.
This sample describes the credit card processing system. It’s a UML Class Diagram with generalization sets. This sample can be used by the banks, business and financial companies, exchanges.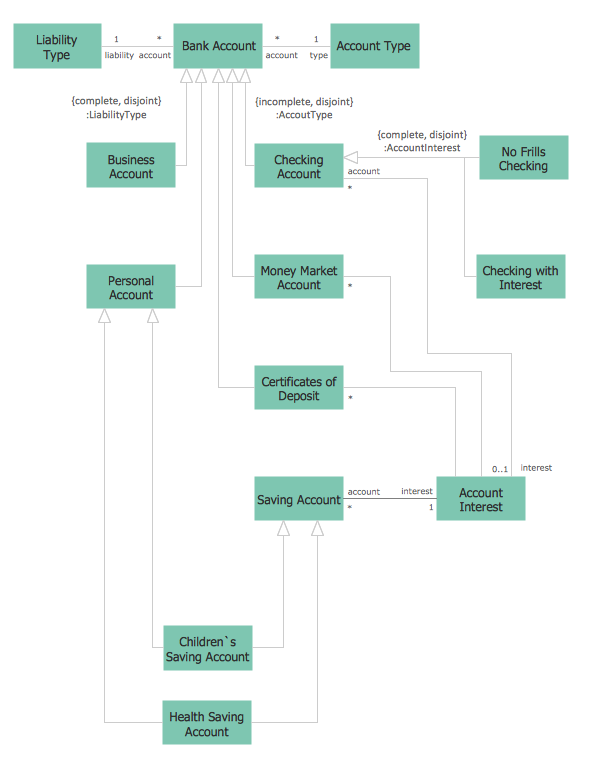
Picture: UML in 10 mins
Related Solution:
To support you in your tasks you can use the power of ConceptDraw DIAGRAM providing intelligent vector graphics that are useful for Business Process diagramming and ConceptDraw MINDMAP for key Business Process mind maps.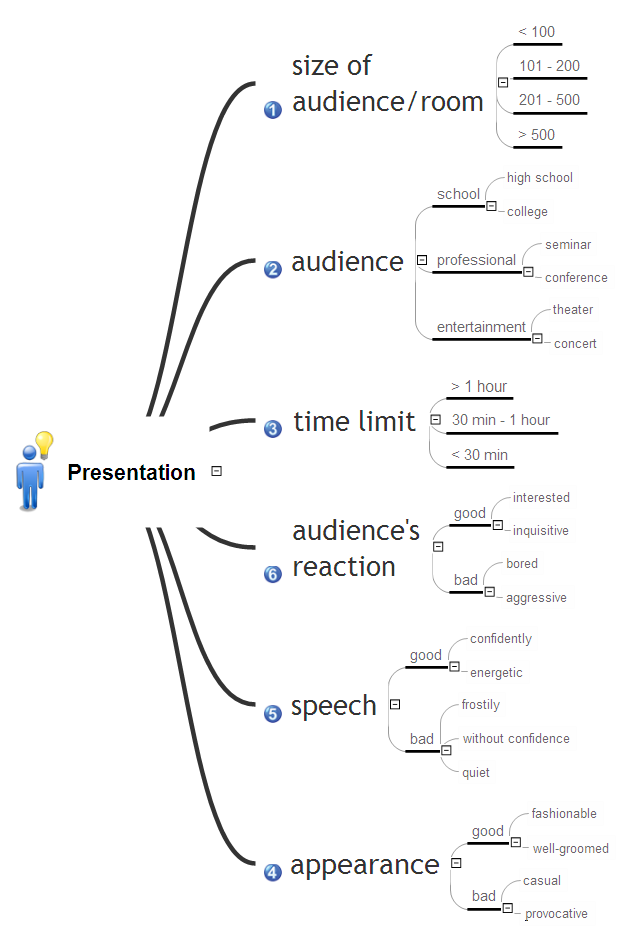
Picture: Business Process
Related Solution:
ConceptDraw DIAGRAM charting and vector drawing software offers the Circle Spoke Diagram Template included to the Business Diagrams Solution from the Management Area. The use of ready template is the easiest way of drawing professional-looking Circle-Spoke Diagrams.
Picture: Circle Spoke Diagram Template
Related Solution:
How to build segregation of duties using drawing tools from Accounting Flowcharts Solution for ConceptDraw DIAGRAM software.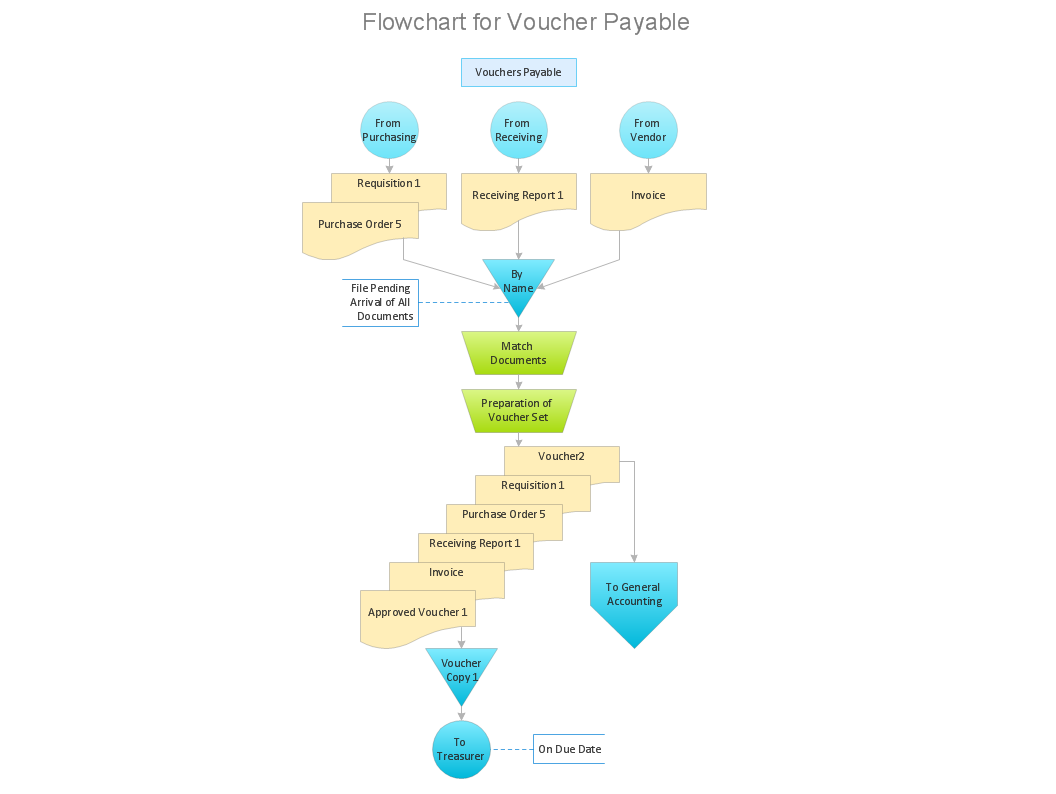
Picture: Approval Process and Segregation of ResponsibilitiesAccounting Flowchart Example
Related Solution:
When you need a drawing software to create a professional looking cross-functional charts, ConceptDraw with its Arrows10 Technology - is more than enough versatility to draw any type of diagram with any degree of complexity.
Use templates with process maps, diagrams, charts to get the drawing in minutes.
Picture: Cross-Functional Process Map Template
The vector stencils library Yourdon and Coad Notation from the solution OOAD contains specific symbols of the Yourdon and Coad notation such as data store symbol, data process symbol, loop symbol for ConceptDraw DIAGRAM software.
Picture: Yourdon and Coad Diagram
Draw your own business process flowcharts using ConceptDraw DIAGRAM diagramming and business graphics software.
The Flowcharts Solution for ConceptDraw DIAGRAM is a comprehensive set of examples and samples in several different color themes for professionals that need to graphically represent a process.
Picture: Flow Chart Diagram Examples
Related Solution:
How do Fishbone diagrams solve manufacturing problems? Fishbone diagrams are successfully used in various fields of industries and manufacturing to analyze the set of possible causes and their effects. Fishbone diagram provides a process to clearly define the “Effect” and then puts you to thinking about the possible causes, based on the categories of common problems in manufacturing.
ConceptDraw DIAGRAM application extended with Fishbone Diagrams solution lets you construct Fishbone diagrams and represent globally recognized standards for manufacturing 6 Ms and 8 Ms.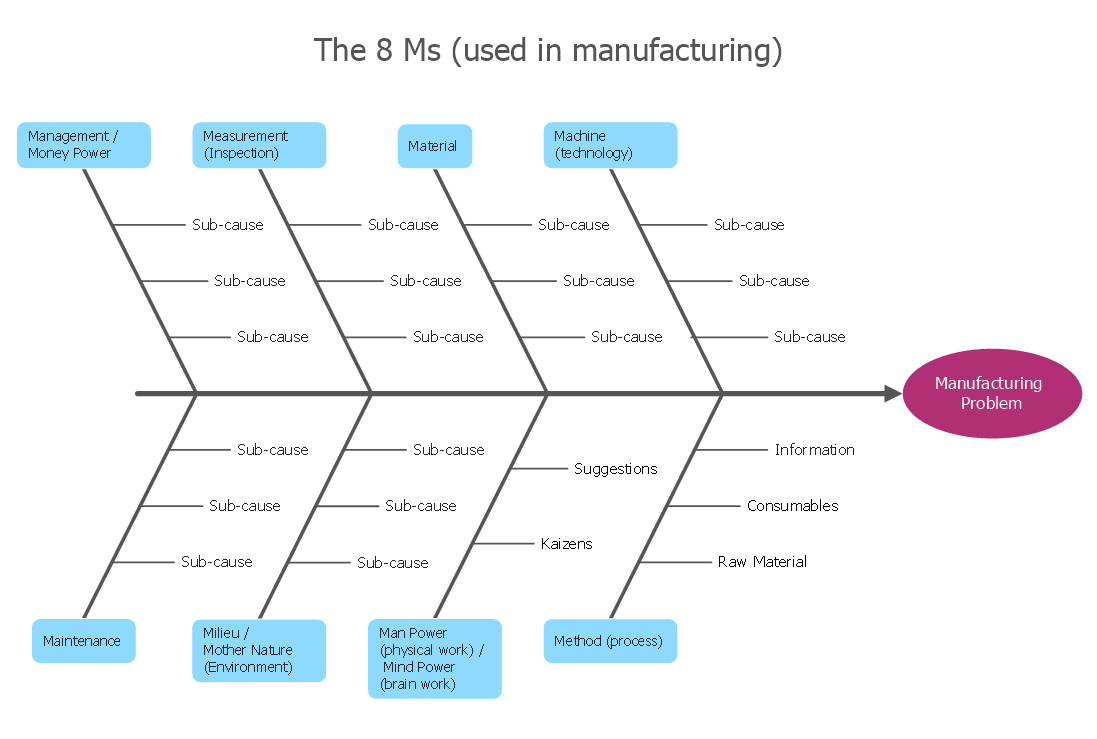
Picture: How Do Fishbone Diagrams Solve Manufacturing Problems
Related Solution:
Create your own Linux audit flowcharts using the ConceptDraw DIAGRAM diagramming and vector drawing software extended with the Audit Flowcharts solution from the Finance and Accounting area of ConceptDraw Solution Park.
This flowchart example describing auditd, the linux audit tool.
Picture: Linux Audit Flowchart Example. Flowchart Examples
Related Solution:
ConceptDraw Network Drawing Software - Network design software for network drawings with abundant examples and templates.
Create computer network designs, diagrams and schematics using ConceptDraw.
Picture: Network Drawing Software

