HR Management Software
Human resources is the term given to the people who make up the employee workforce of an organization or company. It was initially used simply as a synonym for manpower or labour; latterly, with the advent of globalization, a cottage industry has grown regarding human resource strategy, as a way of enhancing business value through management of the workforce.
The idea of human resource management (HRM, or HR) has its roots in the human relations movement of the early 20th century. Initially, the theory was applied more towards transactional processes, such as the administration of payments, holidays and benefits. Soon the focus would turn directly to the labor force, and the idea of workplace productivity began to take importance. A gradual change in HR policy meant that workers began to be view less as cogs in a machine, subject to unrealistic production demands, and more like an asset to the company, who can be trained and rewarded in order to provide even greater productivity in their work.
Human resource management (HRM, or simply HR) is a function in organizations designed to maximize employee performance in service of an employer's strategic objectives. HR is primarily concerned with the management of people within organizations, focusing on policies and on systems. HRM covers the following core areas:
- job design and analysis,
- workforce planning,
- recruitment and selection,
- training and development,
- performance management,
- compensation (remuneration),
- legal issues.
Human resource management (HRM) is a professional discipline which oversees and manages an organization's human resources, and aspires maximize employee performance for an employer's strategic objectives.
ConceptDraw DIAGRAM diagramming and vector drawing software extended with HR Flowcharts Solution from the Management Area of ConceptDraw Solution Park is a powerful HR Management Software.

Example 1. HR Management Software
HR Flowcharts Solution is a numerous set of useful drawing tools for HR Management. It includes variety of HR Flowchart samples and incredibly large collection of vector object libraries:
- HR Arrows library
- HR Department library
- HR Flowchart library
- HR Professions library
- HR Steps library
- HR Symbols library
- HR Workflow library

Example 2. HR Flowchart Library Design Elements
Thanks to the predesigned objects from these libraries you can easy design any HR Flowchart. Follow the next steps for this:
- drag the required shapes from the libraries,
- arrange the shapes and connect them with arrows,
- type the text.

Example 3. HR Flowcharts Solution in ConceptDraw STORE
The following features make ConceptDraw DIAGRAM the best HR Management Software:
- You don't need to be an artist to draw professional looking diagrams in a few minutes.
- Large quantity of ready-to-use vector objects makes your drawing diagrams quick and easy.
- Great number of predesigned templates and samples give you the good start for your own diagrams.
- ConceptDraw DIAGRAM provides you the possibility to use the grid, rules and guides. You can easily rotate, group, align, arrange the objects, use different fonts and colors to make your diagram exceptionally looking.
- All ConceptDraw DIAGRAM documents are vector graphic files and are available for reviewing, modifying, and converting to a variety of formats: image, HTML, PDF file, MS PowerPoint Presentation, Adobe Flash, MS Visio.
- Using ConceptDraw STORE you can navigate through ConceptDraw Solution Park, managing downloads and updates. You can access libraries, templates and samples directly from the ConceptDraw STORE.
- If you have any questions, our free of charge support is always ready to come to your aid.
NINE RELATED HOW TO's:
Take a look on an example of Cross-Functional-Flowchart, showing the software service cross-function process flowcharts among the different departments. It presents a simple flowchart among the customer, sales, technical support, tester and development.
Try now Flowchart Software and Cross-Functional library with 2 libraries and 45 vector shapes of the Cross-Functional Flowcharts solution. Then you can use built-in templates to create and present your software service cross-function process flowcharts.
Picture: Cross Functional Flowchart Examples
Event-Driven Process chain Diagrams for improvement throughout an organisation. Best software for Process Flow Diagram. The Event-driven Process Chain (EPC) Diagrams allows managers to plan processes and resources.
Picture: Business process Flow Chart — Event-Driven Process chain (EPC) diagrams
Related Solution:
This sample was created in ConceptDraw DIAGRAM diagramming and vector drawing software using the UML Class Diagram library of the Rapid UML Solution from the Software Development area of ConceptDraw Solution Park.
This sample describes the use of the classes, the generalization associations between them, the multiplicity of associations and constraints. Provided UML diagram is one of the examples set that are part of Rapid UML solution.
Picture: UML Class Diagram Generalization ExampleUML Diagrams
Related Solution:
It is very difficult to get into database model idea without any examples. To create one, you can use Chen’s notation for Entity Relationship Diagrams (ERD) and try to see all the peculiarities yourself. This notation describes entities and relations as basic geometric shapes like rectangles and diamonds.
Chen notation for Entity-relationship diagrams is used for designing relational databases. It depicts the database entities as a set of subjects. For example events, people, ideas, etc. All entities has common characteristics (attributes). Any object of the system is identified as the sole and unique. The name of entity should indicate the class or type of the the whole object, not a given example. The connection commonly represents a relationship between entities. Conceptdraw Entity-Relationship Diagrams (ERD) solution provides the libraries with ready-to-use ERD element fitting Chen's notation objects and relationships.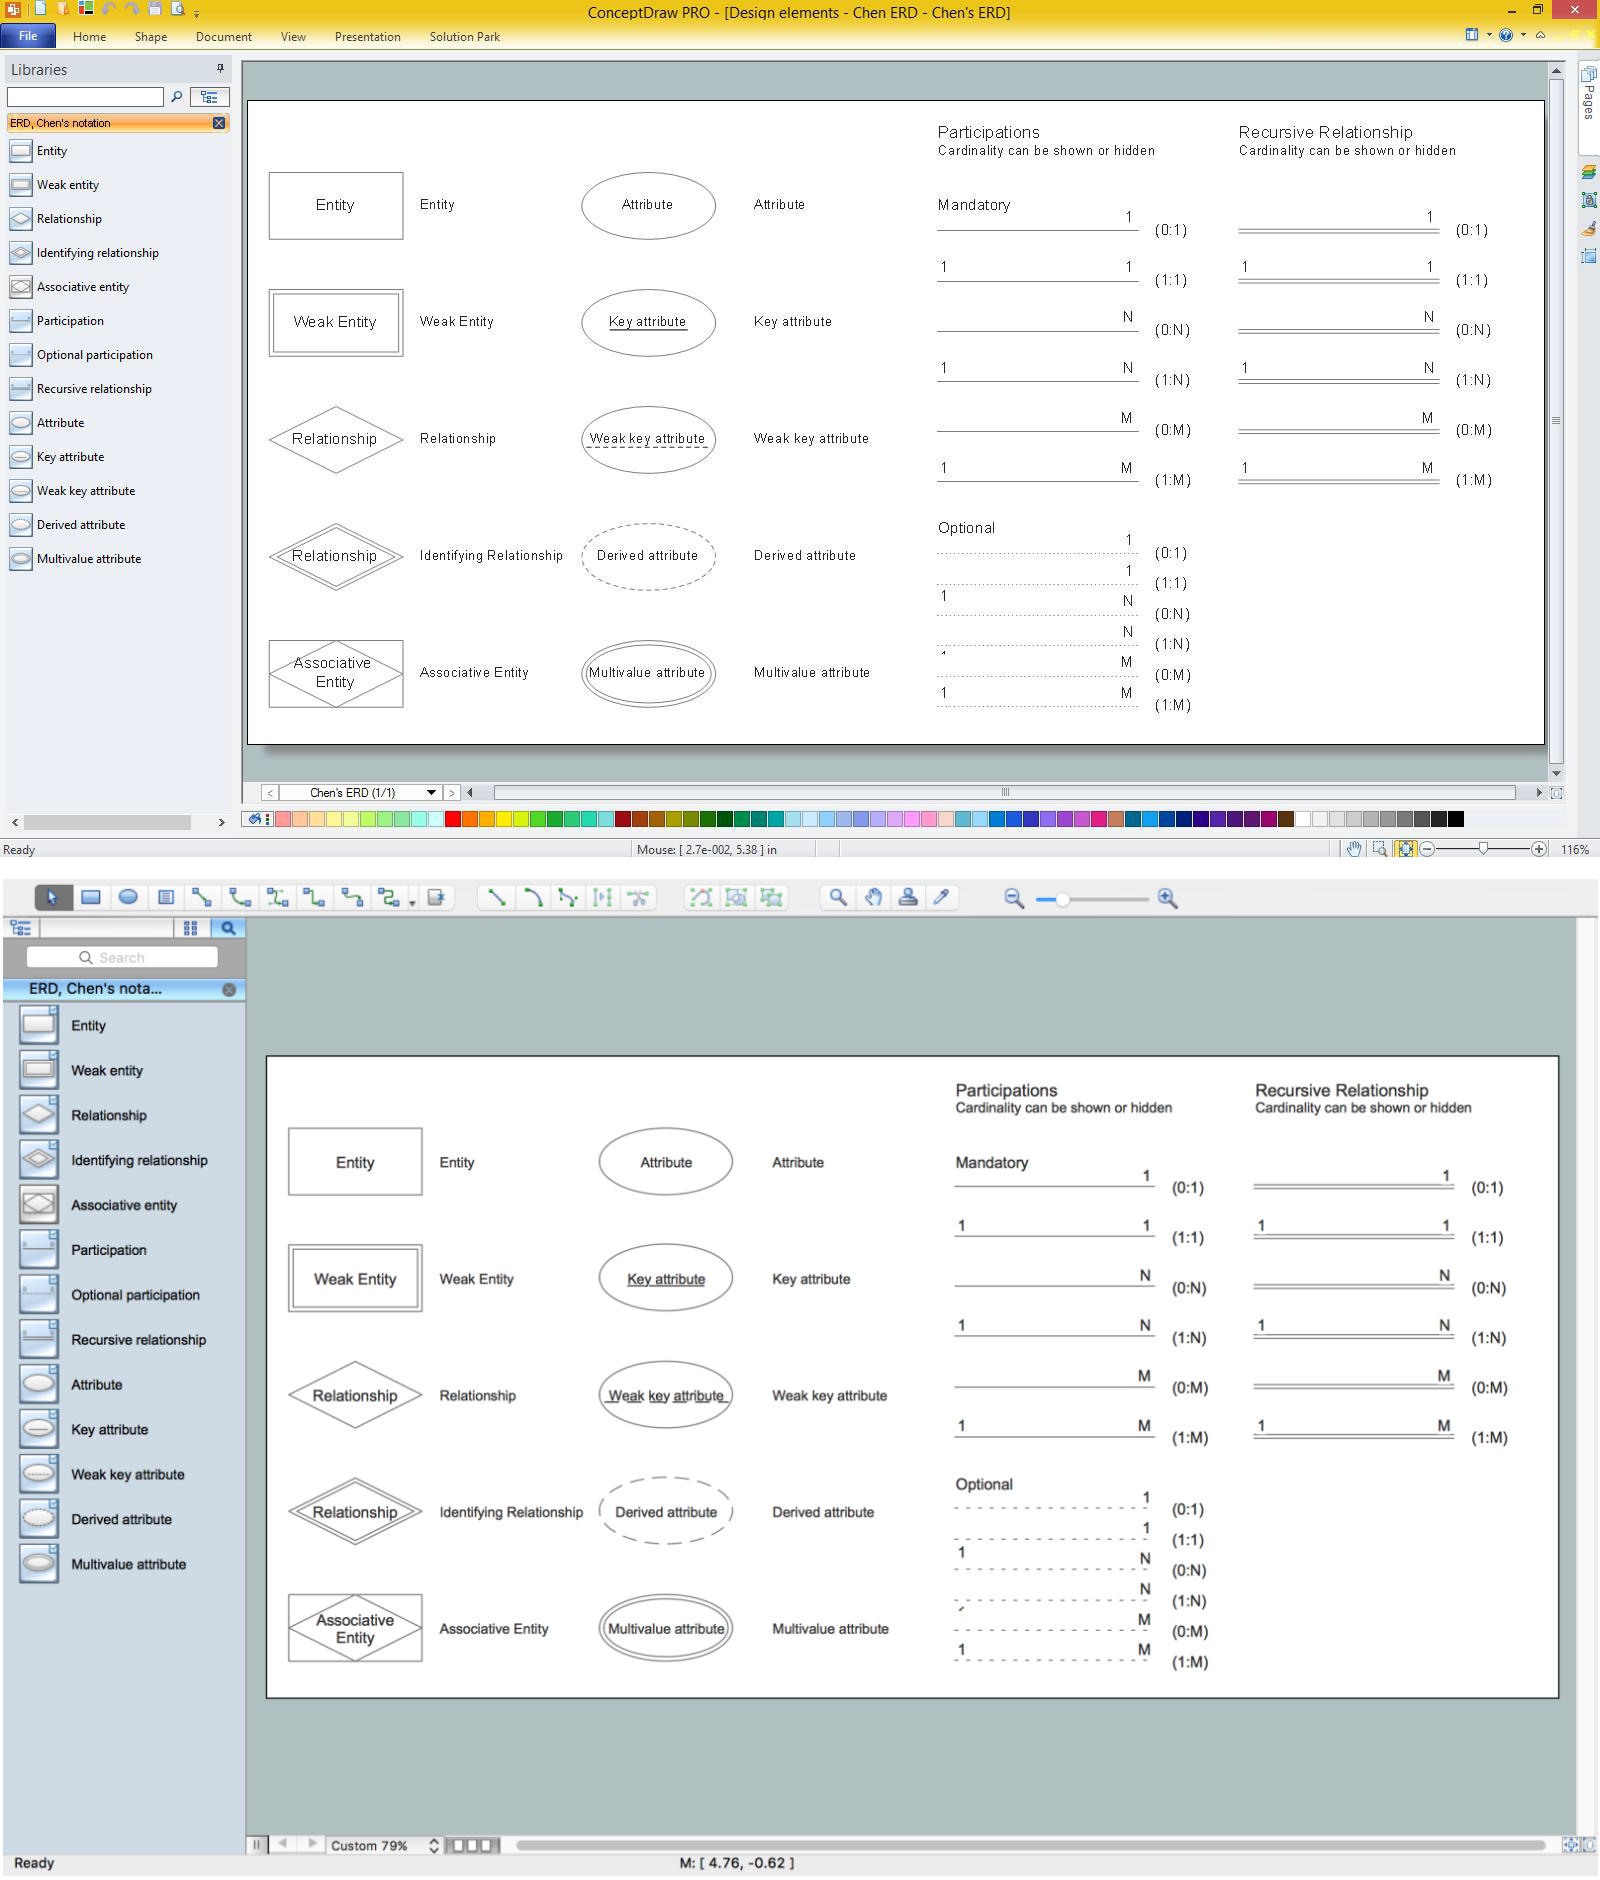
Picture: Design Element: Chen for Entity Relationship Diagram - ERD
Related Solution:
Database model is a graphic representation need at the beginning of project development. You won't have any problems with drawing ER diagrams on a Mac anymore with ConceptDraw DIAGRAM application. Special libraries that contain all the symbols of both Chen's and Crow’s foot notation allow you to start database modeling within a few minutes.
Creating entity-relationship diagrams on Mac is fun and effortless when you use a software designed for professional ERD drawing tailored to specific characteristics of Apple OS X. ConceptDraw DIAGRAM is a business diagramming software for those using OS X.
The Entity-Relationship Diagrams solution for ConceptDraw has 2 libraries containing about 50 vector icons, depicting ERD symbols of the most popular Chen's and Crow’s Foot Notations. The other valuable component of the solution is a collection of ERDs samples and templates that can be opened on Macs and PCs.
Picture: Drawing ER diagrams on a Mac
Related Solution:
Drawing baseball diagrams using ConceptDraw DIAGRAM software extended with the Baseball solution saves your time, and adds more value to your work.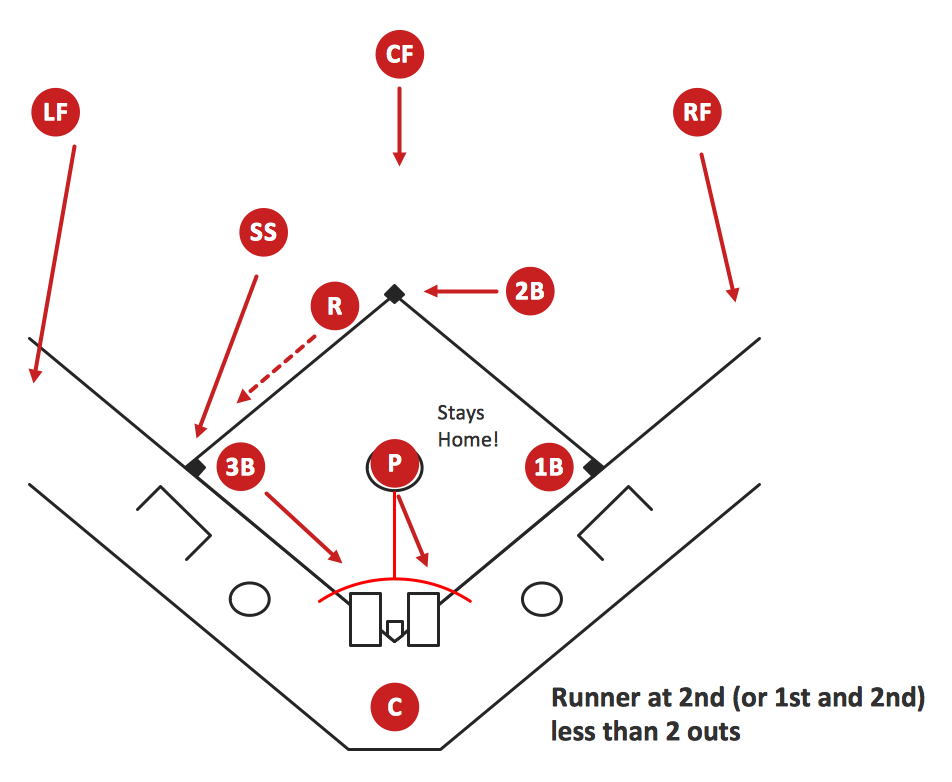
Picture:
Baseball Diagram
Basic Bunt Coverage – Runner at 2nd
Related Solution:
Interactive tool helps you find the appropriate response to social media mentions quickly.
Picture: How to Use the ″Online Store PR Campaign″ Sample
Related Solution:
ConceptDraw MINDMAP Mac OS X version enables you to export your mind map into the iCal calendar and generate tasks from mind map topics.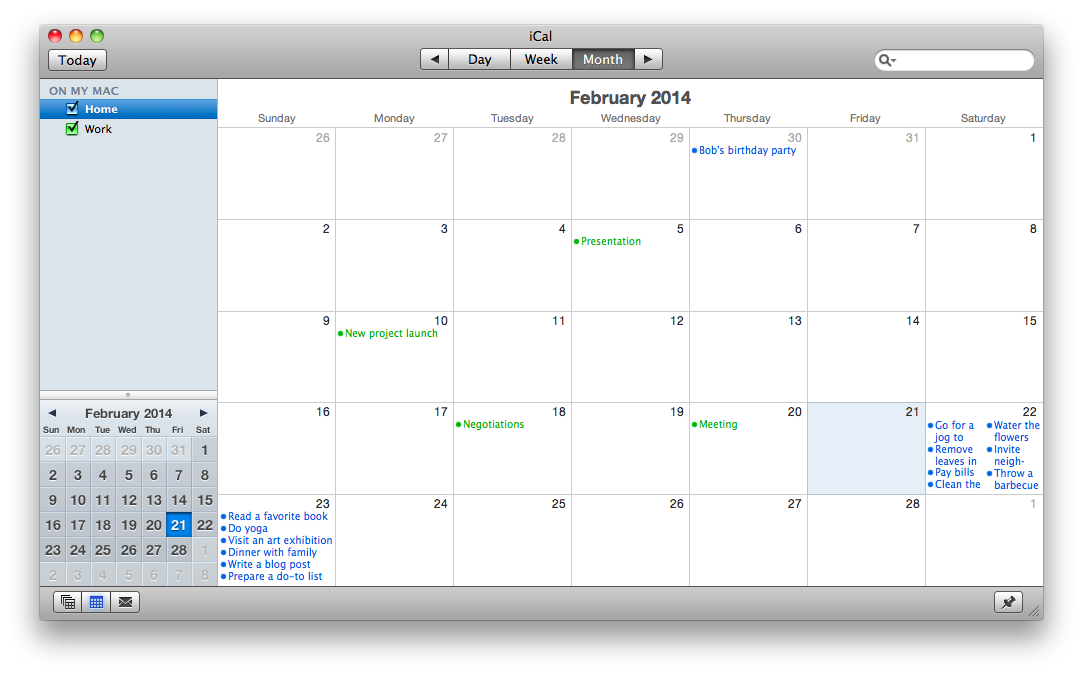
Picture: Export from ConceptDraw MINDMAP to Apple iCal
Related Solution:
Gant Chart is a graphical representation of tasks as segments on a time scale. It helps plan and monitor project development or resource allocation. The horizontal axis is a time scale, expressed either in absolute or relative time.
Picture: Gant Chart in Project Management
Related Solution:

