Electrical Symbols — IGFET
There are several types of insulated gate field-effect transistors (IGFETs) in common use.
The early term metal oxide semiconductor field-effect transistor (MOSFET) is still in
use, and MOSFET is usually acceptable as a generic term for IGFETs. The metal oxide, and the insulation in the IGFET, is the insulating material between the gate terminal and the substrate between the source and drain terminals. This insulator must have very low leakage, of course, but another requirement for good performance of the transistor is that the dielectric constant of the material must be very high.

Pic. 1. IGFET Library
ConceptDraw DIAGRAM is a powerful software for creating professional looking electrical diagram quick and easy. For this purpose you can use the Electrical Engineering solution from the "Engineering" area of ConceptDraw Solution Park.
Electrical Engineering Solution for ConceptDraw DIAGRAM provides the stencils libraries of ready-to-use predesigned 926 vector symbols, templates and samples that make your electrical drawing quick, easy and effective.
26 libraries of the Electrical Engineering Solution of ConceptDraw DIAGRAM make your electrical diagramming simple, efficient, and effective. You can simply and quickly drop the ready-to-use objects from libraries into your document to create the electrical diagram.

Pic. 2. Electrical Engineering symbols
Electrical diagram software will assist you in drawing your electrical diagrams with minimal effort and makes it very easy for beginners.
Electrical symbols and smart connectors help present your electrical drawings, electrical schematic, wiring diagrams and blue prints.
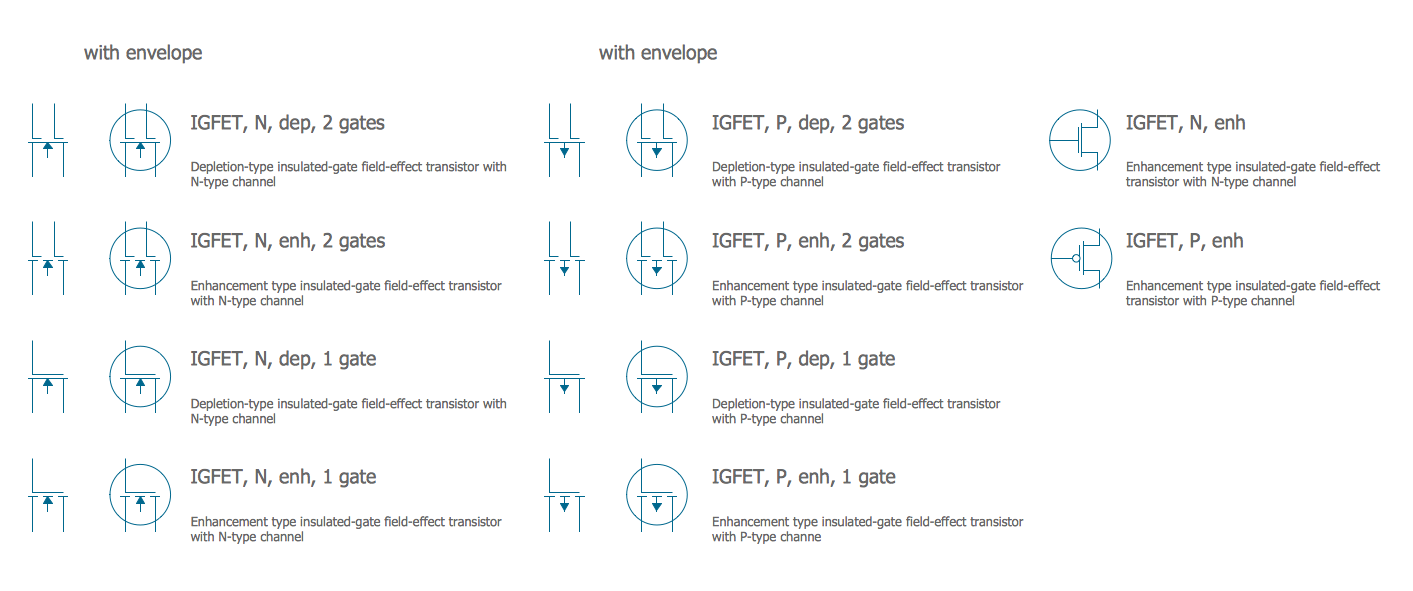
Pic. 3. Electrical Symbols — IGFET
Most of the electrical symbols can be changed in their appearance, styles and colors according to users' requirements. Electrical symbols are used to represent various electrical and electronic devices in a schematic diagram of an electrical or electronic circuit.
The following table lists some IGFET electrical symbols in our electrical diagram software.
| Symbol |
Meaning |
| Electrical Symbols — IGFET |
 | IGFET, N, dep, 2 gates, env |
 | IGFET, N, dep, 2 gates |
 | IGFET, N, enh, 2 gates, env |
 | IGFET, N, enh, 2 gates |
 | IGFET, N, dep, 1 gate, env |
 | IGFET, N, dep, 1 gate |
 | IGFET, N, enh, 1 gate, env |
 | IGFET, N, enh, 1 gate, env |
 | IGFET, P, dep, 2 gates, env |
 | IGFET, P, dep, 2 gates |
 | IGFET, P, enh, 2 gates, env |
 | IGFET, P, enh, 2 gates |
 | IGFET, P, dep, 1 gate, env |
 | IGFET, P, dep, 1 gate |
 | IGFET, P, enh, 1 gate, env |
 | IGFET, P, enh, 1 gate |
 | IGFET, N, enh |
 | IGFET, P, enh |
An insulated-gate field-effect transistor or IGFET is a related term almost synonymous with MOSFET. The term may be more inclusive, since many "MOSFETs" use a gate that is not metal, and a gate insulator that is not oxide. Another synonym is MISFET for metal–insulator–semiconductor FET.
How to Create an Electrical Diagram Using IGFET Library
TEN RELATED HOW TO's:
ConceptDraw DIAGRAM diagramming and vector drawing software enhanced with Electrical Engineering Solution from the Industrial Engineering Area of ConceptDraw Solution Park offers you powerful tools and libraries with incredibly large quantity of predesigned electrical symbols as electrical schematic symbols for easy designing professional looking Electrical Schematics.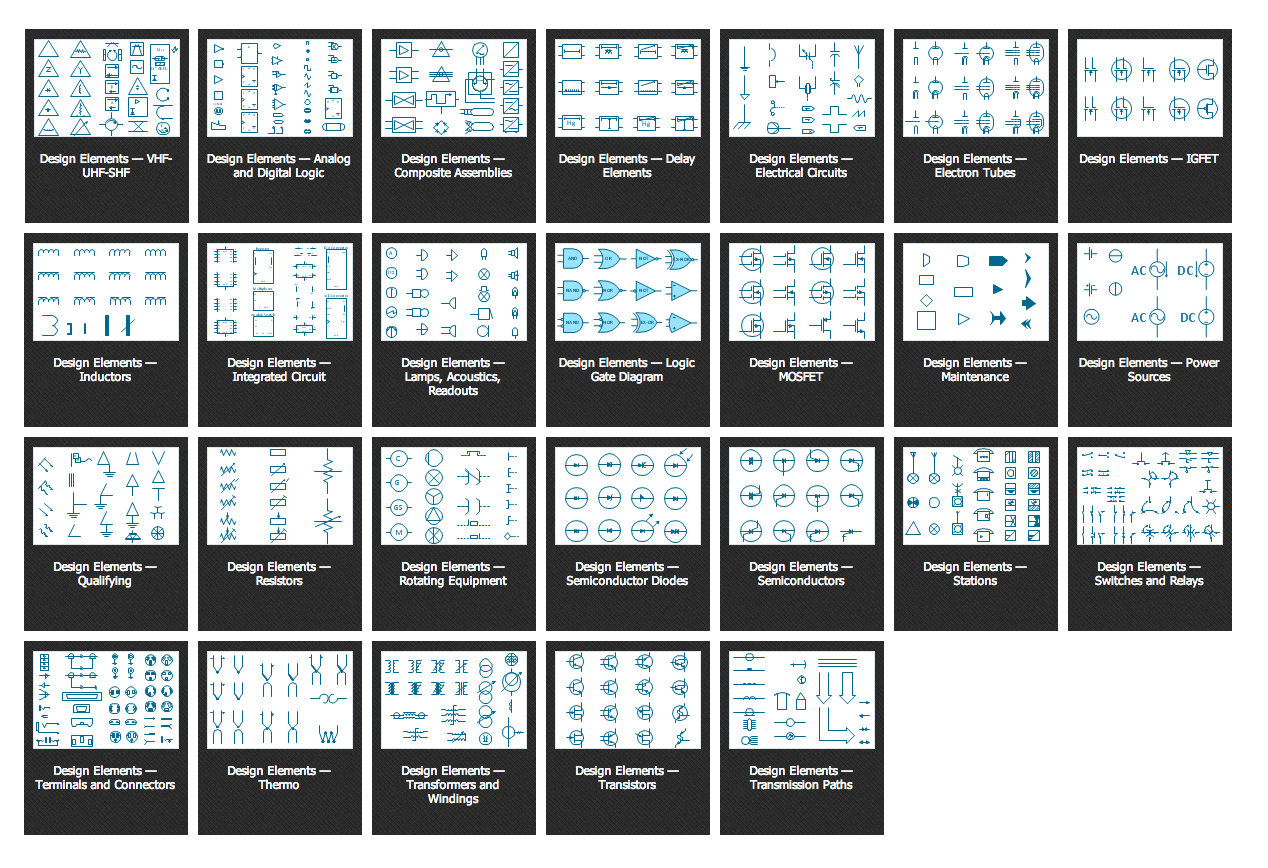
Picture: Electrical Symbols, Electrical Schematic Symbols
Related Solution:
A resistor is a passive two-terminal electrical component that implements electrical resistance as a circuit element. Resistors may be used to reduce current flow, and, at the same time, may act to lower voltage levels within circuits. In electronic circuits, resistors are used to limit current flow, to adjust signal levels, bias active elements, and terminate transmission lines among other uses. Fixed resistors have resistances that only change slightly with temperature, time or operating voltage. Variable resistors can be used to adjust circuit elements (such as a volume control or a lamp dimmer), or as sensing devices for heat, light, humidity, force, or chemical activity.
26 libraries of the Electrical Engineering Solution of ConceptDraw DIAGRAM make your electrical diagramming simple, efficient, and effective. You can simply and quickly drop the ready-to-use objects from libraries into your document to create the electrical diagram.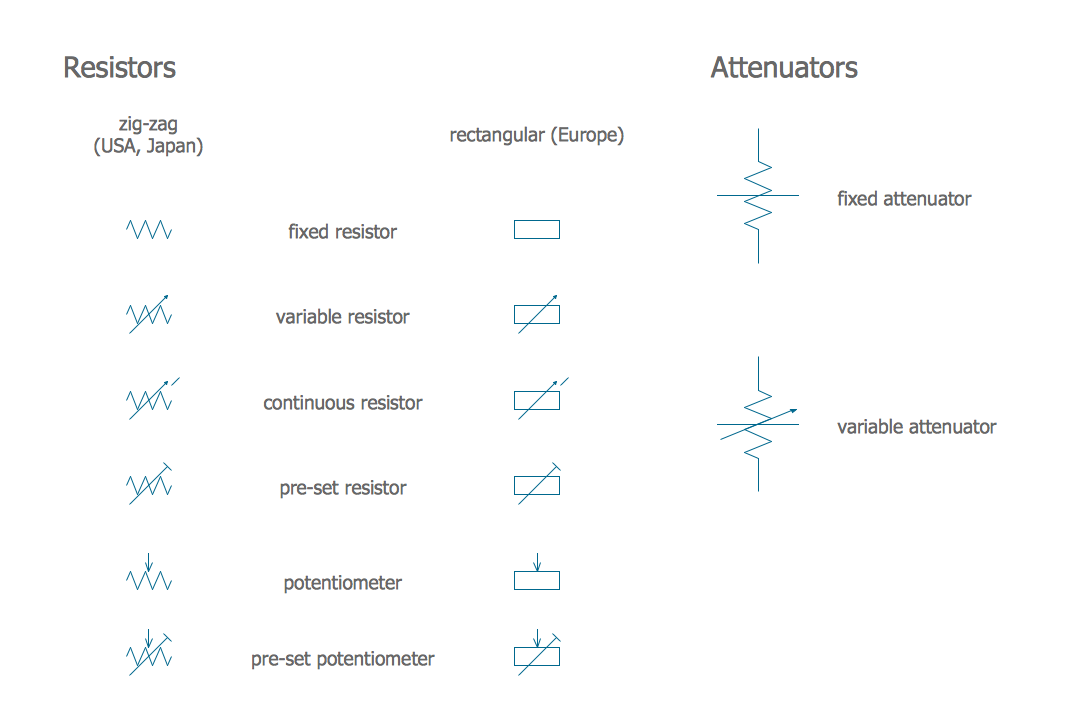
Picture: Electrical Symbols — Resistors
Related Solution:
Electrical rotating machines, such as motors and generators, are vital assets for any power plant or large industrial company.
An electric motor is an electrical machine that converts electrical energy into mechanical energy. The reverse of this would be the conversion of mechanical energy into electrical energy and is done by an electric generator.
In normal motoring mode, most electric motors operate through the interaction between an electric motor's magnetic field and winding currents to generate force within the motor. In certain applications, such as in the transportation industry with traction motors, electric motors can operate in both motoring and generating or braking modes to also produce electrical energy from mechanical energy.
26 libraries of the Electrical Engineering Solution of ConceptDraw DIAGRAM make your electrical diagramming simple, efficient, and effective. You can simply and quickly drop the ready-to-use objects from libraries into your document to create the electrical diagram.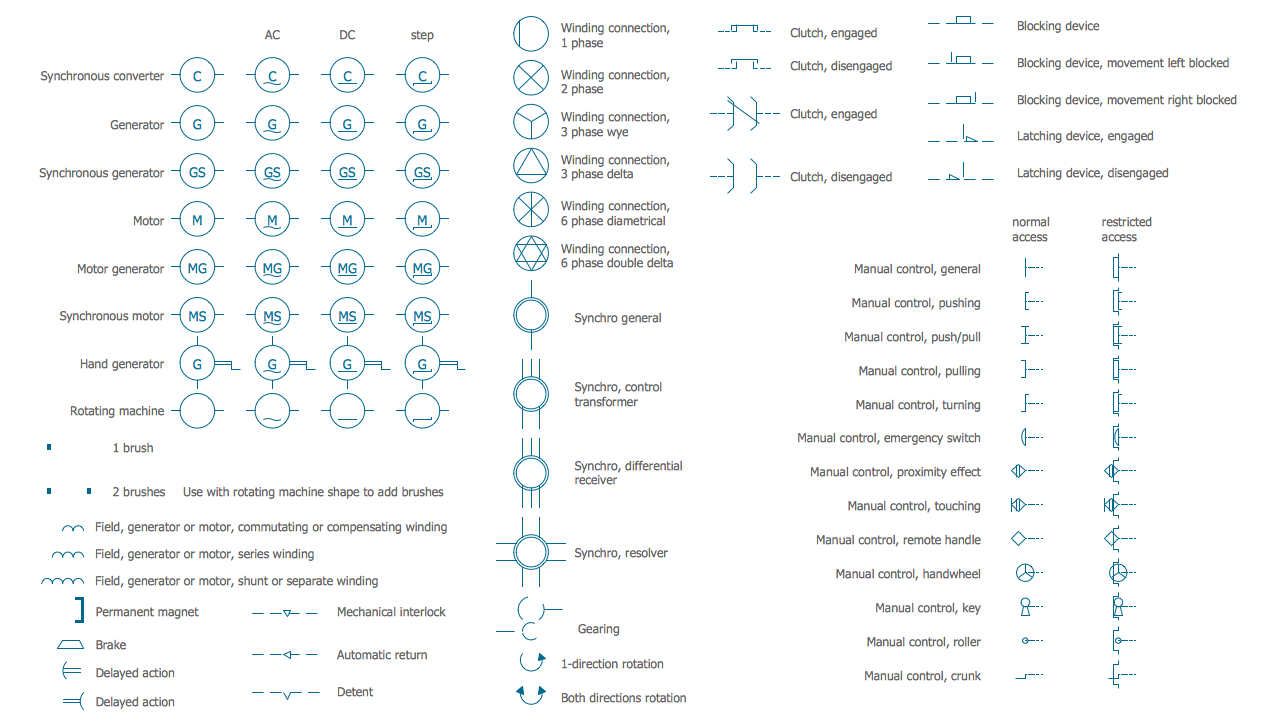
Picture: Electrical Symbols — Rotating Equipment
Related Solution:
Electrical Engineering Solution used together with ConceptDraw DIAGRAM drawing facilities makes short a work of drawing various electrical and electronic circuit schemes. A library of vector objects composed from symbols of Analog and Digital Logic elements of electric circuit includes 40 symbolic images of logic gates, bistable switches of bi-stable electric current, circuit controllers, amplifiers, regulators, generators, etc. All of them can be applied in electronic circuit schemes for showing both analog and digital elements of the circuit.
Electrical Engineering Solution used together with ConceptDraw DIAGRAM drawing facilities makes short a work of drawing various electrical and electronic circuit schemes. A library of vector objects composed from symbols of Analog and Digital Logic elements of electric circuit includes 40 symbolic images of logic gates, bistable switches of bi-stable electric current, circuit controllers, amplifiers, regulators, generators, etc. All of them can be applied in electronic circuit schemes for showing both analog and digital elements of the circuit.
Picture:
Electrical Diagram Symbols F.A.Q.
How to Use Electrical ConceptDraw Diagram Software
Related Solution:
Electrical plan is a document that is developed during the first stage of the building design. This scheme is composed of conventional images or symbols of components that operate by means of electric energy. To simplify the creation of these schemes you can use house electrical plan software, which will not require a long additional training to understand how to use it. You only need to install the necessary software ant it’s libraries and you’ll have one less problem during the building projection.
Any building contains a number of electrical systems, including switches, fixtures, outlets and other lightening equipment. All these should be depicted in a building electrical plans and included to general building documentation. This home electrical plan displays electrical and telecommunication devices placed to a home floor plan. On the plan, each electrical device is referenced with the proper symbol. Electrical symbols are used for universal recognition of the building plan by different persons who will be working on the construction. Not all possible electric symbols used on a certain plan, so the symbols used in the current home plan are included to a legend. The electrical home plan may be added as a separate document to a complete set of building plans.
Picture: How To use House Electrical Plan Software
Related Solution:
The fundamental concepts of electrical engineering in our detailed guide. ✔️ Discover essential electrical engineering software tools. 🔸 The main types of electrical engineering you need to know in this article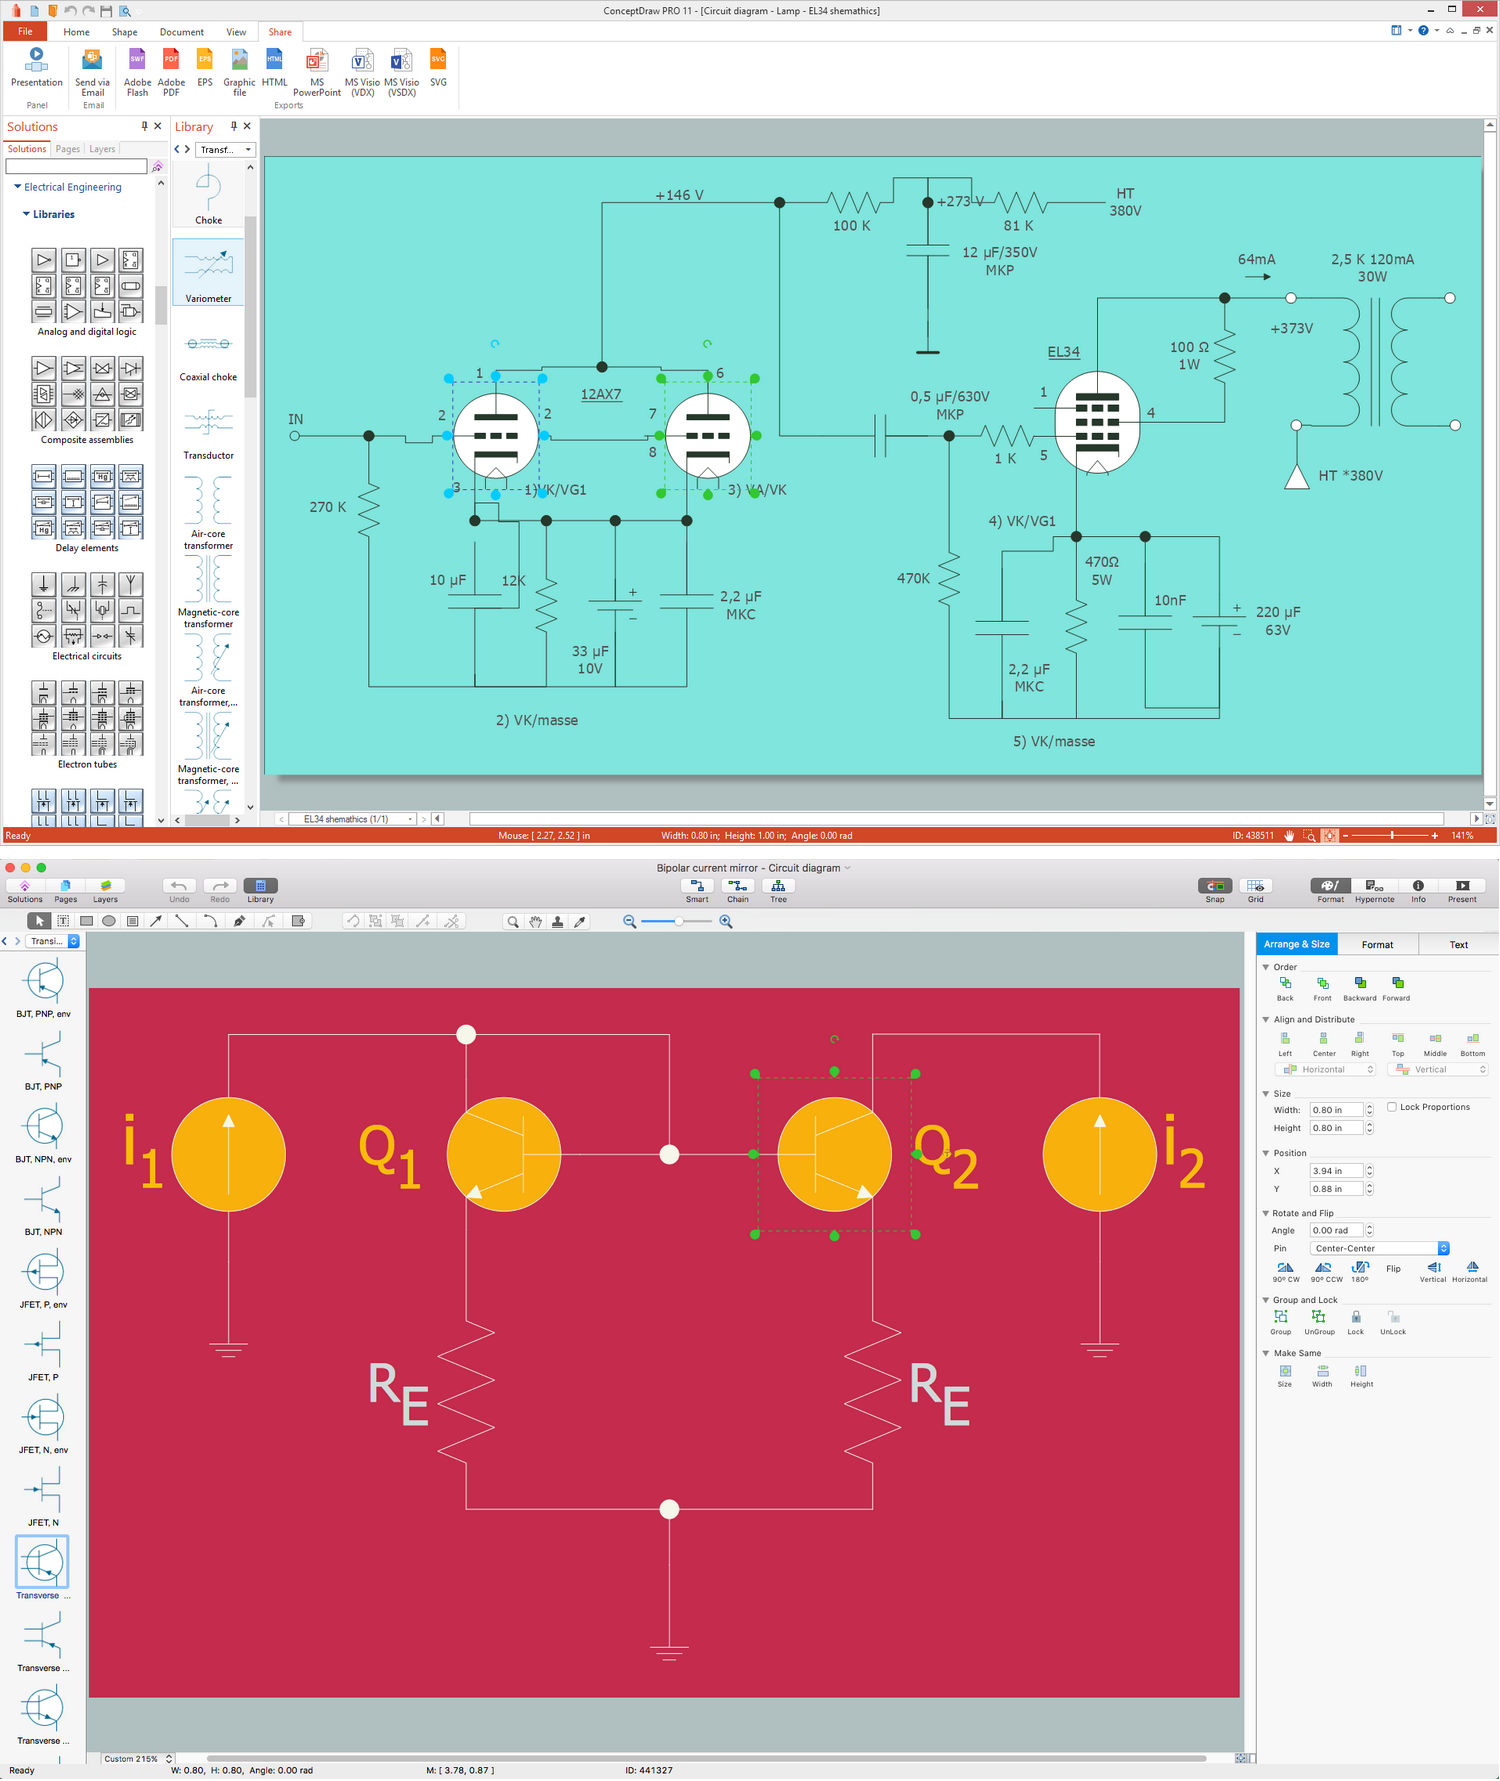
Picture:
What is Electrical Engineering?
Basic Electrical Engineering Software
Related Solution:
A transistor is a semiconductor device used to amplify or switch electronic signals and electrical power. It is composed of semiconductor material usually with at least three terminals for connection to an external circuit. A voltage or current applied to one pair of the transistor's terminals changes the current through another pair of terminals. Because the controlled (output) power can be higher than the controlling (input) power, a transistor can amplify a signal. Today, some transistors are packaged individually, but many more are found embedded in integrated circuits.
26 libraries of the Electrical Engineering Solution of ConceptDraw DIAGRAM make your electrical diagramming simple, efficient, and effective. You can simply and quickly drop the ready-to-use objects from libraries into your document to create the electrical diagram.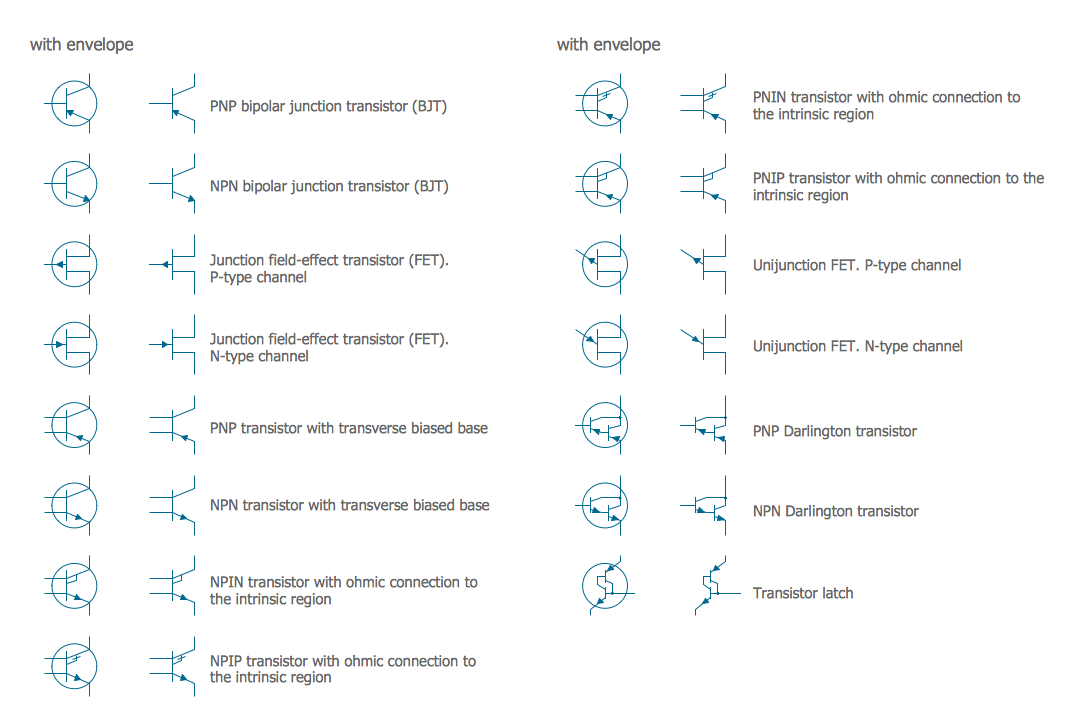
Picture: Electrical Symbols — Transistors
Related Solution:
The metal–oxide–semiconductor field-effect transistor (MOSFET, MOS-FET, or MOS FET) is a type of transistor used for amplifying or switching electronic signals.
Although the MOSFET is a four-terminal device with source (S), gate (G), drain (D), and body (B) terminals, the body (or substrate) of the MOSFET is often connected to the source terminal, making it a three-terminal device like other field-effect transistors. Because these two terminals are normally connected to each other (short-circuited) internally, only three terminals appear in electrical diagrams. The MOSFET is by far the most common transistor in both digital and analog circuits, though the bipolar junction transistor was at one time much more common.
26 libraries of the Electrical Engineering Solution of ConceptDraw DIAGRAM make your electrical diagramming simple, efficient, and effective. You can simply and quickly drop the ready-to-use objects from libraries into your document to create the electrical diagram.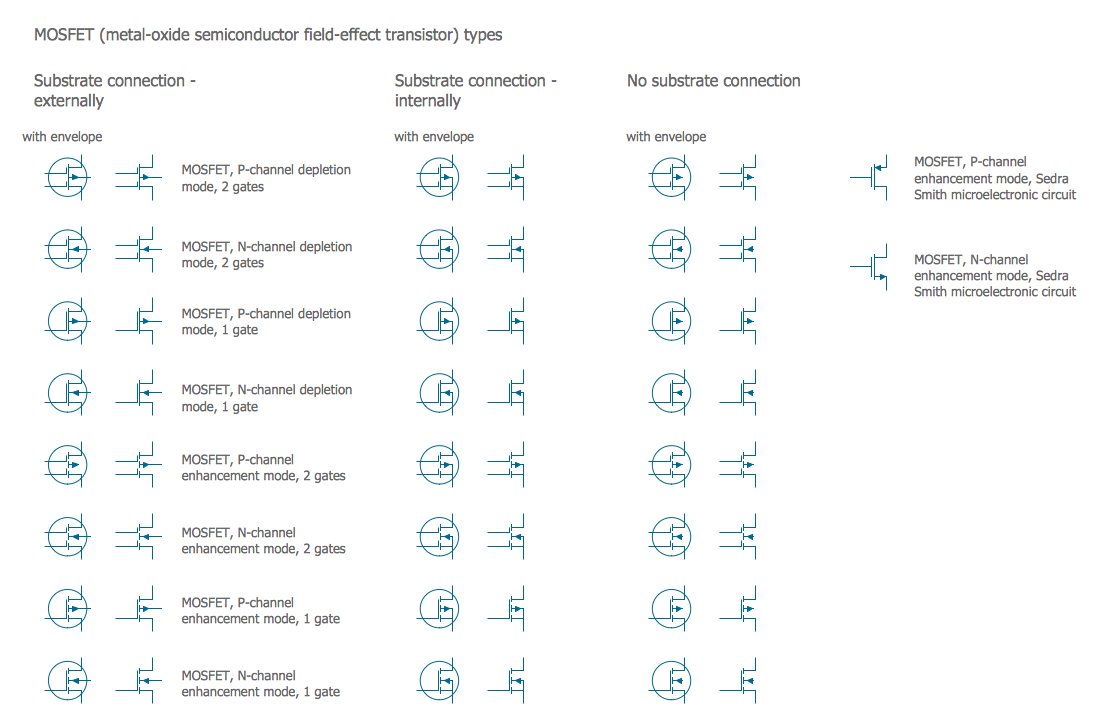
Picture: Electrical Symbols — MOSFET
Related Solution:
26 libraries of the Electrical Engineering Solution of ConceptDraw DIAGRAM make your electrical diagramming simple, efficient, and effective.
Picture: Electrical Symbols — Thermo
Related Solution:
A circuit diagram is sometimes also called an elementary diagram, electronic schematic or electrical diagram circuits. It is essential in construction of any electronic equipment. Among many digital drawing tools available, ConceptDraw DIAGRAM is a leading circuits and logic diagram software, affording for easy and quick creation of even the most advanced and complex diagram designs. This makes it a perfect choice for computer science and any kind of electronic engineering.
This drawing includes the graphic symbols that may be in use while creating a logic circuit diagram. The diagrams of such kind are used in the electronics industry. The logic symbol depicts a device that realizes a Boolean type functions. Practically a logic symbol means transistor, diodes, relays, and other mechanical or optical details which provide function of closing or opening "gates". Totally the logic circuits can involve millions of gates. ConceptDraw Electrical Engineering solution gives the opportunity to create a circuit diagrams both simple and difficult.
Picture: Circuits and Logic Diagram Software
Related Solution:


 button in the upper right corner of the object.

 . To connect elements using this tool, drag the connector from one connect dot to another.You can use Layers to place connections on different layers.

