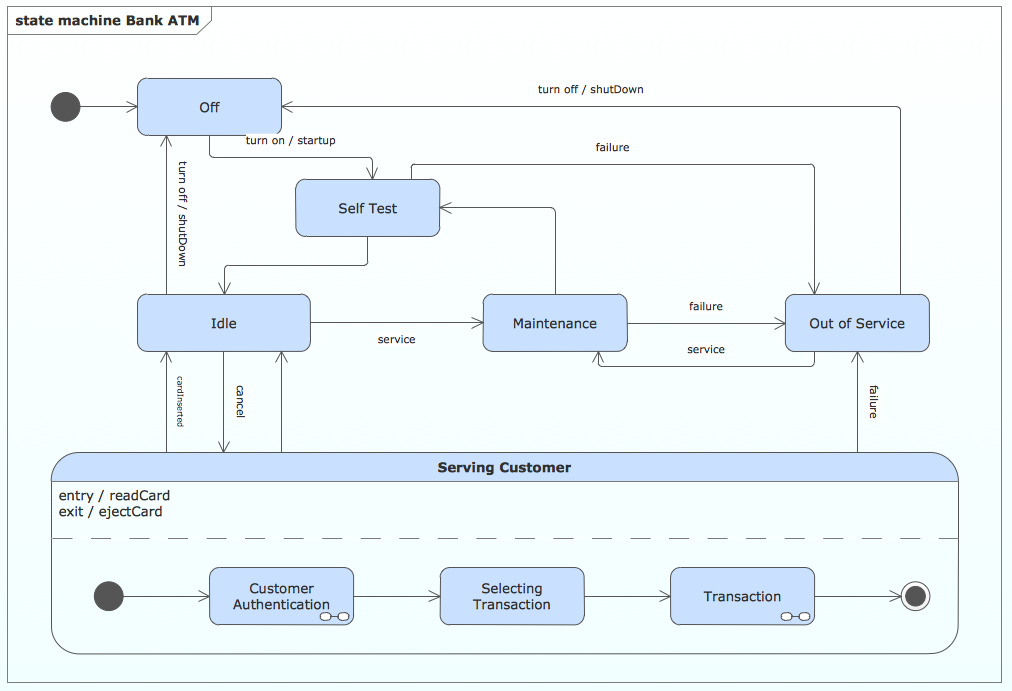
ConceptDraw Rapid UML solution provides UML State Machine Diagram samples, templates and library of vector stencils.
Use ConceptDraw DIAGRAM diagramming and vector drawing software enhanced with Rapid UML solution from ConceptDraw Solution Park to create your own UML state machine diagrams for both behavioral state machines and protocol state machines.

Draw behavioral state machine diagrams to model the behavior of individual entities (e.g., class instances).
Draw protocol state machine diagrams to visualize usage protocols and to specify the legal usage scenarios of classifiers, interfaces and ports.

TEN RELATED HOW TO's:
What is the accounting cycle? The accounting cycle is a sequence of steps that occur in the accounting period and include the processes of identifying, collecting, analyzing documents, recording transactions, classifying, summarizing, and reporting financial information of an organization.
Picture: What is the Accounting Cycle?
Related Solution:
Mind map of a physical activity sample plan detailing a proposal to incorporate more physical activity into a college community.
Picture: Physical Activity Plan
Related Solution:
It is impossible to imagine mechanical engineering without drawings which represent various mechanical schemes and designs. ConceptDraw DIAGRAM diagramming and vector drawing software supplied with Mechanical Engineering solution from the Engineering area of ConceptDraw Solution Park offers the set of useful tools which make it a powerful Mechanical Drawing Software.
Picture: Mechanical Drawing Software
Related Solution:
A flowchart is a powerful tool for examining processes. It helps improving processes a lot, as it becomes much easier to communicate between involved people, to identify potential problems and to optimize workflow. There are flowcharts of different shapes, sizes and types of flowchart vary from quite basic process flowcharts to complex program flowcharts. Nevertheless, all these diagrams use the same set of special symbols like arrows to connect blocks, parallelogram to show data receiving or rectangles for showing process steps.
Basic flowcharts are used to represent a simple process algorithm. A basic flowchart notation consists of rectangles (business processes), arrows (the flow of information, documents, etc.). The same notation is used in items such as the "decision", which allow you to do the branching. To indicate the start of the entire business process and its termination can be used the "Terminator" element. The advantages of Basic Flowchart are simplicity and clarity. With it you can quickly describe the business process steps. Creating of Basic Flowchart does not require any special knowledge, as easily understand by employees with different levels of education and IQ.
Picture: Types of Flowchart: Comprehensive Overview
Related Solution:
Any business process consists from a number of tasks carrying out the certain business goal. It is useful to diagram business processes to ensure that they are as foolproof, logical and sequential as possible. This business process diagram describes a typical booking process flow by the example of a cab booking process. It can be used as a roadmap for any booking system implementation. Diagramming a business process allows you to look at the entire project and take into account all types of possible scenarios. Business process diagram helps you investigate and clarify the process thoroughly so that you can find out how it can be improved. Business process diagram supports team communications by ensuring that each process element is clear and everyone in the team is on the same page.
Sometimes your company brings you less profit than you expect it to be, and it’s difficult to reveal the causes. Maybe it’s time to learn new technologies, because business diagram are easily developed by means of special software, so you won’t make any extra effort. In return, you will increase your productivity and get more done in a less time.
Picture: Business Diagram Software
Related Solutions:
A Data Flow Diagram (DFD) is a graphical technique which allows effectively model and analyze the information processes and systems. The ability to fast and easy create the DFDs is made possible with Data Flow Diagrams solution from the Software Development area of ConceptDraw Solution Park. For designing the Data Flow Diagrams are used simple DFD flowchart symbols which are connected each other by arrows depicting the data flow from one step to another.
Picture: DFD Flowchart Symbols
Related Solution:
Building plans are usually very complicated and a hard work to do. It would be nice to use a proper drawing software to facilitate the task. Design a site plan quick and easily with all the stencils and samples from ConceptDraw libraries.
This drawing shows content of the ConceptDraw vector libraries related to the site planning and arrangement of the living environment. ConceptDraw delivers about 50 libraries containing near one and a half thousands vector objects that will help you to design territory arrangement plans and make the Site plan sketches. You can use the Parking and Roads library for designing a parking space, or drawing transport management schemes. The Site Accessories library provides a number of objects, that allow you to depict various equipment of vehicle access control, street lamps, benches, trash cans and other items of the street environment.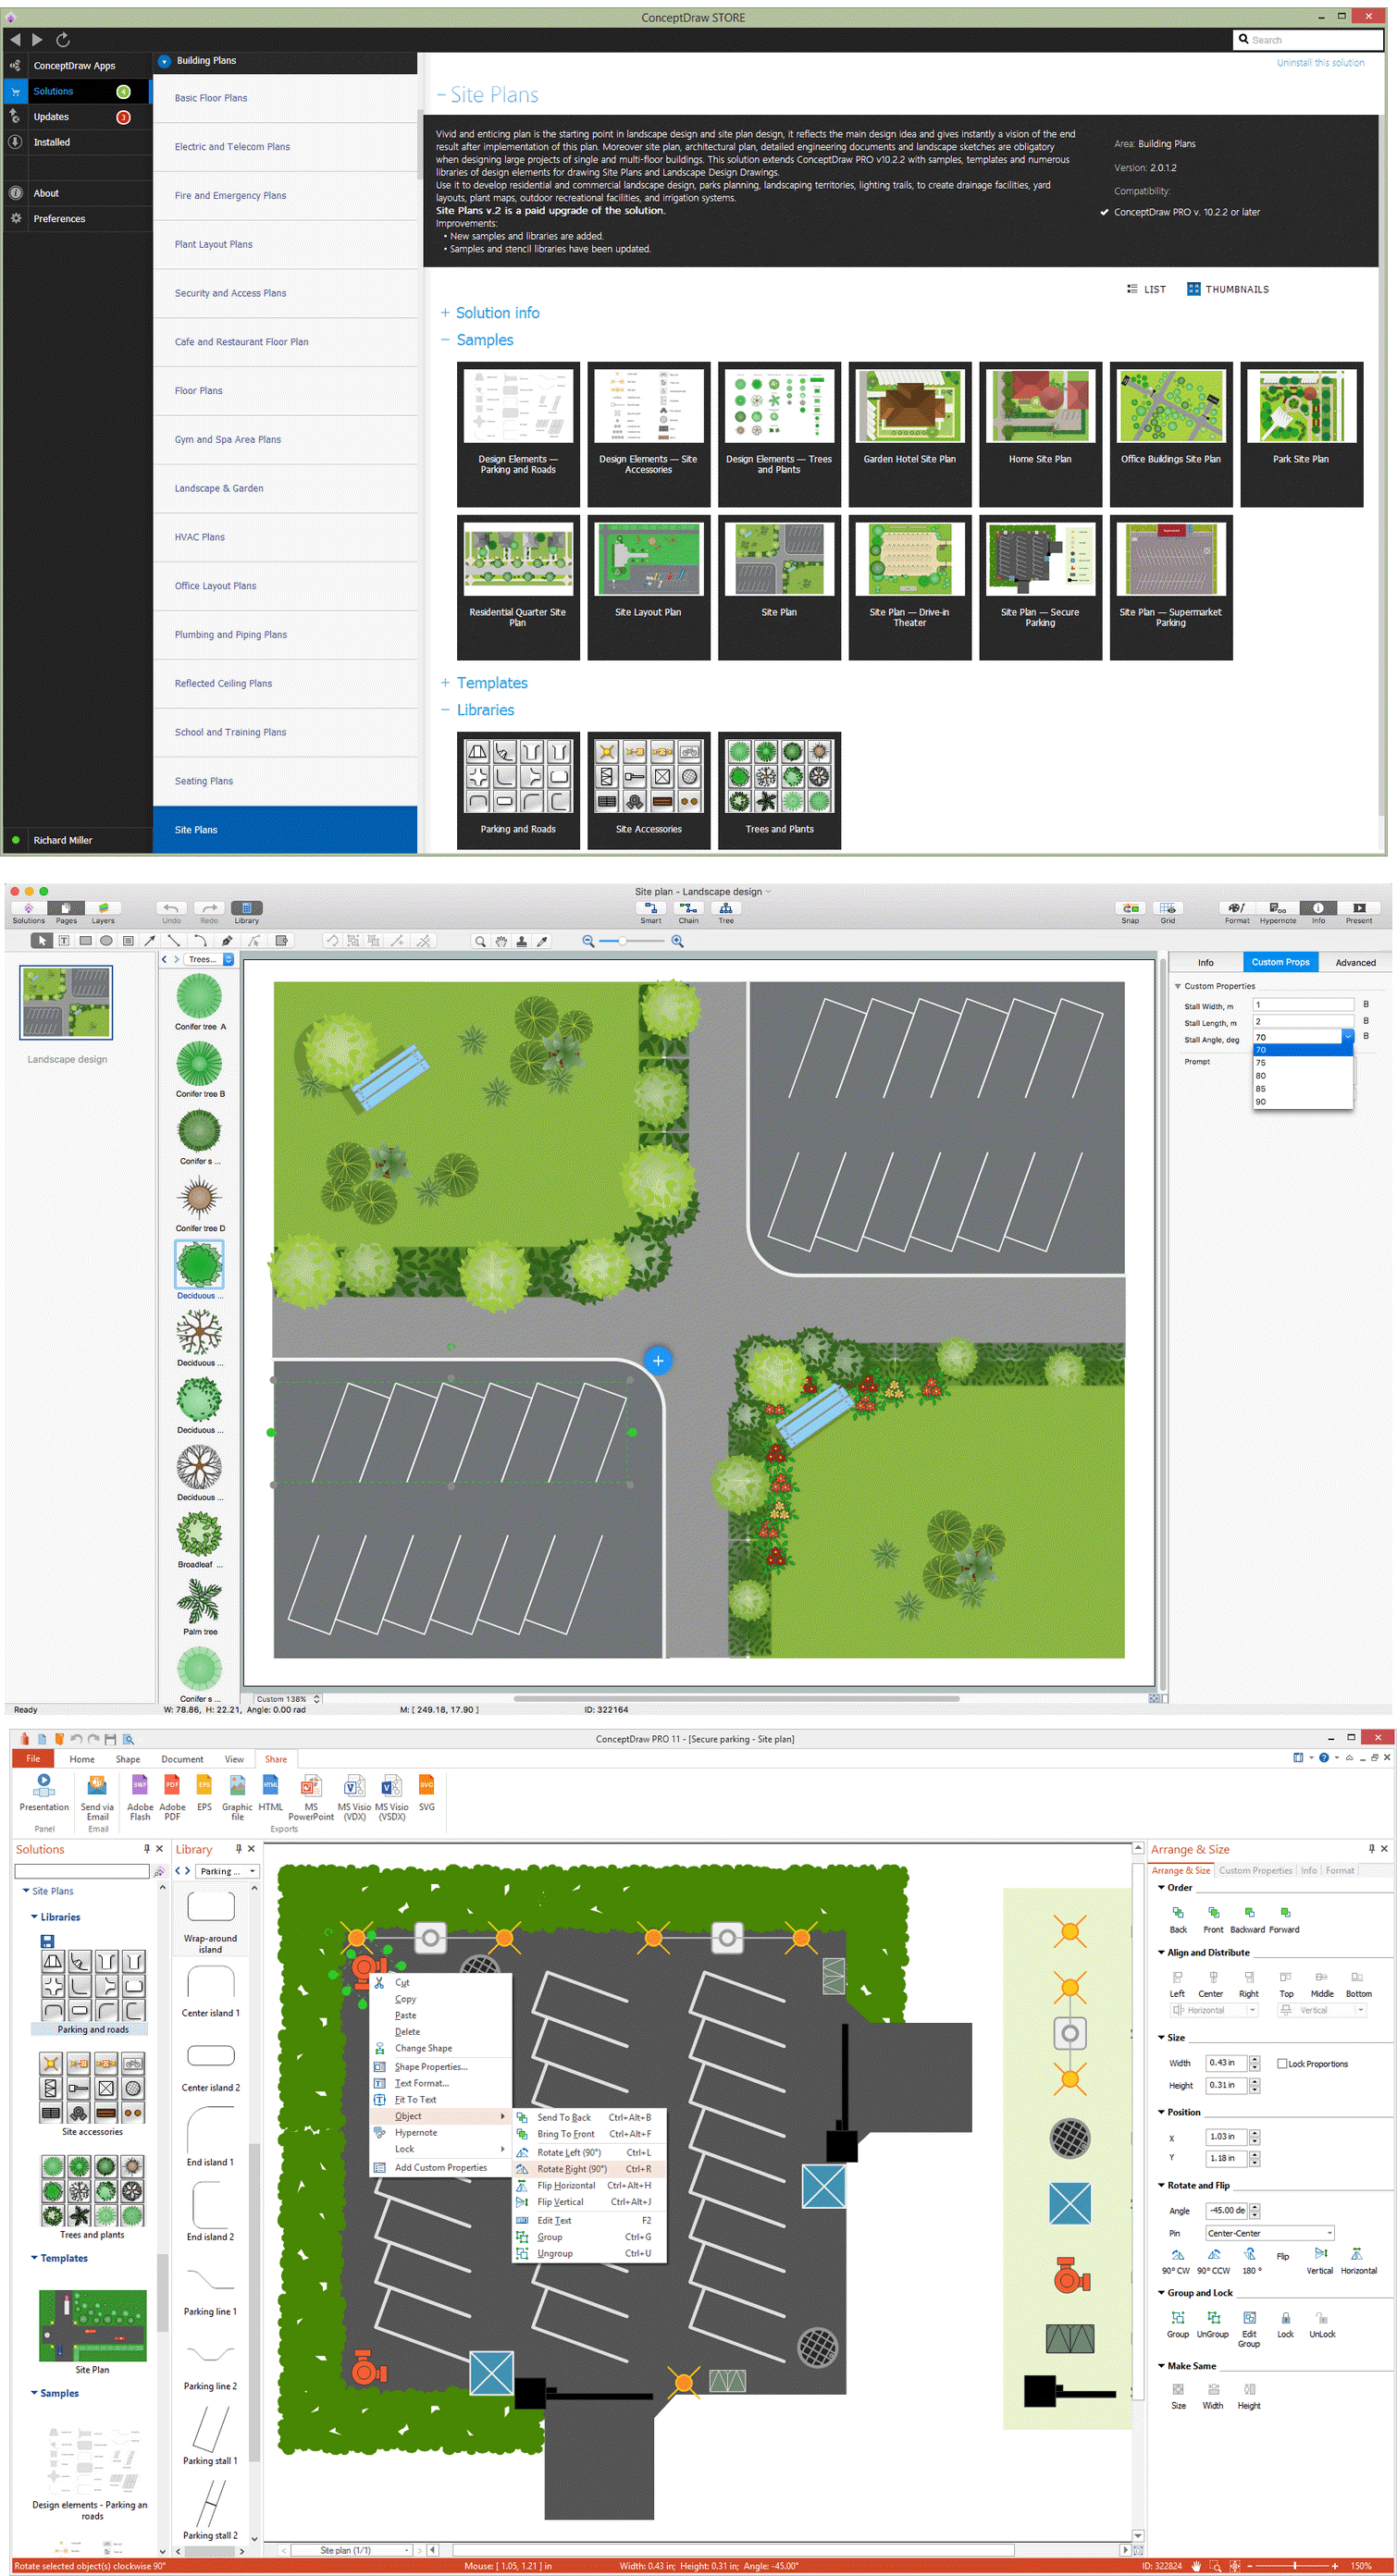
Picture: Building Drawing Software for Design Site Plan
Related Solution:
Database structures are usually described by ER-diagrams which represents entities as boxes with lines-connections between them. You can create any entity-relationship diagram (ERD) by means of ConceptDraw DIAGRAM using ready-to-use templates and special libraries containing all the needed symbols and shapes. Creating a model for your database from now on can take just a few minutes.
ERD (entity relationship diagram) designed to show the logical structure of databases. It intended to depict the relationships between data components (entities). ERDs are a popular tool for software engineers and architects. Using ERD they can manage the every aspect of database design. Also ERD can be used as guidelines for testing and communications before software release. This diagram represents the file reference system of the WordPress web platform. Because entity relationship diagrams have such a broad application area through the prevalence of database technology, it can be applied for a wide range of users.
Picture: Entity-Relationship Diagram (ERD) with ConceptDraw DIAGRAM
Related Solution:
Diagramming is an astonishing way to visualize business processes. The list of the most common business process flowchart symbols is quite long starting from basic flowcharts, continuing with SIPOC diagrams. Business process modeling was never easier than now, with special ConceptDraw Business Process Mapping solution.
To carry out all professional standard requirements for business processes mapping, it is necessarily to follow the special graphical notations. ConceptDraw Business Process Mapping solution offers an exhaustive suite of tools to aid business process mapping. There are three vector libraries SIPOC Diagrams, Business Process Flowcharts, and Swim Lanes that contains totally more than 50 symbols of standard BPM notations. This is all that professionals need to effectively evaluate and manage quality in business processes.
Picture: Business Process Flowchart Symbols
Related Solution:
UML Component Diagrams are used to illustrate the structure of arbitrarily complex systems and illustrates the service consumer - service provider relationship between components.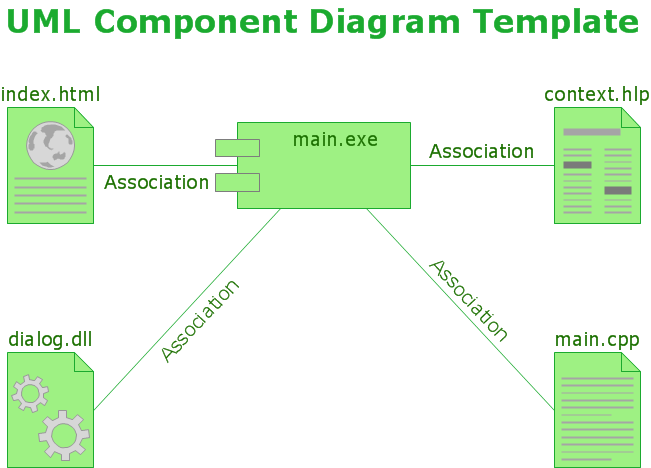
Picture: UML Component Diagram

