Sales Process FlowchartFlowchart Examples
For most commercial organizations, the sales process is inherent to its existence and ability to create profit. Although each company will achieve this aim in its own way, the core selling process remains similar throughout — a potential buyer or prospective customer exchanges money with an organization in return for goods or services. Despite this rather simplistic definition, there exists huge scope as to which approach is taken. Indeed, it is not uncommon for the sales division to be the largest within a corporate structure, employing a team of salespeople, analysts, and the sales managers, who are in charge of sales division operations.
Should a business company need to visualize a solution model for a some aspect of their business, there is a good chance that resulting diagram will take the form of a flowchart. They are an invaluable tool when charting a sales process — they give you the opportunity to visualise and understand the process, and also serve to highlight any issues or bottlenecks that might occur throughout the workflow.

Incredible quantity of people from all over the world are involved in the process of selling very many different things. Thus sales process is well known to all of them and it’s well known that the process can be also very well controlled. To make maximum profit of this process of selling what you work with, we recommend to draw a flowchart which is called the sales process flowchart. Such flowchart is meant to be used in the commerce and it is very useful for tracking all of the sub-processes within one large process of trading.
Whether your organization is commercial or it is a charity organization, you can always make the best out of your business activity by checking and tracking all of what happens within your particular industry. To create as much profit as you want and as you can, we recommend you to make all possible for getting all of the right tools for implementing your plans. To attract the potential customer, you have to do as much as you can and the sales process flowchart should be a part of doing your business. To get more money exchanging your goods for them and so to get more profit can be quite simple as long as you know what to do. Apart from marketing there is always a need of having the other right and appropriate tools, such as the smart applications and that very necessary software.
One of the most popular applications nowadays widely used for creating many different flowcharts, as well as charts, diagrams, plans and schemes, is ConceptDraw DIAGRAM This software is the one which is famous for its developers providing ConceptDraw DIAGRAM users with many different tools, such as appropriate design elements and pre-made examples. For most commercial organizations this application can be very helpful and so for you too, if you deal with wholesales, marketing, etc.
Working as a salesperson, analyst, sales manager, being in charge of sales division operations using ConceptDraw DIAGRAM can be a simple job to do and the fun business to run. Visualizing a solution model for some aspect of your business in a way of a flowchart must be one of the best options. Visualizing and understanding the sales process and serving your customers the way they want to be served is the key behaviour which will lead you to that day when you will get what you wanted from the very start of your career in sales. To highlight any issues or bottlenecks that might occur throughout the workflow in a way of a sales process flowchart is very simple and very smart thing to do. And to use one of the best existing applications in order to make such flowchart is one of the best decisions that can be made.
ConceptDraw DIAGRAM software was created by the team of the IT specialists and it is now available with extensions of many different solutions. Cross-Functional Flowcharts solution can be found and downloaded from the Business Processes area and Sales Flowchart solution can be found and downloaded from the Marketing area of ConceptDraw Solution Park. Both of these solutions are available to be downloaded from ConceptDraw STORE app which is a new product of CS Odessa. ConceptDraw STORE can be downloaded and used a part of ConceptDraw OFFICE suite. It contains very many different solutions and each of the solution includes the stencil libraries with lots of design elements and symbols as well as examples of already previously made professional flowcharts, charts, schemes, diagrams and plans.
Cross-functional flowcharts solution is a very powerful complex of tools for creating your own flowcharts. It is also a very useful tool for visualizing and analysing all of your complex business processes, which require the involvement of multiple people, grouped in teams or departments. Cross-functional flowcharts are created for the purpose of visibly representing the sequences of the processes steps, the orders of operations, relationships between processes and the responsible functional units (for example, departments or positions).
The Cross-Functional Flowcharts solution extends ConceptDraw DIAGRAM software with cross-functional flowchart examples and templates, as well as library of vector shapes for making the process of drawing the professionally looking flowcharts fun and entertaining. Illustrate your cross-functional diagrams for further analysing, optimizing and improvement process and take as much as you can take out of your takings.
The design element in the library which is a part or this solution represent the Process itself, Terminator (indicates the beginning or the end of the program flow in your diagram), Decision (decision point between two or more paths in your flowchart), Document (data that can be read by people, such as printed output), Data (can represent any type of data in a flowchart), Predefines process (a named process, such as a subroutine or a module), Stores data (any type of stored data), Internal storage (an internal storage device), Sequential data (data that is accessible sequentially, such as data stored on magnetic tape), Direct data (data that is directly accessible, such as data stored on disk drives), Manual input, Card, Paper type, Display, Manual operation, Preparation, Parallel mode, Loop limit, On-page reference, Off-page reference, Off-page reference shapes, Yes/No decision indicators, Condition, Control transfer, Annotation, etc.
This solution allows you, as ConceptDraw DIAGRAM user, to complete the missing stages of the sales process and to track them. While outlining your sales processes or sales steps through a flowchart created with ConceptDraw DIAGRAM it is useful to have the pre-made examples of what you want to draw. Thus, this Sales Flowcharts solution can be useful in the field of sales process management for those who want to display their sales results effectively and aesthetically.
ConceptDraw defines some flowchart types, divided into ten categories
Every flowchart type has specific shapes and examples
Create your own flow charts of sales business processes using the ConceptDraw DIAGRAM software extended with the Cross-Functional Flowcharts solution from the Business Processes area or Sales Flowchart solution from the Marketing area of ConceptDraw Solution Park.

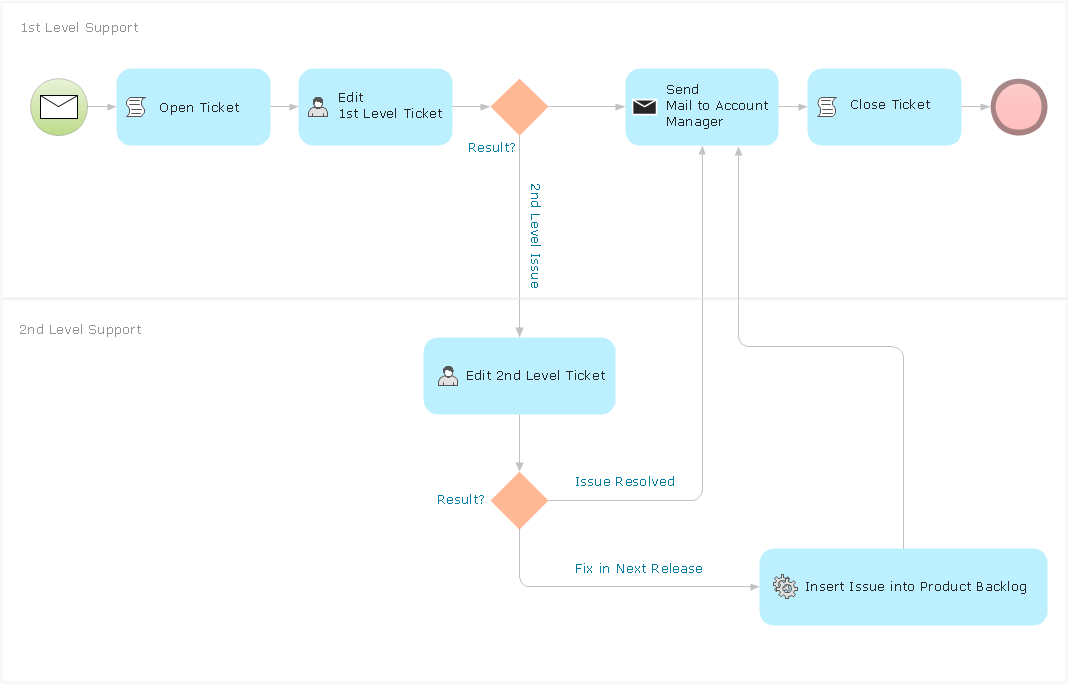
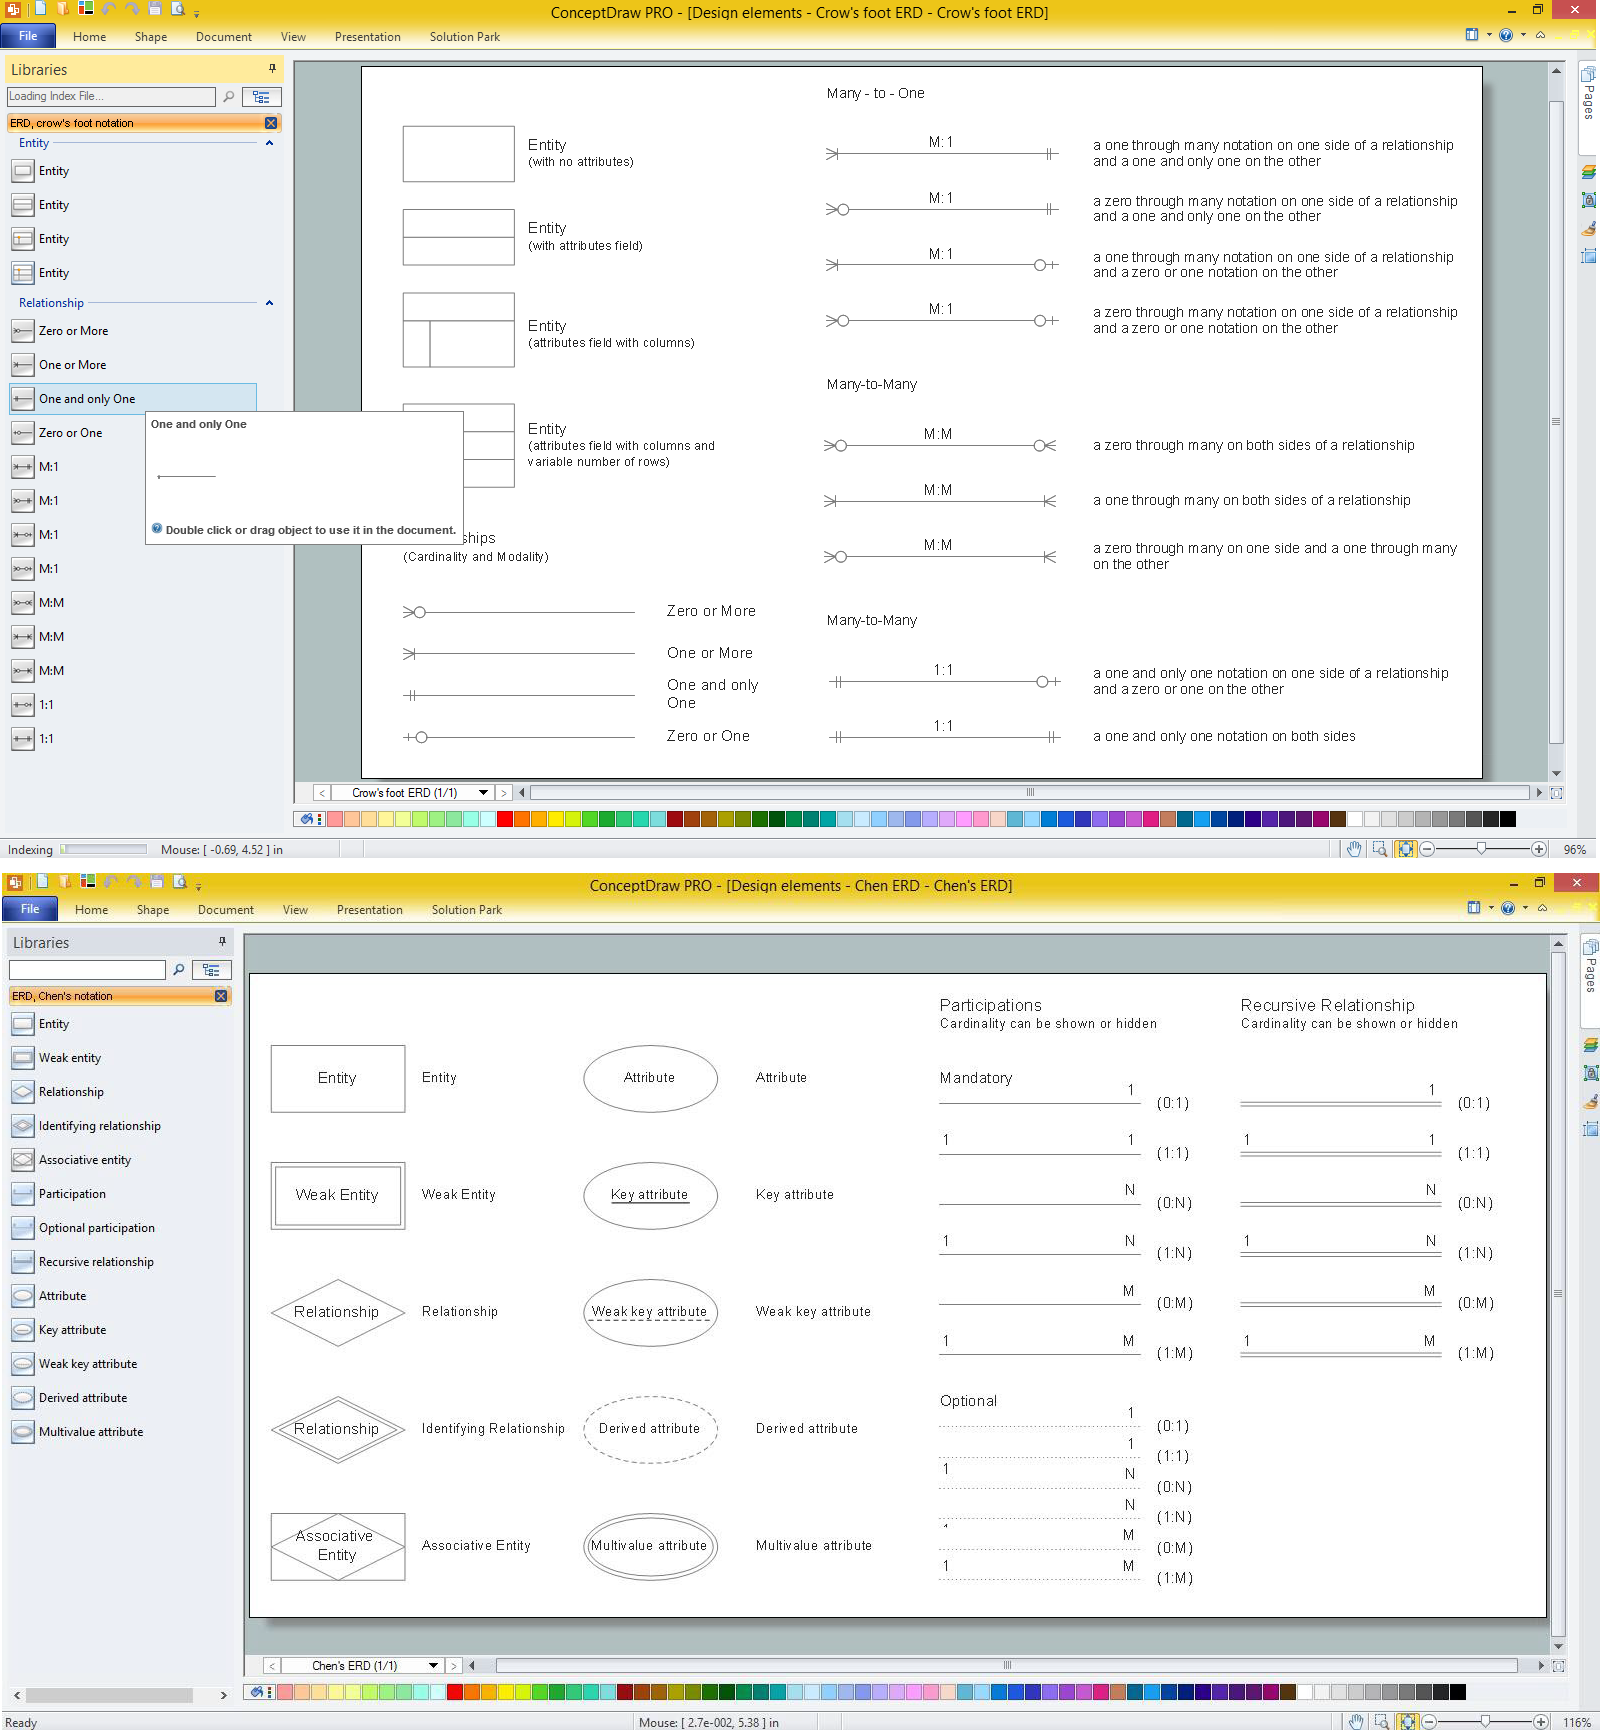
Pic.1. Sales Process Flowchart (macOS® and Windows®)
Sales Flowcharts solution extends ConceptDraw DIAGRAM software with a colourful and comprehensive selection of sales themed graphics, symbols, as well as flowchart icons, allowing you to create the vivid and informative sales process maps and workflow charts.

Pic.2. Sales Process Flowchart
"In business science a sales process describes an approach to selling a product or service.
... a "sales process" is presented as consisting of eight steps. These are:
- Prospecting / initial contact
- Preapproach — planning the sale
- Approach
- Need assessment
- Presentation
- Meeting objections
- Gaining commitment
- Follow-up
From a seller's point of view, analysis of a sales process can reveal steps in a sale that are problematic, and may allow the prediction of numbers of sales based on initial interest."
[Sales process. Wikipedia]