
Sample 1. Block diagram - Total solution process.
ConceptDraw DIAGRAM ector diagramming and business graphics software enhanced with with templates, samples and stencil libraries from ConceptDraw Solution Park helps you to easily draw flowcharts, block diagrams, bar charts, histograms, pie charts, divided bar diagrams, line graphs, area charts, scatter plots, circular arrows diagrams, Venn diagrams, bubble diagrams, concept maps, and others.
Use ConceptDraw DIAGRAM with Solution Park to draw you own diagrams, charts and graphs for graphic communication, explanation of business and personal ideas and concepts, simple visual presentation of numerical data, complex structures, logical relations, step-by-step flows of actions, operations or math algorithm.
TEN RELATED HOW TO's:
Start design your own flowchart with ConceptDraw DIAGRAM and accomplish great results at the moment.
Picture: Draw Flowcharts with ConceptDraw
Related Solution:
Plumbing systems are very important for any manufacture, and it's a good practice to have a clear scheme of that system. To create one, you should use a piping and instrumentation diagram software with a possibility to save files in vector format, so you can print them without quality loss. ConceptDraw DIAGRAM is a great tool for creating diagrams, and you don't need to be very experienced to use it efficiently.
This example of Piping and Instrumentation Diagram (P&ID) depicts a scheme that illustrates the physical sequence and functional communications of piping, instrumentation and plumbing equipment components of a typical food trailer.
Seeking to avoid health troubles in a mobile food service , the plumbing demands for food trailers must be considered accurately. This P&ID shows all of piping including a basic set of piping system components along with multiple sinks, extra water heaters and other elements to meet health guidelines.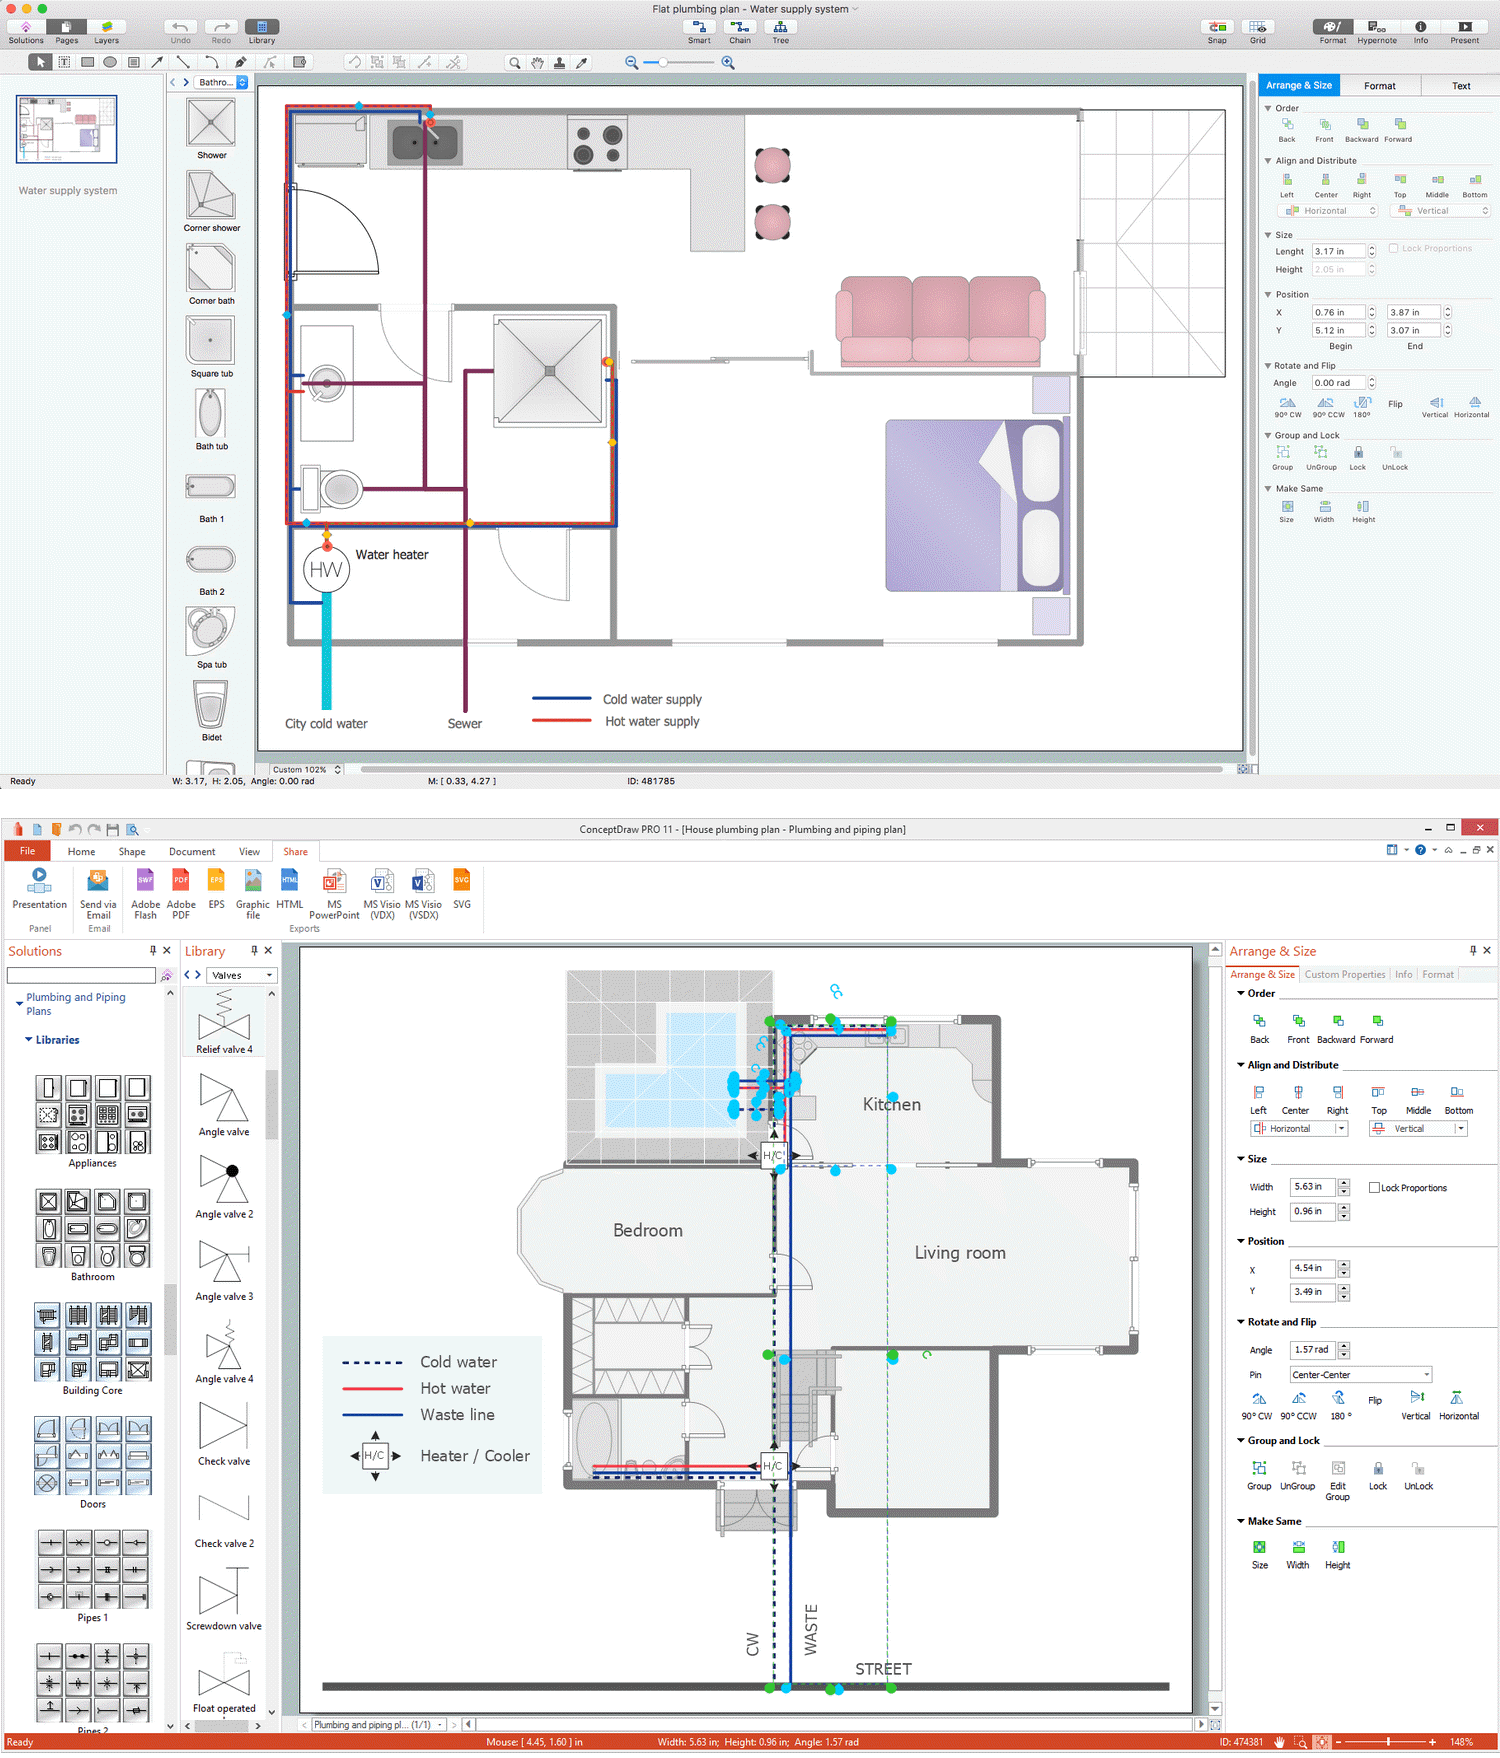
Picture: Piping and Instrumentation Diagram Software
Related Solution:
Nowadays, a constructor needs skills in various areas. For instance, knowing How To use Appliances Symbols for Building Plan, can be useful in developing illustrations for customers. Aware means armed.
This image shows the content of the Appliances library that is a component of the ConceptDraw Floor Plans solution. Being used with ConceptDraw DIAGRAM drawing facilities, this library allows you to create floor plan and interior design for your new family residence and its, undoubtedly the most important section such as kitchen and bathroom. As considering your kitchen arrangement and developing the properly variant for your apartment, one of the main points is the complete layout of the kitchen and its appliances. The vector graphical objects supplied with ConceptDraw Floor plans solution by allows you easily display the most original ideas of kitchen and bathroom layout.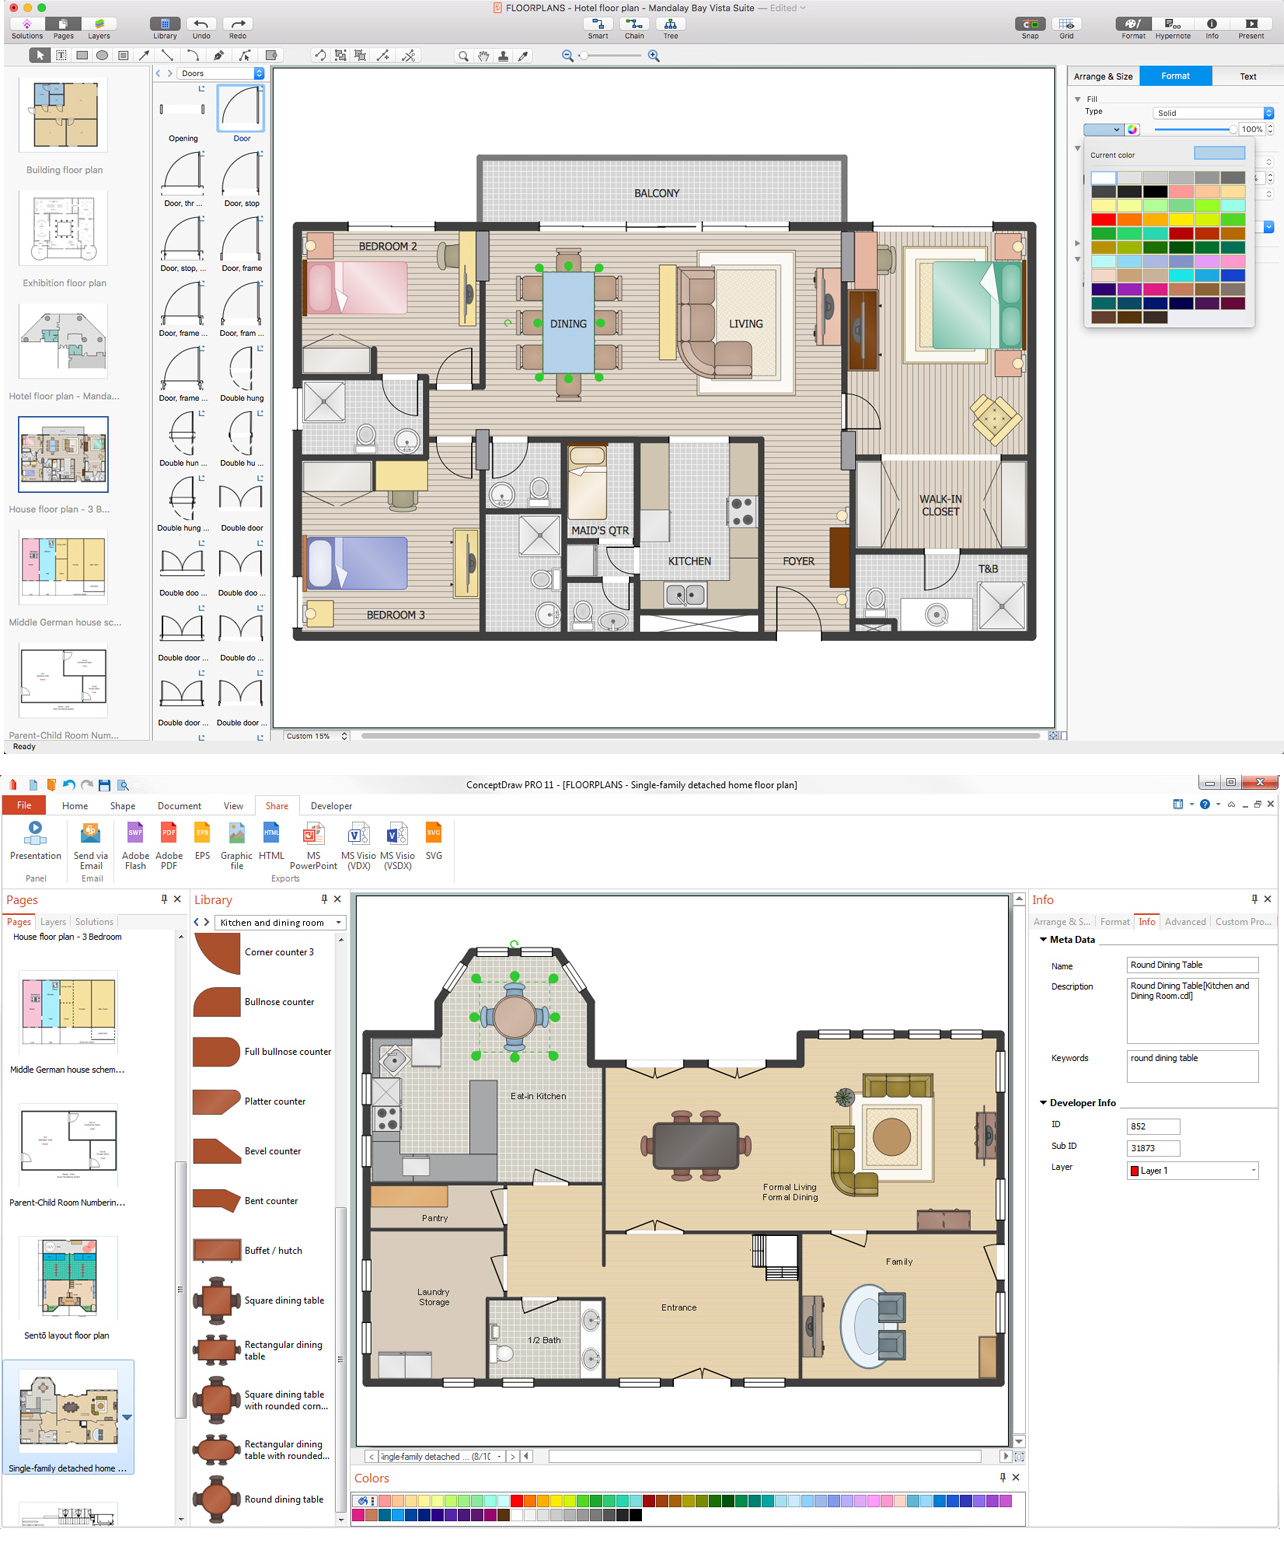
Picture: How To use Appliances Symbols for Building Plan
Related Solution:
Example of Organizational Chart - Lots of organization chart examples created by ConceptDraw Organizational Chart Software. Include company organizational chart, hospital organizational chart, hotel Organizational chart, corporate organizational chart samples etc
Picture: Example of Organizational Chart
Related Solution:
Electrical rotating machines, such as motors and generators, are vital assets for any power plant or large industrial company.
An electric motor is an electrical machine that converts electrical energy into mechanical energy. The reverse of this would be the conversion of mechanical energy into electrical energy and is done by an electric generator.
In normal motoring mode, most electric motors operate through the interaction between an electric motor's magnetic field and winding currents to generate force within the motor. In certain applications, such as in the transportation industry with traction motors, electric motors can operate in both motoring and generating or braking modes to also produce electrical energy from mechanical energy.
26 libraries of the Electrical Engineering Solution of ConceptDraw DIAGRAM make your electrical diagramming simple, efficient, and effective. You can simply and quickly drop the ready-to-use objects from libraries into your document to create the electrical diagram.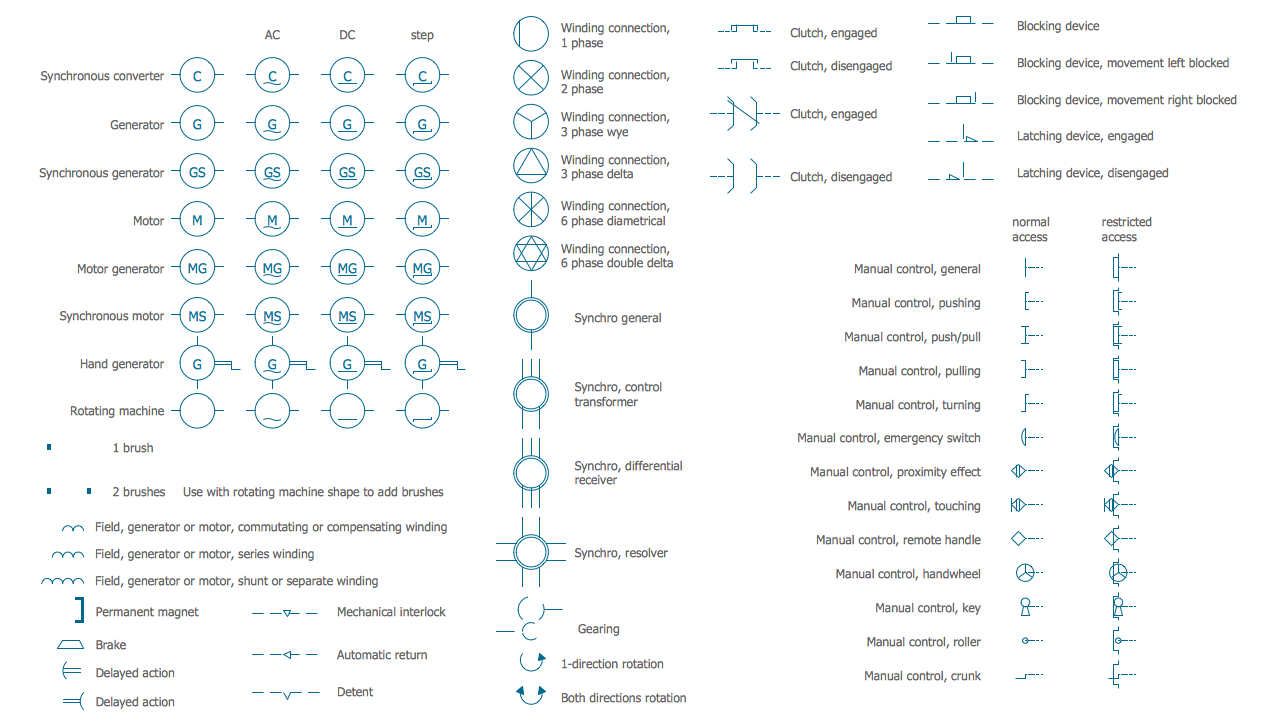
Picture: Electrical Symbols — Rotating Equipment
Related Solution:
ConceptDraw DIAGRAM diagramming and vector drawing software extended with Gym and Spa Area Plans solution from Building Plans area of ConceptDraw Solution Park is the best for simple and fast drawing the Fitness Plans.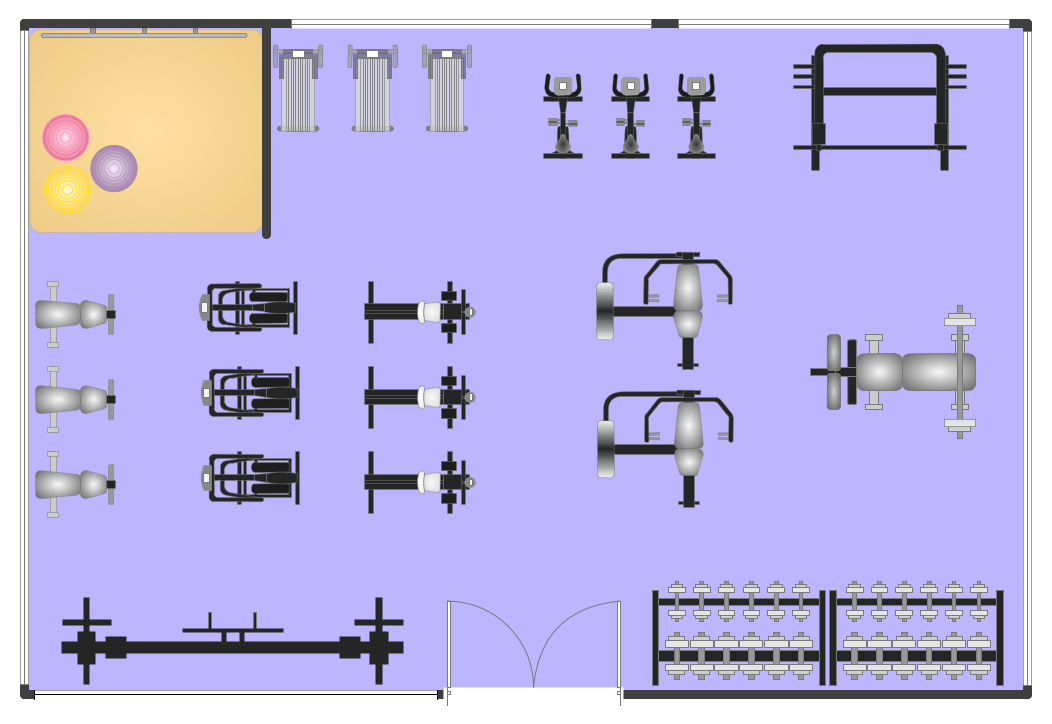
Picture: Fitness Plans
Related Solution:
Sometimes, it's not easy to fit everything you need into your premise. So, you can discover how to use building plan examples and get inspired from viewing them. You can find a lot of office layout and floor plans templates in the ConceptDraw Solution Park.
This drawing shows the sample of interior design of a middle-size restaurant. It was designed with a help of ConceptDraw Cafe and Restaurant Plans solution. Extensive libraries of vector objects of the interior element enabled us to design this example quickly and with no efforts. You can use this interior plan as a template while designing an interior for your own restaurant. It will help you to compose and organize elements of the interior, to bring a balance between free space and furniture in your establishment. It can be applied to organize and arrange the furniture, equipment and decorative elements in the restaurant interior and achieve balance between furniture and free space.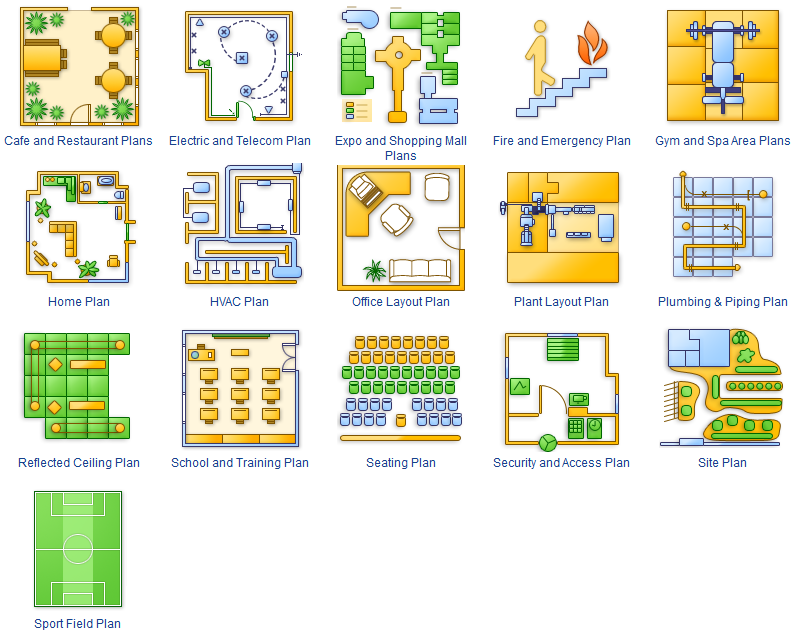
Picture: How To use Building Plan Examples
Related Solution:
ConceptDraw DIAGRAM diagramming and vector drawing software extended with Electrical Engineering Solution from the Industrial Engineering Area of ConceptDraw Solution Park affords you the easiest and fastest way for designing professional looking Electrical Schematics.
Picture: Electrical Schematics
Related Solution:
Apply Electrical Engineering solution for ConceptDraw DIAGRAM and numerous electric circuit symbols to 🔸 develop and illustrate all types of electrical circuits as ✔️ electrical circuit diagrams, ✔️ electrical schematics, ✔️ electrical diagram drawings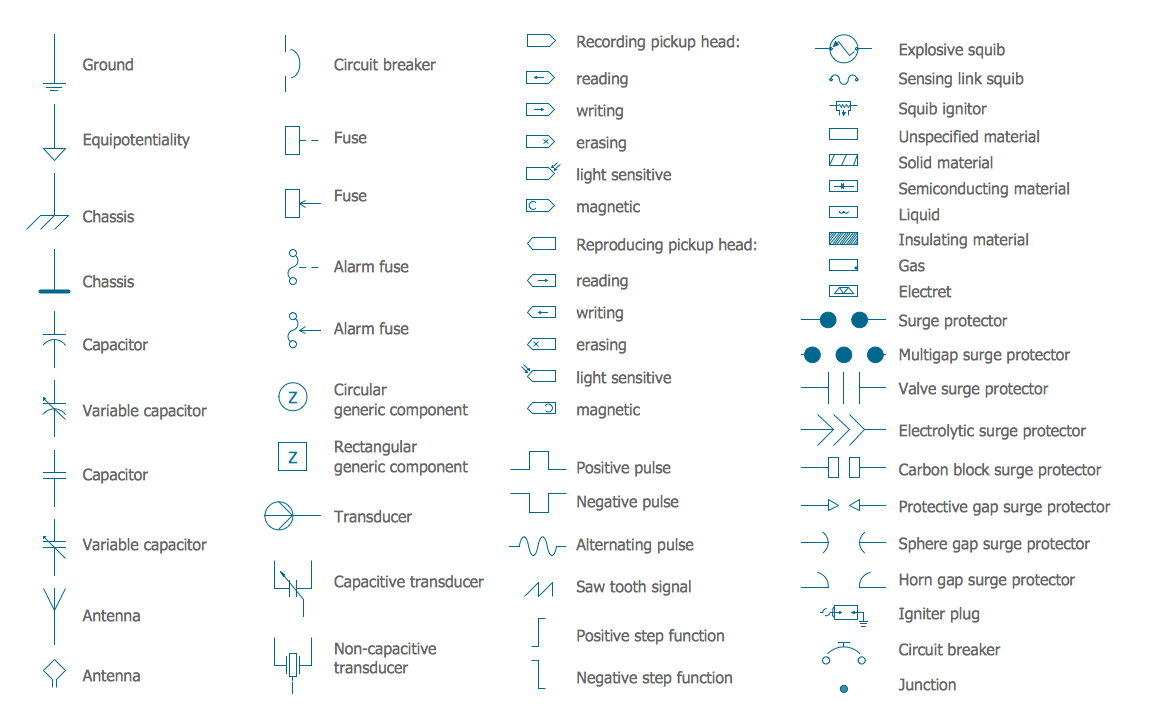
Picture: Electrical Circuits — Electrical Symbols
Related Solution:
The solution handles designs of any complexity, and the comprehensive library covers all key aspects of a transportation system. To further enhance your map design, there is the option to embed links, that can display station images or other relevant, important information. We have also included a set of samples in the solution, that show the possible real-world application — complex tube systems including the London Tube and New York City Subway show the level of detail possible when using the Metro Map Solution.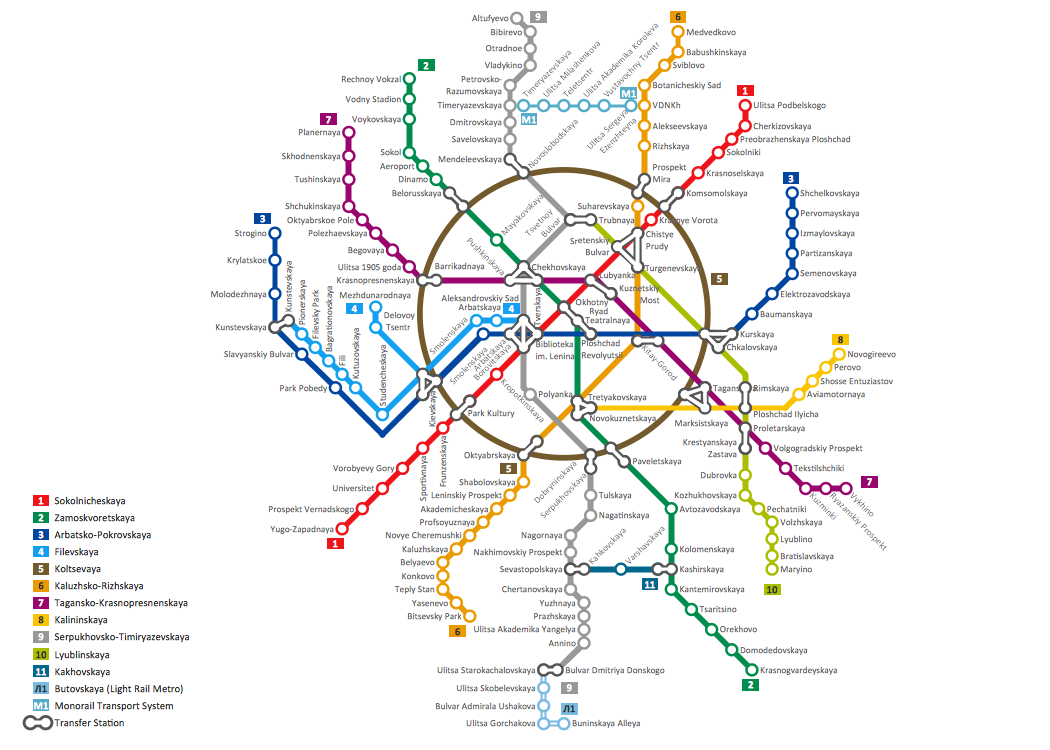
Picture: How to Draw Metro Map style infographics? Moscow, New York, Los Angeles, London
Related Solution: