
Example 1. Swim Lanes Flowchart. Identification and logging
This example was redesigned from the Wikimedia Commons file [commons.wikimedia.org]
This sample shows the Swim Lanes Flowchart of Identification and logging. A swim lane is a visual element of the flowchart that detaches the subprocesses of a business process, so the processes and decisions are visually grouped between the swim lanes. The swim lanes represent the responsibilities for the subprocesses and also the delays and mistakes that can occur. The swim lanes can be arranged vertically or horizontally as in our example. The shapes represent the subprocesses and the arrows represent how the information is passed between them.
Using the ready-to-use predesigned objects, samples and templates from the Cross-Functional Flowcharts Solution for ConceptDraw DIAGRAM you can create your own professional looking Cross-Functional Flowcharts of any complexity quick and easy.
The Flowcharts produced with ConceptDraw DIAGRAM are vector graphic documents and are available for reviewing, modifying, and converting to a variety of formats (image, HTML, PDF file, MS PowerPoint Presentation, Adobe Flash or MS Visio).
See also Samples:
NINE RELATED HOW TO's:
The Total Quality Management Diagram solution helps you and your organization visualize business and industrial processes. Create Total Quality Management diagrams for business process with ConceptDraw software.
Picture: TQM Diagram Example
Related Solution:
How do Fishbone diagrams solve manufacturing problems? Fishbone diagrams are successfully used in various fields of industries and manufacturing to analyze the set of possible causes and their effects. Fishbone diagram provides a process to clearly define the “Effect” and then puts you to thinking about the possible causes, based on the categories of common problems in manufacturing.
ConceptDraw DIAGRAM application extended with Fishbone Diagrams solution lets you construct Fishbone diagrams and represent globally recognized standards for manufacturing 6 Ms and 8 Ms.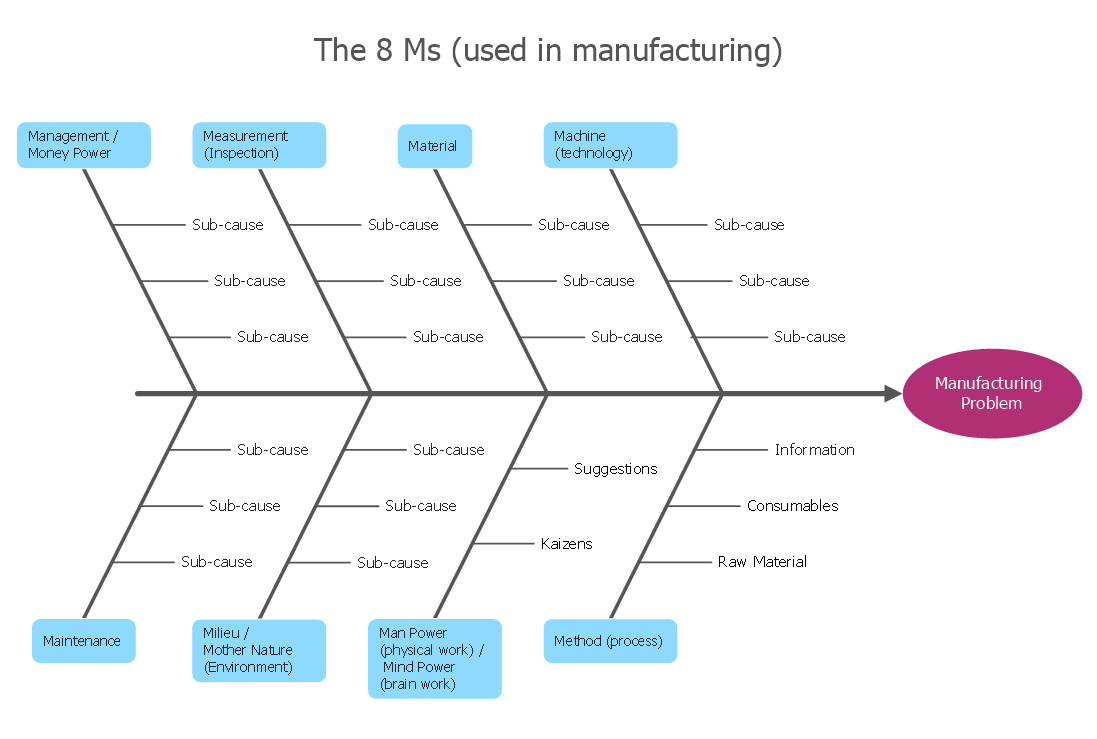
Picture: How Do Fishbone Diagrams Solve Manufacturing Problems
Related Solution:
ConceptDraw PROJECT is the Gantt chart software that implements critical path method to provide the user with a wide set of project management tools.
Picture: How to Discover Critical Path on a Gantt Chart
ConceptDraw DIAGRAM software is the best Mac software for drawing workflow diagrams. Its rich set of samples and templates, and specific features to draw diagrams faster make this software as comfortable as possible for drawing workflow diagrams.
Use the ConceptDraw DIAGRAM professional Mac OS X software for drawing workflow diagram. The Workflow Diagrams solution with its libraries and templates set make the possibility to identify resources that are required for work goal implementation. The process flow diagram identify flow which occurs as network of process dependencies, organizational decisions and interactions between departments. Usually workflow diagrams show business participants actions that carry product or service to the final destination, the consumer.
Picture: Workflow Diagram Software Mac
Related Solution:
ConceptDraw DIAGRAM is the world’s premier cross-platform business-diagramming tool. Many, who are looking for an alternative to Visio, are pleasantly surprised with how well they can integrate ConceptDraw DIAGRAM into their existing processes. With tens of thousands of template objects, and an easy method for importing vital custom objects from existing Visio documents, ConceptDraw DIAGRAM is a powerful tool for making extremely detailed diagrams, quickly and easily.
Picture: ConceptDraw DIAGRAM : Able to Leap Tall Buildings in a Single Bound
Related Solution:
Visio for Mac and Windows - ConceptDraw as an alternative to MS Visio. ConceptDraw DIAGRAM delivers full-functioned alternative to MS Visio. ConceptDraw DIAGRAM supports import of Visio files. ConceptDraw DIAGRAM supports flowcharting, swimlane, orgchart, project chart, mind map, decision tree, cause and effect, charts and graphs, and many other diagram types.
Picture: Is ConceptDraw DIAGRAM an Alternative to Microsoft Visio?
You need design a Bank UML Diagram? Now, thanks to the ConceptDraw DIAGRAM diagramming and vector drawing software extended with ATM UML Diagrams Solution from the Software Development Area, you can design without efforts any type of Bank UML Diagram you want - Class, Activity, Communication, Component, Composite structure, Deployment, Interaction overview, Object, Package, Profile, Sequence, State machine, Timing, Use case.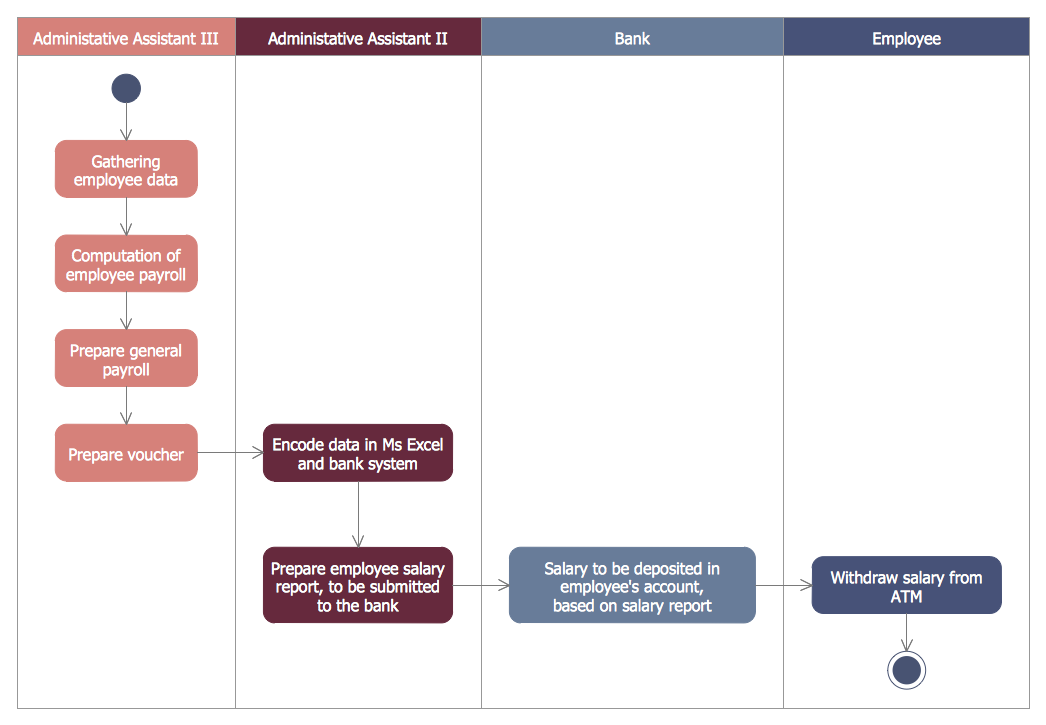
Picture: Bank UML Diagram
Related Solution:
The Flowcharts are widely used in engineering, architecture, science, analytics, government, politics, business, marketing, manufacturing, administration, etc.
Picture:
Flowchart of Products
Flowchart Examples
Related Solution:
Project timeline is a type of chart which allows visually represent the chronology of works for the project, placing the key points of the project (milestones) on a timescale.
You need to make professional looking project timeline? Create it with ConceptDraw DIAGRAM! ConceptDraw DIAGRAM extended with Timeline Diagrams Solution from the Management Area is the best timeline diagrams software
Picture: Project Timeline
Related Solution: