Made with
ConceptDraw
DIAGRAM 18

Software development with ConceptDraw products

Generally any project system includes the set of tools, techniques, methodologies, resources and procedures used to manage a project. It aids a project manager in effectively guiding a project to completion.

The project tool kit content is vary depending upon the application area, complexity of the project But there are the basic moments which are present at each project. So should be and a basic tools, helping to carry them out. This issue introduces the sampled scenario that describes the advantages which provide the application of ConceptDraw products as a tool kit for project management by the example of billing software development project.

  1. Project initiating

    Brainstorming and mind mapping techniques are used at all stages of the project to encourage creative thinking and solve problems. Software such as ConceptDraw MINDMAP has a number of advantages over the traditional methods for recording ideas such as flipcharts or whiteboards. The powerful functionality of ConceptDraw MINDMAP allows user to sort, structure and analyze information.

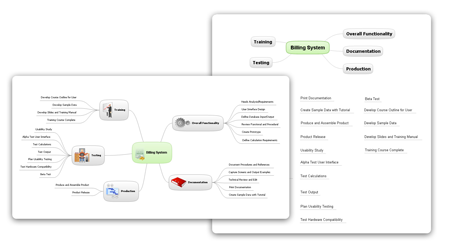
    Furthermore ConceptDraw MINDMAP is the ideal way to gather and store ideas and information related to project: list of project resources, tasks, list of information you need

    A map created using ConceptDraw MINDMAP can become a visual "explanatory note" for project. These qualities transform ConceptDraw MINDMAP into a powerful tool for project management.

  2. Project development

    ConceptDraw PROJECT allows you to present any ideas proceeded during brainstorming session in the form of a working project. With ConceptDraw PROJECT you can accurately determine initial project scope, available resources, plan tasks and make resource allocations. You see a clear plan of the tasks that need to be accomplished, and understand the relationship between tasks in respect to time and resources used.

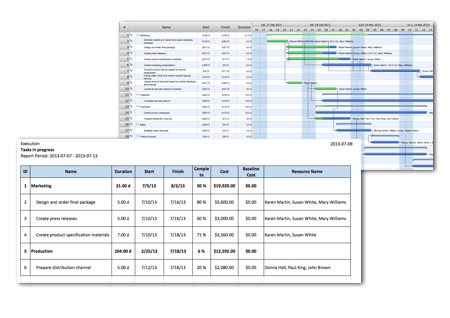
    Estimating work and managing schedules is a project management core competency. To make a good project plan you should state your intentions as fully as possible as you work major tradeoffs into a plan. Then in later stages of the project’s execution, when different factors make their influence on the project running process, and you need to revise some activities, the plan will help you keep enough discipline to not raise project risk by cutting out activities that you should do during initial planning moments.

    With the help ConceptDraw PROJECT you can get cost-effectiveness and timeliness data, being able to review, revise and adjust your plans to get successful results.

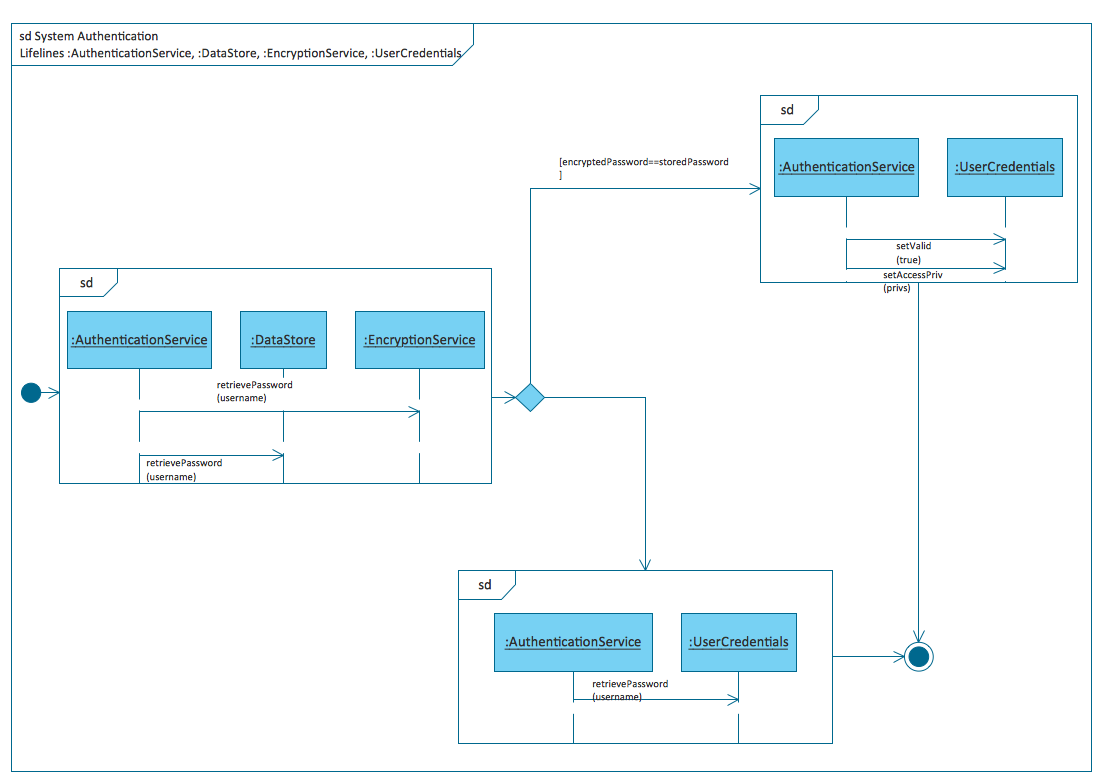
  3. Project flow visualization

    Usually Unified Modeling Language is applied by IT professionals to model computer applications.

    ConceptDraw DIAGRAM show itself as a comprehensive software tool that can help to integrate UML diagrams into software development process. Each UML diagram is designed to let developers and customers view a software system from a different perspective and in varying degrees of abstraction.

    ConceptDraw DIAGRAM as a UML Modeling software helps quickly and easily generate all varieties of standard UML diagrams using hundreds of professional ready-made objects and symbols: use case diagram, class diagram, sequence diagram, state chart diagram, activity diagram, component diagram, and deployment diagram. By the way, ConceptDraw DIAGRAM is not exclusively focused on UML – it is a little part of its overall functionality.

    It occurs rather helpful while designing a whole set of project documentation. Build organizational charts and data flow diagrams, add graphic issues to reports. Project documentation should be more comprehensible for stakeholders. Present ready-to-use documents in one of the suitable formats. You can easily achieve this by using ConceptDraw DIAGRAM huge functionality.

Software development with ConceptDraw products *

Thus you don't need to waste time and efforts, trying to combine different applications into one suite. Use ConceptDraw Products to develop your ideas and plans, to track and manage your projects. ConceptDraw products have shown themselves as a power tool to form the visualization environment for successful project implementation.


NINE RELATED HOW TO's:
There are many ways to define the flow of information within a system. Structured-systems analysis method often uses data flow diagrams to show data flow, data storages and data processing visualization. These diagrams are easy to develop and quite useful. Here is a dataflow diagram presenting an example of the manufacturing process flow. The oval process shapes represent a process that controls data within the current system. The process may produce data or make some action based on data. Data flows are represented by lines. They show the movement of information through the system. The direction of the data flow is depicted by the arrow. The external entities are shown by rectangles. They represent the external entities interacting with the system. The data store objects (unclosed rectangles) are used to show data bases participating in a process flow.Data Flow Diagram *
Picture: Data Flow Diagram
Related Solution:
Professional diagramming software for mac helps you create Cause and Effect diagram known as Fishbone diagram or Ishikawa diagram from ConceptDraw Business Solution. You will be offered to use templates, samples or draw your diagram using ConceptDraw Arrows10 TechnologyDraw Diagram on Mac *
Picture: Draw Diagram on Mac
ConceptDraw PROJECT is an effective tool for new and experienced users with a fine balance of usability and powerful functionality.ConceptDraw PROJECT Software Overview *
Picture: ConceptDraw PROJECT Software Overview
UML Diagram Estate Agency. This sample was created in ConceptDraw DIAGRAM diagramming and vector drawing software using the UML Use Case Diagram library of the Rapid UML Solution from the Software Development area of ConceptDraw Solution Park. This sample shows the work of the estate agency and is used by the estate agencies, building companies, at the trainings of the estate agencies, for understanding the working processes of the estate agencies.UML Use Case Diagram Example - Estate Agency *
Picture: UML Use Case Diagram Example - Estate Agency
Related Solution:
Architectural drawing allows to show the location of a building or ensemble of buildings on the ground, indicating the cardinal points. For centuries, people had been studying architecture in universities to learn how to draw building plans and now everyone can do it easily just using appropriate software. While developing the building plan, its graphic part, you can display the part of the floor or the entire floor of a building with an indication of the exact location of the drawn premise. Small-sized apartments does not restrict the advanced interior design opportunities. Here is a detailed and precise floor plan of a pretty small apartment. A furniture objects are added to show possible interior of this home. This plan can be used to help somebody with a floor layout and furniture arrangement. Having this floor plan in a pocket while shopping would be useful to check if there is enough rooms for a new furniture.How To Draw Building Plans
Picture: How To Draw Building Plans
Related Solution:
ConceptDraw DIAGRAM software is the best Mac diagramming software for drawing any type of diagrams. Its rich set of samples and templates, and specific features to draw with great visual appeal on Mac OS X.Mac Diagramming Software *
Picture: Mac Diagramming Software
To your mind, deliberation about the profits of creating organizational charts takes more time than actually creating itself. If lack of software is the only thing that stops you, you should know that organizational charts with ConceptDraw DIAGRAM are created within a few minutes. Owing to the great number of ready-to-use templates, you’ll get your chart easily. Chart is a very handy format for visually depicting official relations of an organization. Usually, an Orgchart (organizational chart) consists from simple geometrical shapes, containing an information on a position, personal data, and the lines that means responsibilities and accountabilities associated with position. ConceptDraw solution designed for making organizational charts enables one to create various org charts effortlessly using special templates and vector libraries.Organizational Charts with ConceptDraw DIAGRAM  *
Picture: Organizational Charts with ConceptDraw DIAGRAM
Related Solution:
Automatically create a presentation-quality diagram in one click with ConceptDraw DIAGRAM.Visual Presentations Made Easy <br>with Diagramming Software *
Picture: Visual Presentations Made Easy with Diagramming Software
Related Solution:
Users new to ConceptDraw PROJECT will find the Basic lessons an essential platform for familiarizing themselves with the program′s functions. This video lesson will teach you how to set up task trees and dependencies.Project —Task Trees and Dependencies *
Picture: Project —Task Trees and Dependencies
ConceptDraw
DIAGRAM 18