Made with
ConceptDraw
DIAGRAM 18

Introductory Guide to Rapid UML Solution

The UML diagrams in this Solution are divided into three broad categories:

  • Structure Diagrams
  • Behavior Diagrams
  • Interaction Diagrams
The seven Structure Diagrams are the core components that must be present in any system being modeled. These include Class, Component, Composite Structure, Deployment, Object, Package, and Profile diagrams. To assign functionality, we have three Behavior Diagrams: Activity, UML State Machine, and Use Case diagrams. The Interaction subgroup controls the flow of control and data, including diagrams for Communication, Interaction Overview, Sequence, and Timing.

For UML experienced users, the diagrams and objects will be familiar; while the Rapid Draw interface offers an intuitive way to connect and shape your diagrams. The solution is designed to make your UML diagramming simple, efficient, and effective. In the coming months, there will be more solutions making use of the Rapid Draw functionality.

ConceptDraw have released an exciting new UML solution, using our intuitive RapidDraw technology. In this video, you will learn about how RapidDraw works, and how it can help you create your UML diagrams quicker and easier than ever. Our step by step process shows you how to make even the most complex diagrams with just a few clicks.

Introductory Guide to Rapid UML Solution *

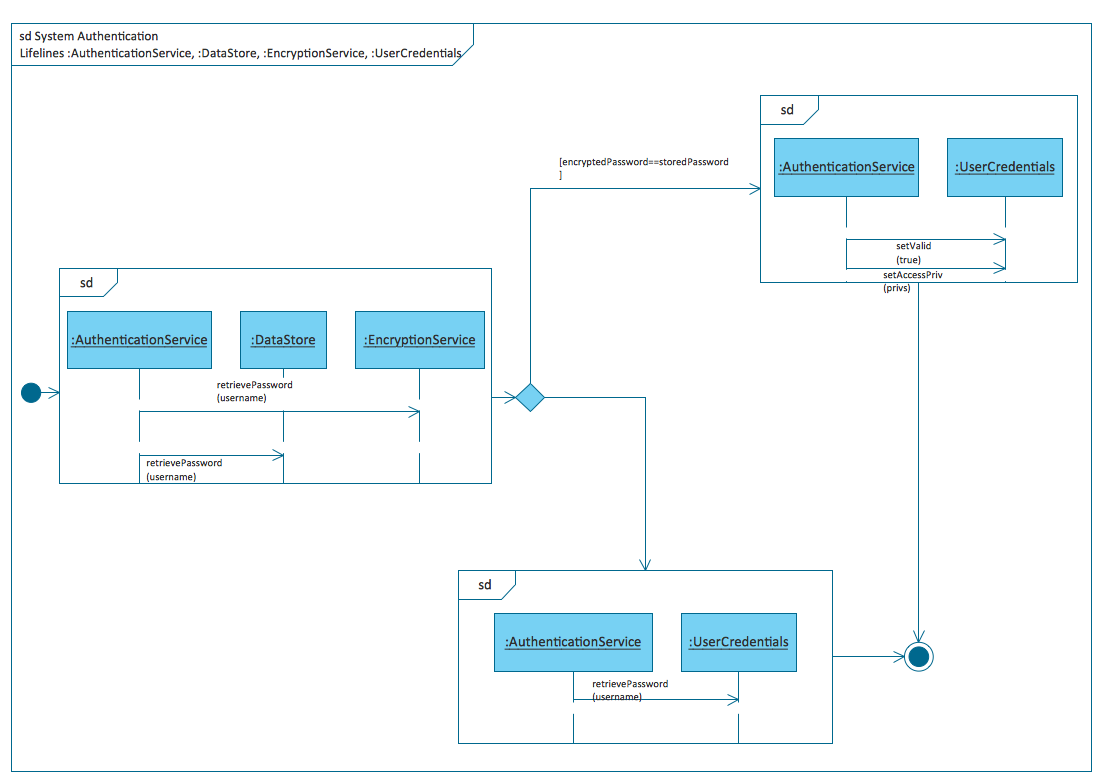
Pic.1. UML Interaction Overview Diagram - System authentication

The 13 diagrams contained in the Rapid UML Solution offer an essential framework for systems analysts and software architects to create the diagrams they need to model processes from the conceptual level on through to project completion. Thanks to the tools in this Solution, UML diagramming has never been faster or easier.
Try it today!

TEN RELATED HOW TO's:
IT world is extremely rational and logical. So what can be more precise than Software Diagrams to rate the results of work? Visual statistics is the best way to understand the data. This figure demonstrates the data flow diagram (DFD), which was created to describe the electronic system of custom purchase. This is the process of buying using electronic bar code scanning system. Such systems are used in large stores. The cashier scans the bar code, the system outputs the data on the price of the goods and carries out a purchase process. This DFD utilizes the Gane/Sarson notation. To create it The ConceptDraw DFD solution has been applied.Software Diagrams
Picture: Software Diagrams
With ConceptDraw Arrows10 Technology - You can delete a single connector, by using the Delete key. If you need to delete more than a single connector in a complex diagram that contains many relations there is a special Delete Links tool which deletes the connectors only, no other drawing objects are deleted.ConceptDraw Arrows10 Technology *
Picture: ConceptDraw Arrows10 Technology
You need design a Finite State Machine (FSM) diagram and dream to find a powerful software to make it easier? ConceptDraw DIAGRAM extended with Specification and Description Language (SDL) Solution from the Industrial Engineering Area of ConceptDraw Solution Park is the best software for achievement this goal.Finite State Machine *
Picture: Finite State Machine
Related Solution:
Nodes of any computer network are somehow organized in a hierarchy or a layout. Some of the common layouts like star network topology are more reliable and some like ring topology withstand high loads better. It is also important to distinguish logical topologies from physical. This diagram represents a typical view of the star network topology. The star network topology is one of the most frequently used network topologies in the majority of office and home networks. It is very popular because of its low cost and the easy maintenance. The plus of the star network topology is that if one computer on the local network is downed, this means that only the failed computer can not send or receive data. The other part of the network works normally. The minus of using star network topology is that all computers are connected to a single point-switch, or hub. Thus, if this equipment goes down, the whole local network comes down.Star Network Topology *
Picture: Star Network Topology
Related Solution:
All computer networks differ by various params, and their size is one of them. As global area networks are the biggest, personal area (PAN) networks are the smallest. Personal computers, smartphones and other devices that have possibility to connect to Internet form a personal network. This diagram was created using ConceptDraw Computer Network Diagrams to represent a typical components of Personal area network. A personal area network (PAN) is the connection of IT devices around an individual person. This sample of personal area network involves a notebook, a personal digital assistant (PDA), and a portable printer. Commonly a PAN contains such wireless devices as mouse, keyboard, smartphone and tablet. A wireless connection is typical for a PAN.Personal area (PAN) networks
Picture: Personal area (PAN) networks. Computer and Network Examples
Related Solution:
Big and complex projects sometimes need some simplification of plans and schedules. That's why Program Evaluation and Review Technique was invented and first implemented in 1958. You can create PERT diagrams effortlessly with ConceptDraw DIAGRAM and share them with your colleagues. Program Evaluation Review Technique (PERT) is a method that is used to assess and analyze projects. PERT is a valuable tool for the project management practice. PERT gives an assessment and analysis of the time needed to the project completion. A PERT chart is a visual tool that delivers a graphical view of a project timeline. It is used to display the sequences and dependences of project tasks necessary to complete a project. ConceptDraw DIAGRAM delivers the possibility to build a PERT along with other diagrams applied to assist management process by using its Seven Management and Planning Tools solution.Program Evaluation and Review Technique <br>(PERT) with ConceptDraw DIAGRAM  *
Picture: Program Evaluation and Review Technique (PERT) with ConceptDraw DIAGRAM
Related Solution:
The Rapid UML Solution from the Software Development area of ConceptDraw Solution Park helps you to create the UML Class Diagrams quick and easy using ConceptDraw DIAGRAM diagramming and vector drawing software.UML Class Diagram Tutorial *
Picture: UML Class Diagram Tutorial
Related Solution:
A Data Flow Diagram (DFD) is a graphical technique which allows effectively model and analyze the information processes and systems. The ability to fast and easy create the DFDs is made possible with Data Flow Diagrams solution from the Software Development area of ConceptDraw Solution Park. For designing the Data Flow Diagrams are used simple DFD flowchart symbols which are connected each other by arrows depicting the data flow from one step to another.DFD Flowchart Symbols *
Picture: DFD Flowchart Symbols
Related Solution:
This sample shows the Pie Donut Chart. It was created in ConceptDraw DIAGRAM diagramming and vector drawing software using the ready-to-use object from the Pie Charts Solution from Graphs and Charts area of ConceptDraw Solution Park. The Pie Donut Chart visualizes the percentage of parts of the whole and looks like as a ring divided into sectors. Pie Donut Charts are widely used in the business, statistics, analytics, mass media.Pie Donut Chart. Pie Chart Examples *
Picture: Pie Donut Chart. Pie Chart Examples
Related Solution:
Using ConceptDraw quality mind maps is a perfect addition to quality visualization in your company.Quality visualization in your company *
Picture: Quality visualization in your company
Related Solution:
ConceptDraw
DIAGRAM 18